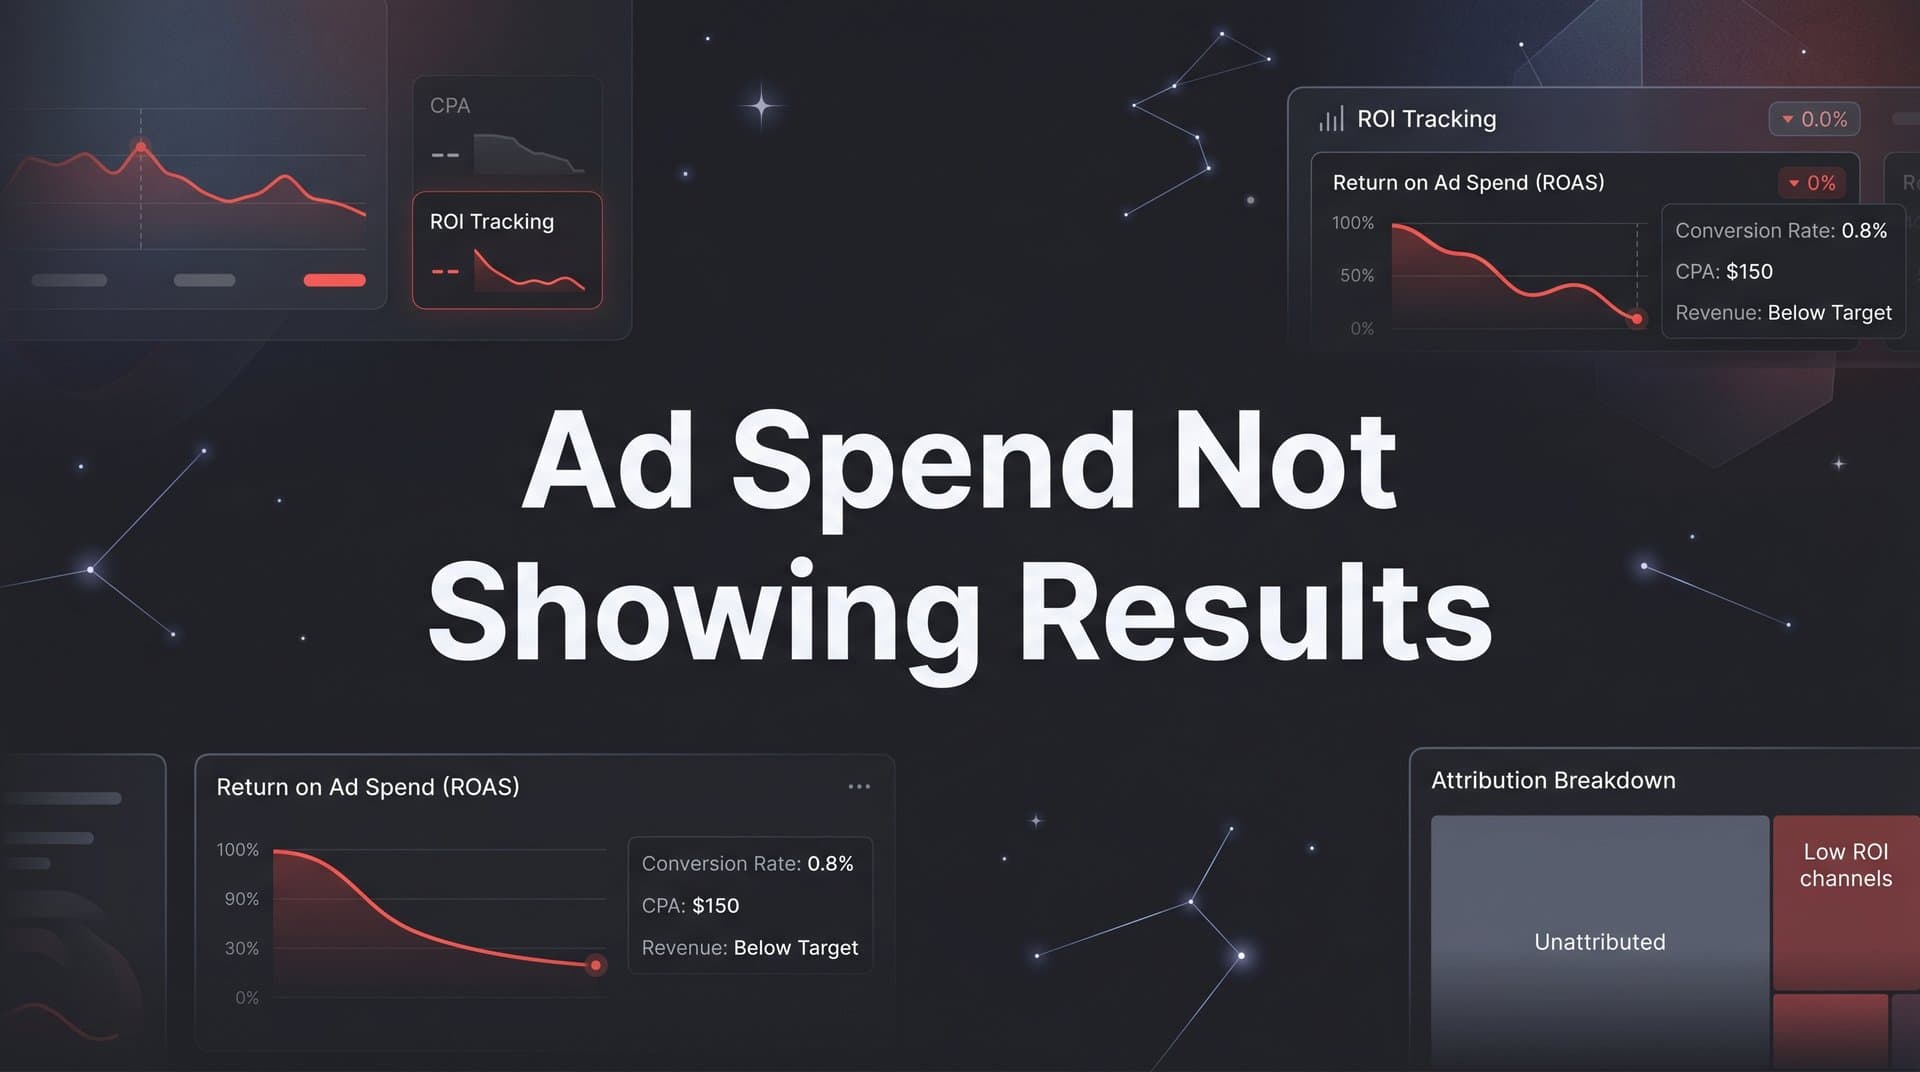
You're running paid campaigns, the budget is flowing, and the dashboards look active. But pipeline is flat, revenue attribution is murky, and leadership is asking hard questions.
If your ad spend is not showing results, the problem is rarely the ads themselves. More often, it is a tracking gap, a misaligned attribution model, or a breakdown somewhere in the customer journey that makes it impossible to connect spend to outcomes.
This guide walks B2B SaaS marketing teams through a structured diagnostic process to identify exactly where the disconnect is happening and how to fix it. You will learn how to audit your tracking setup, choose the right attribution model, verify your conversion data, and build a reporting foundation that ties ad spend directly to pipeline and revenue.
By the end of these steps, you will have a clear picture of what is actually driving results and the confidence to scale what works. Whether you are managing Google Ads, Meta campaigns, LinkedIn, or a multi-channel mix, the same principles apply.
The goal is not to run more ads. The goal is to run the right ads with the right data behind every decision.
Step 1: Audit Your Conversion Tracking Setup
Before you change a single campaign, budget, or creative, you need to know whether your tracking is actually working. This is the most common root cause of ad spend that appears to produce nothing. The data is incomplete, and incomplete data looks exactly like poor performance.
Start by checking that every key conversion event is firing correctly across all of your ad platforms. This means form submissions, demo requests, trial sign-ups, and any other action that signals intent. Open each platform's conversion diagnostics and confirm that events are being received, matched, and attributed as expected.
Next, compare your ad platform conversion counts against what your CRM actually recorded for the same time period. Discrepancies here are one of the most reliable indicators of a tracking problem. If your ad platform reports 40 demo requests but your CRM shows 18, you have either a tracking gap or a data quality issue that is distorting your entire performance picture.
One of the most important checks at this stage is whether you have server-side tracking or a Conversion API in place. Browser-based pixels alone have become increasingly unreliable. The iOS 14 privacy changes introduced in 2021 were a major inflection point, and ad blockers have continued to grow in adoption since then. If your tracking relies entirely on client-side pixels, a meaningful portion of your conversions are simply not being recorded. Server-side tracking routes conversion data through your own server before sending it to ad platforms, bypassing the browser restrictions that cause data loss.
While you are in the audit, look for duplicate event tracking. This happens when both a pixel and a server-side event fire for the same action without deduplication logic in place. Duplicate tracking inflates your reported conversions and makes campaigns look more effective than they are, which can lead to misguided budget decisions.
Common audit checklist items: Verify pixel installation on all key pages. Confirm Conversion API or server-side events are active. Check event deduplication settings. Compare ad platform data to CRM records. Review attribution windows on each platform.
Success indicator: Your ad platform conversion counts and CRM lead counts are within a reasonable margin of each other for the same time period. When these numbers align, you have a reliable foundation to build on.
Step 2: Map Your Attribution Model to Your Sales Cycle
Once your tracking is verified, the next question is whether your attribution model is actually suited to how your buyers make decisions. For most B2B SaaS companies, the answer is no.
Last-click attribution assigns all credit for a conversion to the final touchpoint before someone converted. On paper, this sounds logical. In practice, it systematically undervalues every channel that contributed earlier in the journey. If a prospect first discovered you through a LinkedIn ad, engaged with a retargeting campaign on Google, and then clicked a branded search ad before booking a demo, last-click gives all the credit to branded search. LinkedIn and Google display get nothing, and your budget decisions will reflect that distortion.
This is a particularly serious problem for B2B SaaS companies because sales cycles are long. Buyers often interact with your brand across multiple weeks or months before converting. A single-touch attribution model cannot capture that complexity.
The natural question becomes: which attribution model should you use instead? There is no single right answer, but multi-touch models give you a far more realistic view of channel contribution.
Linear attribution distributes credit equally across all touchpoints in the journey. This is a good starting point if you want to understand the full scope of channel involvement without over-weighting any single interaction.
Time-decay attribution gives more credit to touchpoints that occurred closer to the conversion. This can work well for shorter sales cycles where recency is a meaningful signal.
Data-driven attribution uses algorithmic modeling to assign credit based on which touchpoints actually influenced conversion outcomes. This is the most sophisticated option and requires sufficient conversion volume to generate reliable models.
The practical exercise here is to identify which channels are being unfairly penalized or over-credited under your current model. You may find that awareness campaigns on LinkedIn or display are driving significant pipeline contribution that never shows up in last-click reports. Cutting those channels based on last-click data is a common and costly mistake.
Success indicator: You can explain why each channel receives the credit it does, and the logic aligns with how your buyers actually research and convert. If you cannot explain the credit distribution, your model is not working for you.
Step 3: Connect Ad Data to Pipeline and Revenue
Here is where most B2B SaaS marketing teams have the biggest gap. They are measuring clicks, impressions, and cost per lead. But leadership is asking about pipeline and revenue. These are fundamentally different questions, and answering the second one requires a different data setup.
The shift you need to make is from lead-level reporting to opportunity-level and revenue-level reporting. This means linking your ad campaign data directly to CRM pipeline stages and closed-won revenue, not just to the top of the funnel where leads first appear.
Start by identifying which campaigns, ad sets, and creatives are generating qualified pipeline. Not raw lead volume. Qualified pipeline. A campaign that generates 100 leads but zero pipeline opportunities is not performing, regardless of what the cost per lead looks like. A campaign that generates 10 leads and five pipeline opportunities is outperforming it by every meaningful measure.
Revenue attribution takes this one step further. It lets you distinguish between campaigns that drive a high volume of low-quality leads and campaigns that drive fewer but higher-value opportunities. This distinction directly affects how you should allocate budget, and it is impossible to see without connecting your ad data to your CRM.
The integration you need is between your ad platforms and your CRM. When every opportunity and closed deal can be traced back to its originating campaign, you gain the ability to calculate metrics that actually matter to the business.
The metrics to prioritize at this stage:
Cost per pipeline opportunity: How much did you spend to generate each qualified opportunity in your CRM?
Cost per acquired customer: How much did you spend on the campaigns that ultimately resulted in closed-won deals?
Return on ad spend tied to revenue: For every dollar you spent, how much closed revenue can be attributed to those campaigns?
These numbers tell a completely different story than cost per lead. And they give you the evidence you need to defend budget decisions, identify what to scale, and cut what is not contributing to revenue.
Success indicator: For any given campaign, you can state the cost per pipeline opportunity and the cost per closed deal, not just the cost per lead.
Step 4: Analyze the Full Customer Journey for Drop-Off Points
Now that you have attribution data and pipeline connections in place, it is time to look at the full journey from first ad click to conversion. This step is about finding where prospects are disengaging, stalling, or falling out of the funnel entirely.
Trace the path that your converted customers actually took. Which channels did they interact with first? What happened in between? Which touchpoints appeared most consistently in journeys that ended in closed deals? This analysis often reveals patterns that are completely invisible in single-touch or platform-level reporting.
Multi-touch journey data is particularly valuable here because it shows you which channel combinations and sequences lead to the highest close rates. You might find that prospects who engaged with a LinkedIn thought leadership ad before seeing a retargeting ad converted at a significantly higher rate than those who came in through direct search alone. That insight has direct implications for how you structure your campaign mix.
One of the more counterintuitive findings you may encounter is that certain campaigns are driving high-intent traffic that converts well downstream, even though they do not receive direct conversion credit. An awareness campaign that introduces your brand to a prospect who later converts through a branded search term is contributing meaningfully to pipeline. Without journey-level data, that contribution is invisible.
Equally important is examining your attribution windows. If your sales cycle runs 60 to 90 days but your attribution window is set to 30 days, you are systematically under-counting the conversions that should be credited to your campaigns. Adjusting your attribution windows to match the actual length of your sales cycle can immediately reveal performance that was previously hidden.
Also look at where drop-off is happening post-click. If a campaign is driving strong click-through rates but prospects are not converting on the landing page, the issue may not be the ad at all. It may be message mismatch, a friction-heavy form, or a landing page that does not convert the specific audience segment the ad targeted.
Success indicator: You can identify at least one channel or campaign that was undervalued by your previous attribution model but is actually contributing meaningfully to pipeline when viewed through full journey data.
Step 5: Feed Enriched Conversion Data Back to Ad Platforms
Most marketing teams think about conversion tracking as a one-way flow: ad platforms send traffic, your website captures conversions, and you report on what happened. But the most effective B2B SaaS teams treat it as a two-way loop. The data you send back to ad platforms is just as important as the data you collect.
Here is why this matters. Ad platforms like Meta and Google use conversion signals to power their bidding algorithms and audience targeting. When those signals are weak, delayed, or based on low-quality events like all form submissions regardless of lead quality, the algorithms optimize toward the wrong outcomes. They find more people who fill out forms, not more people who become customers.
When you send enriched, first-party conversion data back to these platforms, you change what they are optimizing for. Instead of optimizing toward raw form fills, you can train the algorithms on qualified leads, pipeline opportunities, and closed-won revenue. Over time, this improves the quality of the traffic your campaigns generate.
Server-side conversion events are the mechanism for doing this reliably. Using tools like Meta's Conversions API or Google's enhanced conversions, you can pass pipeline events and revenue data as offline conversions. This allows the ad platform to understand not just who clicked your ad, but who eventually became a customer, and find more people like them.
There is an important technical detail to address at this stage: event deduplication. If you are running both a browser-side pixel and server-side tracking simultaneously, you need deduplication logic to prevent the same conversion from being counted twice. Both Meta and Google provide deduplication frameworks using event IDs. Make sure these are configured correctly before you scale this setup.
The practical impact of enriched data:
Better audience targeting: Ad platforms build lookalike and similar audiences based on your conversion signals. Better signals produce higher-quality audiences.
Smarter bidding: When algorithms understand which conversions actually lead to revenue, they can bid more efficiently toward those outcomes.
Reduced wasted spend: Optimizing toward revenue rather than volume naturally filters out low-intent traffic over time.
Success indicator: Over the weeks following this setup, you observe improvements in lead quality and a reduction in the gap between lead volume and pipeline contribution from your paid campaigns.
Step 6: Build a Unified Reporting Dashboard
You have fixed the tracking, aligned the attribution model, connected ad data to pipeline and revenue, analyzed the customer journey, and enriched your conversion signals. The final step is making sure all of this data is visible in one place, consistently, so your team can make confident decisions without bouncing between five different tools.
Fragmented reporting is one of the most underestimated sources of bad marketing decisions. When your Google Ads data lives in one dashboard, your LinkedIn data in another, your CRM pipeline in a third, and your revenue in a spreadsheet, you are not really analyzing performance. You are reconciling data. Those are very different activities, and reconciliation takes time that should be spent on optimization.
A unified reporting dashboard consolidates data from all ad platforms, your CRM, and your website into a single view where you can compare channel performance on equal terms. This is where you define and track the core metrics that matter for your business.
Core metrics for a B2B SaaS attribution dashboard:
Cost per qualified lead: Filtered by lead quality signals from your CRM, not just raw form submissions.
Cost per pipeline opportunity: How much spend is required to generate each CRM opportunity, by channel and campaign.
Cost per acquired customer: The full cost of acquiring a closed-won deal, attributed back to the campaigns that influenced it.
Return on ad spend tied to revenue: Actual revenue attributed to campaigns, not just platform-reported conversion values.
Consistent UTM parameters and naming conventions are the infrastructure that makes this work. If your campaigns are tagged inconsistently, your attribution data will be fragmented even if your tools are connected. Establish a naming convention and enforce it across every campaign, ad set, and creative before you build your reporting layer.
Finally, set a reporting cadence. Weekly performance reviews for tactical decisions. Monthly reviews for budget allocation. Quarterly reviews for channel strategy. Each review should be driven by revenue attribution data, not platform-reported metrics that may not reflect actual business outcomes.
Success indicator: You can answer the question of which campaign generated the most revenue this month without switching between multiple tools or spreadsheets. That single capability changes how your team operates.
Putting It All Together: From Blind Spend to Revenue Clarity
Let's recap what you have built through these six steps. You started with a tracking audit to ensure your conversion data is accurate and complete. You aligned your attribution model to the actual complexity of your buyer journey. You connected ad data to pipeline and revenue so you can measure what actually matters to the business. You analyzed the full customer journey to find hidden contributors and drop-off points. You enriched your conversion signals to improve ad platform performance over time. And you consolidated everything into a unified reporting dashboard that supports confident, data-driven decisions.
Each step builds on the previous one. You cannot make good attribution decisions without reliable tracking. You cannot connect spend to revenue without the right attribution model. You cannot optimize your ad platform algorithms without enriched conversion data. The sequence matters.
The most important thing to take away from this guide is that ad spend not showing results is almost always a data problem before it is a creative or targeting problem. Fix the data foundation first, and every other optimization decision becomes more reliable.
This is exactly what Cometly is built to do. Cometly connects your ad platforms, CRM, and website to track the entire customer journey in real time. It supports server-side conversion tracking, multi-touch attribution, pipeline and revenue reporting, and enriched data feeds back to Meta, Google, and more, all within a single platform. Instead of stitching together six different tools to complete these six steps, Cometly gives B2B SaaS marketing teams one place to see what is actually driving revenue.
Start with the tracking audit. Work through each step in sequence. And when you are ready to connect all of it in one place, Get your free demo and see how Cometly helps B2B SaaS teams turn ad spend into revenue clarity.