

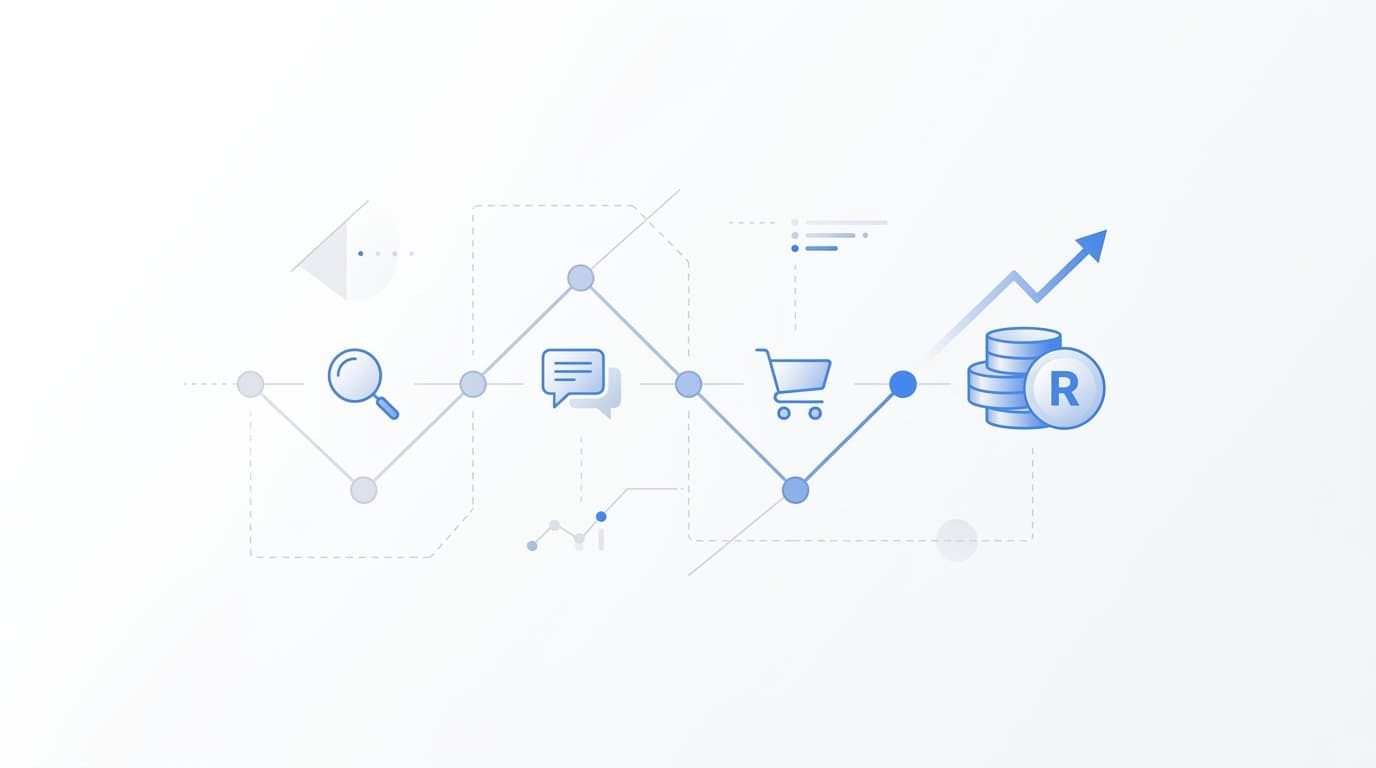
Most marketing teams operate with a fragmented view of how prospects actually move from first awareness to signed contract. Leads are coming in, but pinpointing which touchpoints drove the decision, which channels accelerated the deal, or where prospects quietly dropped off is another matter entirely.
A buyers journey map solves this by giving your team a structured, data-backed picture of every stage a buyer moves through before they convert. For B2B SaaS companies especially, where sales cycles can span weeks or months and involve multiple stakeholders, mapping the buyers journey is not a one-time branding exercise.
It is a living framework that informs your content strategy, your ad spend, your attribution model, and ultimately your revenue decisions. Think of it like a GPS for your pipeline: without it, you are navigating by gut feel. With it, you can see exactly where buyers are, where they are going, and what is slowing them down.
This guide walks you through exactly how to build a buyers journey map from scratch. You will learn how to define your buyer stages, gather the right data, identify critical touchpoints, and connect your map to real attribution insights so you can act on what you find.
By the end, you will have a buyers journey map that does more than sit in a slide deck. It will become a strategic tool your marketing and sales teams actually use to prioritize spend, improve messaging, and accelerate pipeline.
Step 1: Define Your Buyer Stages with Precision
The biggest mistake teams make when building a buyers journey map is defaulting to the generic three-stage model: Awareness, Consideration, Decision. While these labels are familiar, they are too broad to drive real action in a B2B SaaS context.
Your buyers are not moving through three vague phases. They are moving through a series of specific mental shifts, each one requiring different information, reassurance, and proof. Your stage definitions need to reflect that nuance.
For most B2B SaaS companies, a more useful set of stages looks something like this:
Problem Aware: The buyer recognizes something is not working but has not yet framed it as a problem with a solution. They are searching for context, not products.
Solution Aware: The buyer understands a category of solution exists and is beginning to explore what options look like. They are comparing approaches, not vendors.
Vendor Evaluating: The buyer has narrowed their focus to specific tools or platforms and is actively comparing them. This is where your product pages, demos, and competitor comparisons become critical.
Proof Seeking: The buyer is nearly convinced but needs validation. They want case studies, references, ROI data, and answers to implementation questions. Multiple stakeholders are often involved at this stage.
Decision Ready: The buyer is ready to move forward but may be navigating internal approval processes. Speed and clarity matter most here.
Once you have defined your stages, align them with your CRM pipeline stages. This is what connects your journey map to real deal data rather than keeping it as a theoretical document. If your CRM has a stage called "Demo Completed," that likely maps to your Vendor Evaluating or Proof Seeking stage. Make that connection explicit.
For each stage, document what the buyer is thinking, feeling, and doing. What questions are they asking? What fears or hesitations are present? What would move them forward? This behavioral depth is what separates a useful map from a generic diagram.
One common pitfall here is defining stages based on your internal sales process rather than actual buyer behavior. Always anchor your definitions to what the buyer is experiencing, not what your sales team is doing at that moment.
You will know this step is complete when every team member, from marketing to sales to leadership, agrees on what each stage means and can confidently identify which stage a given prospect is in based on their behavior.
Step 2: Gather Qualitative and Quantitative Data from Real Buyers
A buyers journey map built on assumptions is not a map. It is a guess dressed up in a framework. The only way to build something your team can trust and act on is to ground it in real buyer data from both qualitative and quantitative sources.
Start with qualitative research. The richest source of insight is direct conversation with people who have recently bought from you or recently chosen a competitor instead.
Interview recently closed customers to understand what triggered their search, what content or channels influenced their thinking, who else was involved in the buying committee, and what finally pushed them to decide. These conversations will surface touchpoints and friction points you never would have identified from analytics alone.
Equally important: interview recently lost deals. Prospects who evaluated you and chose someone else will tell you exactly where your journey broke down. That is some of the most valuable data you can collect.
Beyond interviews, mine your existing qualitative sources. Sales call recordings often contain unfiltered buyer language that reveals how prospects frame their problems. Win/loss analysis from your sales team captures patterns across many deals. Support ticket themes can reveal questions that buyers are still asking after they convert, which signals gaps in your pre-sale content.
On the quantitative side, pull data from your CRM to understand stage conversion rates, average time in each stage, and common exit points. Your ad platform data will show which campaigns are driving early-stage traffic versus bottom-of-funnel activity. Website analytics reveal which pages buyers visit, in what sequence, and where they exit.
Your conversion event data is particularly valuable here. If you have tracking set up for key actions like demo requests, pricing page visits, or content downloads, you can begin to see which touchpoints cluster around conversion moments.
Key questions to bring into every buyer interview include: What triggered the initial search? What content or resources did you find most useful? Which channels did you use to research options? Who else was involved in the decision, and what mattered to them?
A common pitfall at this stage is relying solely on your sales team's assumptions about why deals win or lose. Sales teams have valuable perspective, but they are not inside the buyer's head. Their assumptions often reflect internal narratives rather than buyer reality. Real buyer input is irreplaceable.
Aim for data from at least ten to fifteen real buyer conversations, supplemented by quantitative data from your CRM and tracking tools. That combination gives you enough signal to build a map that reflects actual behavior rather than internal bias.
Step 3: Map Every Touchpoint Across the Journey
Now that you have defined your stages and gathered real buyer data, it is time to map every touchpoint a buyer might encounter on their way to becoming a customer. This is where the buyers journey map starts to become genuinely useful for your marketing and sales teams.
Begin by listing every channel and content type in your current mix: paid ads, organic search, social posts, email sequences, webinars, demo pages, review sites, direct sales outreach, and any other point of contact. Then, using the data you gathered in Step 2, assign each touchpoint to the buyer stage where it most commonly appears.
This assignment should be driven by data, not intuition. If your buyer interviews consistently reveal that prospects discover you through organic search before they ever engage with a paid ad, that tells you organic search is a Problem Aware or Solution Aware touchpoint. If review sites like G2 come up repeatedly in the Proof Seeking stage, that is where they belong on your map.
As you work through this process, categorize touchpoints by their role in the journey:
First-touch touchpoints: How buyers find you for the first time. Often organic search, paid social, or peer referral.
Mid-journey touchpoints: How buyers evaluate you over time. Often includes your website, demo pages, email nurture, comparison content, and review platforms.
Last-touch touchpoints: What closes the deal. Often a direct sales conversation, a pricing discussion, or a final piece of proof like a reference call or ROI analysis.
Use multi-touch attribution data to validate these assignments. Which touchpoints appear most frequently in the journeys of prospects who converted? Which ones appear in journeys that stalled or dropped off? This comparison will quickly reveal which touchpoints are genuinely influential versus which ones are just present.
Pay close attention to gaps. Are there stages where buyers have questions but no content or channel exists to answer them? A gap in your touchpoint map is a gap in your buyers experience, and it is likely contributing to drop-off.
One important pitfall to avoid: mapping only the touchpoints you own and control. B2B buyers frequently rely on third-party sources like G2, Capterra, LinkedIn peer groups, and direct referrals from colleagues. These touchpoints heavily influence decisions even though you do not control them. Acknowledge them on your map and think about how you can influence them indirectly, through review generation programs, community engagement, or partner relationships.
Your touchpoint map is in good shape when no buyer stage has fewer than three documented touchpoints, and each touchpoint is clearly tied to a specific buyer action or question.
Step 4: Identify Drop-Off Points and Friction in the Journey
Every buyers journey has weak links. The goal of this step is to find them before your competitors do.
Start by analyzing conversion rates between each stage of your map. Where is the largest percentage of prospects stalling or exiting? A steep drop between Solution Aware and Vendor Evaluating might indicate that your messaging is not compelling enough to pull buyers deeper into evaluation. A drop between Proof Seeking and Decision Ready might signal that your late-stage content or sales process is creating friction rather than removing it.
Cross-reference these drop-off points with the touchpoint gaps you identified in Step 3. If buyers are exiting at the Vendor Evaluating stage and you have minimal comparison content or limited social proof at that stage, you have found a likely cause.
Look at patterns in your lost deals. At which stage did those prospects exit, and what objection or question went unanswered? Sales call recordings and win/loss notes are valuable here. If multiple lost deals mention confusion about pricing, that is a friction point worth addressing directly.
Beyond CRM data, use behavioral signals to pinpoint where interest declines. Ad click-through rates that drop sharply for mid-funnel campaigns, email open rates that fall off in your nurture sequences, and session data showing high exit rates on specific pages all point to friction.
Common friction categories to investigate include:
Messaging mismatch: The language you use does not resonate with how buyers describe their problem.
Missing social proof: Buyers at the Proof Seeking stage cannot find evidence that your product works for companies like theirs.
Slow follow-up: Demo requests or contact form submissions are not getting a timely response, and buyers move on.
Unclear pricing: Buyers cannot get a sense of cost without a sales conversation, which creates hesitation.
Insufficient product education: Buyers do not fully understand what your product does or how it would fit into their workflow.
A common pitfall here is fixating on top-of-funnel drop-off while ignoring late-stage friction. Late-stage drop-off is often where your highest-value deals are lost, and it deserves equal attention.
This step is complete when you can name the top two or three friction points in your journey with supporting data behind each one, not just a hunch.
Step 5: Align Content and Ad Spend to Each Stage
A buyers journey map only creates value when it changes how you allocate resources. This step is where strategy meets execution.
For each buyer stage, define which content types are most appropriate. Early stages like Problem Aware and Solution Aware call for thought leadership content, educational blog posts, and problem-framing videos that help buyers understand their situation. These formats build trust and drive organic discovery.
Middle stages like Vendor Evaluating and Proof Seeking require a different kind of content. Comparison pages, product demos, detailed case studies, customer testimonials, and integration documentation all serve buyers who are actively evaluating whether your product is the right fit. This is not the place for broad awareness content.
Decision Ready buyers need content that removes the final barriers: ROI calculators, implementation guides, security documentation, and clear answers to procurement questions. Speed and specificity matter most at this stage.
Once you have defined the right content types for each stage, audit your existing content library against the map. What do you have? What is missing? This audit will often reveal that most teams are over-invested in awareness content and under-invested in the middle and late stages where deals are actually won or lost.
Apply the same thinking to your paid ad campaigns. Top-of-funnel campaigns should drive awareness and problem recognition among your target audience. Retargeting campaigns should speak directly to buyers in the evaluation and proof-seeking stages, using messaging that addresses their specific questions and concerns at that point in the journey.
Use attribution data to validate that your spend allocation matches where buyers actually spend their time. If your attribution platform shows that a high percentage of converting journeys include a specific retargeting campaign or content type, that is a signal to invest more there. If a channel is consuming significant budget but rarely appears in converting journeys, that warrants a closer look.
Adjust budget toward the channels and touchpoints that appear most frequently in high-value converting journeys. This is where your buyers journey map starts directly influencing revenue decisions rather than just informing strategy documents.
A common pitfall is over-investing in awareness content while neglecting the decision stage. Comparison pages, competitive analyses, and ROI-focused content are often under-resourced, even though they directly influence whether deals close.
You will know this step is working when every buyer stage has at least two content assets and at least one paid channel actively supporting it, and your spend allocation is backed by attribution data rather than habit or assumption.
Step 6: Connect Your Map to Attribution Data for Ongoing Measurement
Here is where most buyers journey maps fall short: they get built, shared in a team meeting, and then quietly archived. The reason is simple. Without a connection to live data, the map becomes stale almost immediately, and teams lose confidence in it.
The solution is to treat your buyers journey map as a dynamic measurement framework, not a finished document.
Start by connecting your map to a multi-touch attribution platform that can show you which touchpoints appear in the journeys of your best customers. This is the difference between a map built on interviews and assumptions versus one continuously validated by real behavioral data. Understanding attribution models is essential here, as different models will surface different insights about which touchpoints deserve credit at each stage.
Monitor which channels contribute at each stage of the journey, not just at the final conversion point. Last-touch attribution will tell you what closed the deal. But multi-touch attribution will tell you what built the relationship that made closing possible. Both views are necessary for a complete picture of how your buyers journey actually works.
Set up conversion events that correspond to stage transitions. A prospect moving from Problem Aware to Vendor Evaluating should trigger a trackable event, whether that is a demo request, a pricing page visit, or a content download. These micro-conversions give you visibility into the journey in real time rather than only at the point of final conversion. This is a core part of effective conversion tracking for B2B SaaS teams.
Review your map at least quarterly using updated attribution data. Buyer behavior shifts as markets evolve, competitors change their positioning, and your own product expands. A map that accurately reflected your buyers journey six months ago may already be outdated. Regular review keeps it grounded in current reality.
Platforms like Cometly are built specifically for this kind of ongoing validation. Cometly connects your ad platforms, CRM, and website to provide a real-time view of every touchpoint across the customer journey. This means you can see which channels are contributing at the Problem Aware stage, which touchpoints appear most often before a demo request, and which campaigns are driving the highest-value pipeline, all from a single source of truth. For B2B SaaS teams navigating complex, multi-stakeholder journeys, that level of visibility is what turns a journey map from a static diagram into a living growth tool. You can explore more about B2B attribution to understand how this connects to your broader revenue strategy.
A common pitfall is building the map once and never revisiting it. Buyer behavior changes, and your map should evolve with it. Quarterly reviews informed by fresh attribution data and periodic customer interviews are what keep the map useful over time.
This step is complete when you can pull a report showing which channels and touchpoints are most active at each buyer stage, and that data is updated at least monthly.
Putting Your Buyers Journey Map to Work
You now have a framework for building a buyers journey map that connects directly to revenue. Here is a quick checklist to validate your map is complete before you put it into practice:
Stage definitions: Every buyer stage is defined by buyer behavior and mindset, not internal process labels, and your team agrees on what each stage means.
Real buyer data: Your map is grounded in at least ten to fifteen buyer conversations plus supporting quantitative data from your CRM and tracking tools.
Touchpoint coverage: Every stage has at least three documented touchpoints, including third-party channels like review sites and peer referrals.
Friction identified: You can name your top two or three friction points with data to back them up.
Content and spend aligned: Every stage has dedicated content assets and at least one paid channel supporting it.
Attribution connected: Your map is linked to live attribution data that is reviewed at least monthly and updated quarterly.
The most important thing to remember is that this map is a living tool. Share it across your marketing and sales teams so everyone is working from the same picture of how buyers actually move through your pipeline. When marketing and sales align on buyer stages and touchpoints, messaging becomes more consistent, handoffs become smoother, and deals move faster.
Revisit the map every quarter with fresh attribution data and updated customer interviews. Markets shift, buyer expectations evolve, and your map should reflect those changes.
If you are ready to connect your buyers journey map to real-time data across every channel, Get your free demo and see how Cometly's multi-touch attribution and customer journey analytics can turn your map into a data-driven growth engine.



