

You're running paid ads on Google and LinkedIn, publishing content, sending email sequences, and your sales team is booking calls. Leads are coming in. But when someone asks which channel is actually driving pipeline, the honest answer is: you're not entirely sure.
This is the reality for most B2B SaaS marketing teams. Spend is distributed across multiple channels, buyers interact with your brand dozens of times before converting, and the data telling you what worked is fragmented across ad platforms, your CRM, and your website analytics. The result is guesswork dressed up as strategy.
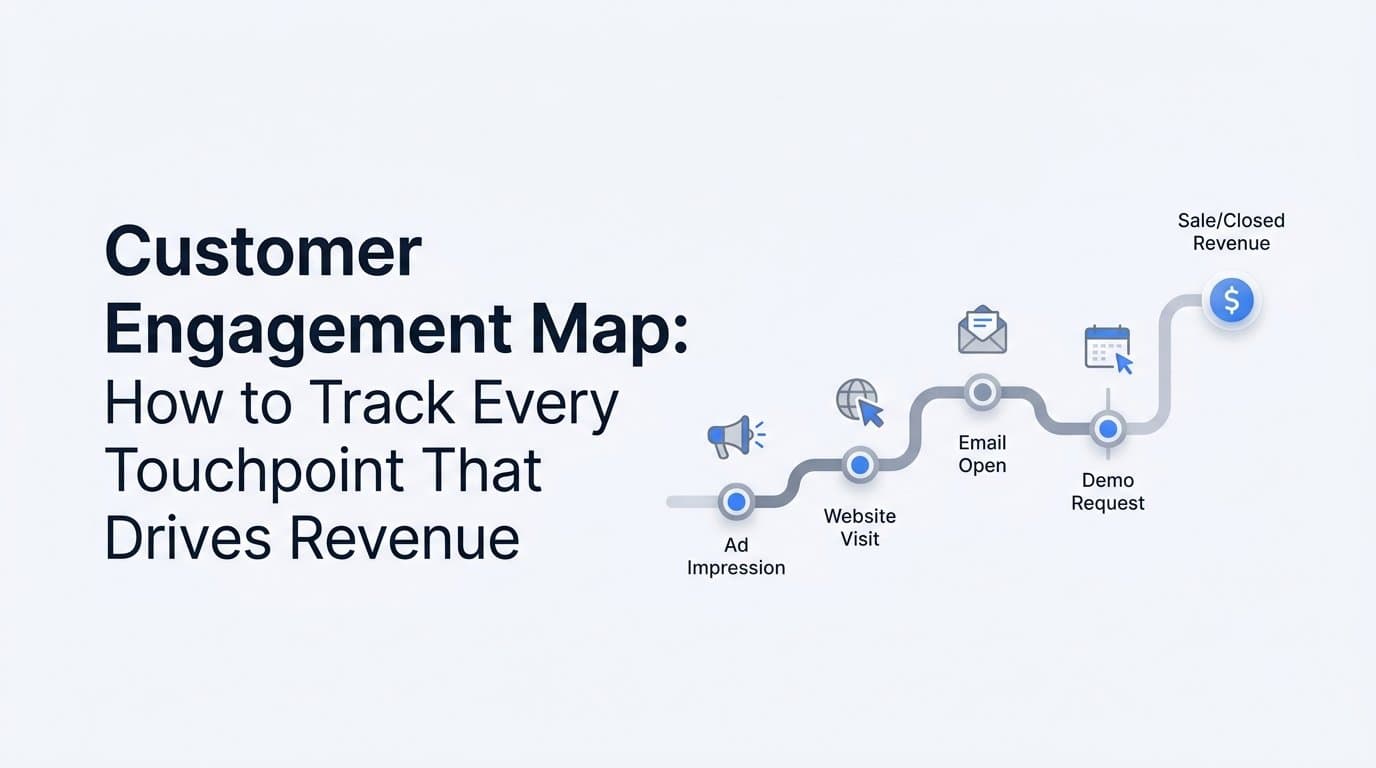
A customer engagement map solves this. It gives you a structured, data-driven view of every interaction a prospect has with your brand, from the first ad impression to the moment a deal closes. Instead of looking at individual channel metrics in isolation, you see the complete picture: which touchpoints matter, in what order, and how they connect to real revenue outcomes.
This guide is for marketing teams and growth leaders who want to move beyond surface-level reporting and build a genuine understanding of what drives conversions. We will cover what a customer engagement map actually is, why B2B SaaS buying behavior makes it essential, how to build one with real data, and how to turn those insights into smarter budget decisions and better campaign performance.
The Anatomy of a Customer Engagement Map
A customer engagement map is a visual and data-driven representation of every interaction a prospect has with your brand across channels and time. It spans the entire buying journey, from the first ad click or organic search visit through to a closed-won deal, and it ties each touchpoint to measurable conversion events.
This is meaningfully different from a traditional customer journey map. Journey maps are primarily a UX and experience design tool. They focus on emotions, pain points, and the subjective experience of moving through a process. They are useful for product teams and customer success, but they are not built around attribution data or conversion outcomes.
A customer engagement map is built for marketers and revenue teams. Its purpose is not to describe how a buyer feels at each stage. Its purpose is to show which interactions actually happened, when they happened, and which ones correlated with pipeline creation and closed revenue.
The core components of an engagement map include several interconnected elements. Understanding each one helps you build a map that is genuinely useful rather than just visually organized.
Touchpoints: These are the individual interactions between a prospect and your brand. A touchpoint can be an ad impression, an ad click, a website visit, a content download, an email open, a demo request, a sales call, or any CRM-recorded event. Each touchpoint is a data point that can be tracked and attributed to a specific channel or campaign.
Channels: Channels are the mediums through which touchpoints occur. Paid search, paid social, organic content, email, direct traffic, and sales outreach are all distinct channels. Your engagement map should capture touchpoints across all of them, not just the ones your ad platforms report on.
Engagement signals: Not all touchpoints carry equal weight. An engagement signal is a behavioral indicator that a prospect is moving closer to a decision. Signals include time spent on a pricing page, repeated visits to your product documentation, or a reply to a sales email. These signals add depth to the map and help distinguish passive exposure from active intent.
Time intervals: The spacing between touchpoints matters. A prospect who visits your website three times in a week is behaving differently from one who visits three times over three months. Mapping time intervals between interactions reveals buying velocity and helps identify where prospects stall or accelerate.
Conversion events: These are the anchors of your engagement map. Conversion events include form submissions, demo bookings, pipeline entries, and closed-won deals. Every touchpoint on the map should ultimately be understood in relation to these outcomes. Without conversion events, an engagement map is just a list of activity. With them, it becomes a revenue intelligence tool.
Why B2B SaaS Buyers Demand a More Complex Map
B2B SaaS purchases are not simple transactions. A typical buying process involves multiple stakeholders, each researching independently and forming their own opinions before the group converges on a decision. You might be tracking one contact in your CRM while three other people at the same company are reading your blog posts, watching your demo videos, and comparing you against competitors.
The buying cycle is also extended. Depending on the deal size and complexity, the time from first awareness to closed-won can span weeks or months. During that time, a single prospect might interact with your brand through paid ads, organic content, email nurture sequences, webinar attendance, and multiple sales calls. Each of those interactions contributes something to the decision, but they do not contribute equally.
This is where single-touch attribution models fundamentally fail. First-touch attribution gives all the credit to the first interaction, which is usually a top-of-funnel paid ad or organic search visit. Last-touch attribution gives all the credit to whatever happened immediately before the conversion, which is often a sales call or a direct visit to your pricing page. Both models tell a partial story, and both will lead you to make incorrect budget decisions.
Consider what happens when you rely on last-touch attribution. You see that demo requests are heavily attributed to direct traffic and sales outreach. You conclude that paid social is not performing. You cut your LinkedIn budget. What you cannot see is that a significant portion of the accounts that booked demos had previously engaged with your LinkedIn content multiple times before ever visiting your site directly. The paid social channel was warming those prospects and moving them through the consideration phase. It just did not get the last click.
The consequence of these mapping gaps is real. Budget gets pulled from channels that appear inactive but are actually critical mid-funnel influencers. High-performing awareness and consideration touchpoints go unrecognized and underfunded because the credit flows elsewhere. Over time, the top of your funnel weakens, pipeline slows, and the root cause is invisible in your reporting.
A customer engagement map built on multi-touch data exposes these dynamics. It shows you the full sequence of interactions that precede a conversion, not just the first or last one. For B2B SaaS teams managing complex, multi-stakeholder buying processes, this level of visibility is not optional. It is the foundation of any reliable marketing strategy.
Building Your Engagement Map: Data Sources and Touchpoint Categories
A customer engagement map is only as accurate as the data feeding it. Before you can map touchpoints, you need to connect the right data sources and understand which types of interactions belong at each stage of the funnel.
The primary data sources for a complete engagement map include your ad platforms, your CRM, your website analytics, form submission data, and offline conversion signals from your sales process. Each source captures a different layer of the buyer journey, and none of them alone gives you the full picture.
Ad platform data: Meta and Google Ads provide impression and click data for your paid campaigns. This is your primary source of awareness-level touchpoint data. The challenge is that ad platforms report within their own ecosystems, making it difficult to connect ad interactions to downstream CRM events without a dedicated attribution layer.
CRM events: Your CRM holds the record of every meaningful sales interaction: demo bookings, opportunity creation, pipeline stage progressions, and closed-won data. These are the conversion events that anchor your engagement map to revenue. Without CRM integration, your map stops at lead generation and never connects to actual business outcomes.
Website behavior: Page visits, session depth, time on site, and return visit frequency all provide engagement signals that enrich your map. A prospect who visits your pricing page four times before booking a demo is telling you something important about their buying intent.
Form submissions and content downloads: These are explicit engagement signals that indicate a prospect has moved from passive consumption to active consideration. They are also valuable first-party data collection events that help you identify and track individuals across sessions.
When organizing touchpoints by funnel stage, it helps to think in three broad categories. Awareness touchpoints include paid ads, organic search visits, social content engagement, and display impressions. These are the interactions that introduce prospects to your brand and generate initial interest. Consideration touchpoints include demo requests, email sequence opens and clicks, webinar registrations, and repeated website visits to product or solution pages. These signal active evaluation. Decision touchpoints include sales calls, proposal reviews, pricing page visits, and direct outreach responses. These occur when a prospect is close to making a choice.
One of the most important technical decisions in building your engagement map is how you capture these touchpoints. Browser-based pixel tracking has become increasingly unreliable as privacy restrictions tighten and ad blockers become more common. A significant portion of real interactions simply do not register in pixel-based systems, creating gaps in your map that distort attribution.
Server-side tracking and Conversion APIs, such as Meta CAPI and Google Enhanced Conversions, address this problem by sending event data directly from your server to the ad platform rather than relying on a browser pixel to fire. This approach captures touchpoints that pixel tracking misses and ensures the data feeding your engagement map is as complete and accurate as possible. First-party data collected through your own forms and CRM further strengthens the map by grounding it in interactions you own and control.
Attribution Models and How They Shape Your Engagement Map
The attribution model you choose does not just affect how credit is distributed. It determines which touchpoints appear prominent on your engagement map and which ones become invisible. Understanding how different models work, and when to use each one, is essential for building a map that reflects reality.
First-touch attribution assigns all credit to the first interaction a prospect had with your brand. It is useful for understanding which channels are most effective at generating initial awareness and bringing new prospects into your funnel. However, it tells you nothing about what happened between that first touch and the conversion.
Last-touch attribution assigns all credit to the final interaction before a conversion event. It is simple to implement and easy to explain, but it systematically undervalues every touchpoint that occurred before the last one. In a long B2B SaaS buying cycle, this can mean ignoring the majority of the interactions that actually built the relationship and moved the prospect toward a decision.
Linear attribution distributes credit equally across all touchpoints in the journey. It is more honest than single-touch models in that it acknowledges every interaction, but it treats a brief ad impression the same as a 45-minute product demo. Equal weighting is not the same as accurate weighting.
Time-decay attribution gives progressively more credit to touchpoints that occurred closer to the conversion event. This reflects the intuition that a sales call the day before a deal closes was more directly influential than an ad click six weeks earlier. It is a reasonable model for short sales cycles but can undervalue important early-stage touchpoints in longer B2B buying processes.
Data-driven attribution uses algorithmic analysis to assign credit based on actual conversion patterns in your data. Rather than applying a fixed rule, it learns which touchpoints and sequences are most predictive of conversion and weights them accordingly. This model requires sufficient conversion volume to produce reliable results, but when that threshold is met, it provides the most accurate picture of channel contribution.
Here is where it gets interesting: the most powerful use of attribution models is not picking one and committing to it. It is comparing models side by side. When a channel receives meaningful credit across multiple attribution models, that is a strong signal of genuine influence rather than attribution model bias. If a channel only looks valuable under last-touch but disappears under linear or data-driven models, that is worth investigating before increasing budget.
Multi-touch attribution is what makes mid-funnel touchpoints visible on your engagement map. Without it, the channels doing the critical work of nurturing and educating prospects during the consideration phase remain undervalued, and your budget allocation reflects a distorted view of what is actually driving pipeline.
Turning Your Engagement Map Into Actionable Marketing Decisions
A customer engagement map that lives in a dashboard but never influences a budget decision or campaign change is not doing its job. The real value of the map is in the decisions it enables. Here is how to extract those decisions systematically.
Start by identifying high-value touchpoint sequences. Rather than looking at individual channels in isolation, look at the combinations of interactions that most consistently precede pipeline creation and closed revenue. Which sequence of touchpoints appears most often in the journeys of accounts that actually close? Is it paid search followed by organic content followed by a demo request? Is it LinkedIn engagement followed by email nurture followed by a sales call? These patterns tell you which channel combinations work together, not just which channels work independently.
Once you identify those sequences, you can make more precise budget allocation decisions. If a particular awareness channel consistently appears in the early stages of winning journeys, that is a signal to protect and potentially increase that budget, even if the channel does not generate direct conversions that show up in last-touch reporting. You are funding the beginning of a sequence that reliably ends in revenue.
Your engagement map also reveals where prospects drop out. If you see a high volume of touchpoints at the awareness and consideration stages but a sharp drop-off before decision-stage interactions, that is a signal that something in your mid-funnel is not working. It might be a gap in your email nurture sequence, a lack of content that addresses late-stage objections, or a disconnect between marketing-qualified leads and sales follow-up timing.
AI-driven analysis adds another layer of capability here. Manually reviewing the touchpoint paths of hundreds or thousands of prospects to find patterns is not realistic. AI can surface these patterns at scale, identifying which ad creatives appear most frequently in the journeys of high-value accounts, which content pieces are most common in paths that end in closed-won deals, and which channel sequences have the highest correlation with large-contract customers.
This kind of analysis moves your engagement map from a descriptive tool to a predictive one. Instead of just understanding what happened in past conversions, you can use those patterns to identify which current prospects are on a high-value trajectory and prioritize resources accordingly. Your marketing becomes more precise, your sales team focuses on the right accounts, and your budget flows toward the activities that actually generate revenue.
Connecting Engagement Data to Pipeline and Revenue
Many marketing teams build engagement maps that stop at lead generation. They track touchpoints up to a form submission or demo request, and then the data trail goes cold. The problem is that lead volume is not the same as revenue. A channel that generates many leads but few closed deals is not performing well, even if it looks impressive in a top-of-funnel report.
Closing the loop between engagement touchpoints and actual revenue requires integrating ad data with CRM pipeline stages and closed-won data. This means your engagement map needs to extend beyond the marketing handoff and follow prospects through the sales process until a deal either closes or is lost.
Pipeline attribution is the layer that makes this possible. Instead of asking which channel drove the most leads, you ask which channel drove the most pipeline value and which touchpoint sequences are most predictive of closed-won revenue. This reframes the entire conversation about marketing performance. You are no longer defending lead volume numbers. You are presenting revenue contribution data that finance and leadership teams can directly connect to business outcomes.
This shift also changes how you evaluate channel performance. A channel that generates fewer leads but contributes to a higher proportion of closed deals is more valuable than a channel that floods your CRM with low-quality leads that rarely progress. Pipeline attribution makes this visible in a way that top-of-funnel metrics never can.
There is another dimension to closing the loop that directly improves your future campaign performance. When you feed enriched, conversion-ready event data back to ad platforms through server-side tracking, you are giving those platforms better signals to optimize against. Instead of training Meta or Google's AI on lead form submissions, you can train it on pipeline entries or closed-won events. The result is that the platform's targeting and bidding algorithms learn to find prospects who look like your actual customers, not just people who fill out forms.
This is one of the highest-leverage actions a B2B SaaS marketing team can take. Better conversion signals lead to better ad platform AI performance, which leads to lower cost per acquisition and higher quality pipeline over time. It is a compounding benefit that starts with the decision to connect your engagement data all the way to revenue.
Platforms like Cometly are built specifically for this kind of end-to-end attribution. By connecting your ad platforms, CRM data, and website behavior into a single real-time view, Cometly gives you the complete engagement map that individual tools cannot provide on their own. From first ad click to closed-won revenue, every touchpoint is captured, attributed, and connected to the outcomes that matter.
Putting It All Together
A customer engagement map is only as powerful as the data feeding it. The framework itself is straightforward: capture every touchpoint, connect them to conversion events, apply the right attribution model, and use the resulting picture to make smarter decisions. The challenge is building the data infrastructure that makes that possible.
For B2B SaaS marketing teams, this means moving beyond ad platform dashboards and disconnected CRM reports. It means implementing server-side tracking to capture touchpoints that pixels miss, integrating CRM pipeline data to connect engagement to revenue, and using multi-touch attribution to surface the mid-funnel channels that single-touch models make invisible.
When you do this well, your engagement map becomes one of the most valuable tools in your marketing operation. You stop guessing which channels matter and start knowing. You allocate budget based on which touchpoint sequences actually drive closed revenue, not which ones generate the most clicks or form fills. You give your sales team better-qualified prospects and give your ad platforms better signals to optimize against.
Cometly makes this possible by connecting your ad platforms, CRM, and website behavior into a single, real-time attribution view. It captures every touchpoint from first impression to closed deal, surfaces AI-driven insights about which campaigns and creatives are driving revenue, and sends enriched conversion data back to Meta and Google to improve targeting and reduce cost per acquisition.
If you are ready to stop working with fragmented data and start seeing the complete picture of what drives your pipeline, Get your free demo and discover how Cometly can map your customer engagement data from first click to closed revenue.



