

You pour budget into paid ads, optimize landing pages, and build out nurture sequences. But somewhere between that first ad click and a closed deal, prospects disappear. You're not sure where they dropped off, which touchpoints actually moved them forward, or what experience they had along the way. Sound familiar?
This is the central challenge for most B2B SaaS marketing teams. The investment in customer acquisition is substantial, but visibility into what actually happens across the full journey is limited. Marketers often see the top of the funnel clearly and the bottom dimly, with a significant blind spot in between.
Understanding the customer experience through the lens of the customer journey is not just a UX exercise. It is a revenue-critical discipline. When you can see which touchpoints shaped a prospect's perception, which stages caused friction, and which sequences led to closed deals, you stop guessing and start making decisions that compound over time.
This article will walk you through how to map the B2B SaaS customer journey stage by stage, identify where experience breaks down, and use attribution data to connect every touchpoint to measurable outcomes. By the end, you'll have a clear framework for turning journey data into revenue impact.
Two Concepts, One Revenue Problem
Customer journey and customer experience are often used interchangeably, but they describe fundamentally different things. Confusing them leads to strategies that optimize the wrong elements at the wrong stages.
The customer journey is structural. It refers to the sequence of touchpoints a prospect moves through from first awareness of your product to purchase and beyond. Think of it as the map: the roads, the intersections, the destinations. It answers the question, "What happened and in what order?"
Customer experience is perceptual. It refers to the quality and emotional resonance of each interaction at those touchpoints. Think of it as how the journey felt to the person traveling it. Did the ad speak to their actual problem? Did the follow-up email feel relevant or generic? Did the demo answer their specific questions? It answers the question, "How did this feel, and did it build trust?"
Here is where the confusion causes real damage. If you optimize customer experience without first mapping the journey, you risk improving the wrong stages. You might invest in perfecting your onboarding flow when the actual drop-off is happening at the demo request stage. If you map the journey without measuring experience, you know the structure but not why prospects disengage. You can see that people leave at a certain stage but cannot explain what pushed them away.
For B2B SaaS specifically, this distinction carries extra weight. Unlike B2C purchases, which can happen in minutes, B2B SaaS buying journeys typically span weeks or months. Multiple stakeholders are involved. A champion might discover your product through a LinkedIn ad, share it with a technical evaluator, loop in a finance lead for pricing review, and then require executive sign-off before closing. Each of those people has a different experience at different touchpoints, and each interaction either builds or erodes confidence in your product.
The journey spans paid ads, organic search, email nurture, comparison pages, demo calls, free trials, and onboarding sequences. No single channel tells the full story. And because the journey is so distributed, the experience gaps that cause drop-off are often invisible to any one team member looking at a single channel's metrics.
The marketers who win are those who hold both concepts simultaneously: the structural map of the journey and the qualitative signal of experience at each stage. The rest of this article is about how to do exactly that.
Mapping the B2B SaaS Customer Journey Stage by Stage
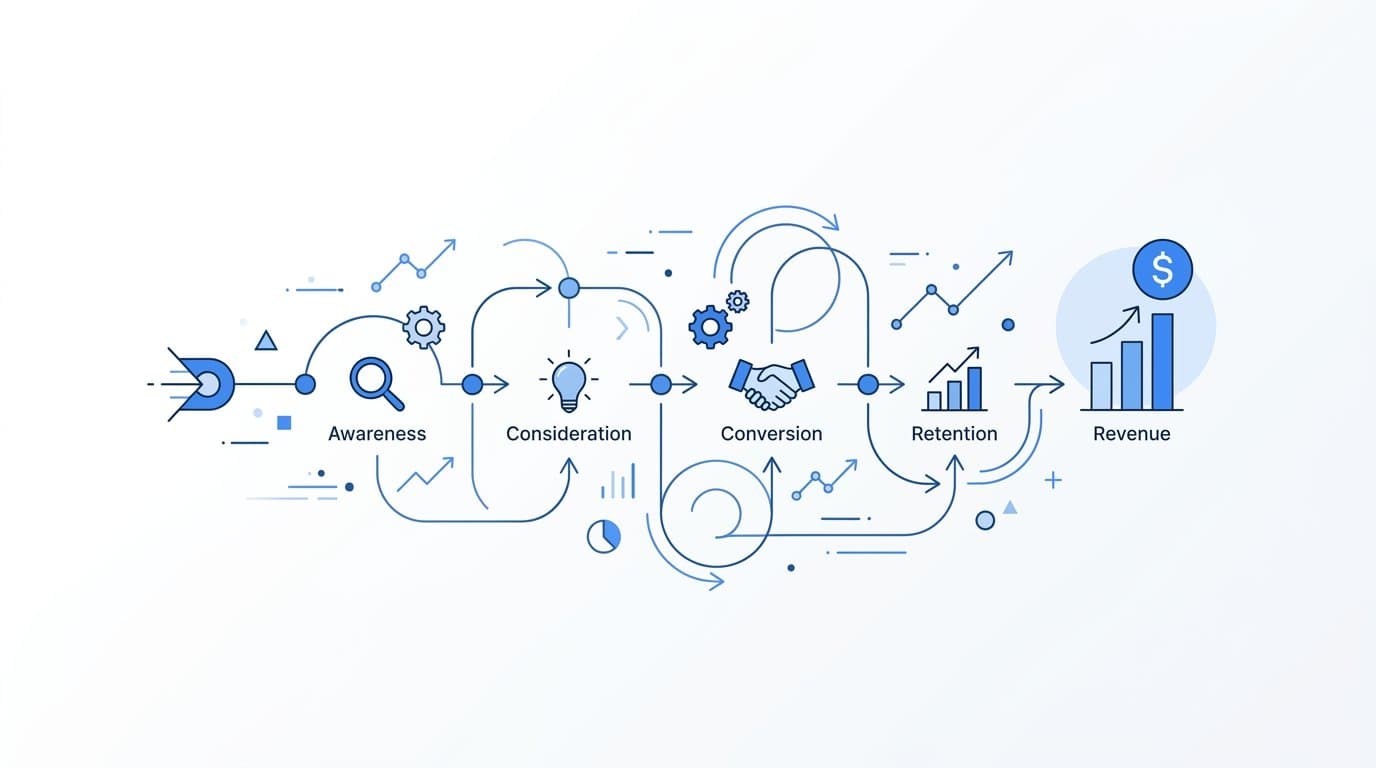
Before you can optimize the customer experience customer journey, you need a clear picture of what the journey actually looks like for your buyers. In B2B SaaS, the journey typically moves through four core stages, each with distinct experience expectations and distinct marketing signals to measure.
Awareness: This is where the journey begins. A prospect encounters your brand for the first time through a paid ad, an organic search result, a social post, or a mention in an industry newsletter. At this stage, the customer experience expectation is simple: relevance. Does this feel like it was made for me and my problem? The marketing signal to measure here is reach and engagement quality, not just volume. Which channels are generating first touches that eventually convert further down the funnel?
Consideration: The prospect is now actively evaluating options. They request a demo, consume your content, visit your pricing page, or compare you against competitors on review sites. The experience expectation shifts to credibility and clarity. Can I trust this company? Does their product actually solve my specific problem? The marketing signals here include demo request rates, content engagement depth, and time spent on comparison or solution pages.
Decision: This is the high-stakes stage. Sales calls happen, trials are activated, pricing is reviewed, and internal stakeholders are consulted. The experience expectation is confidence and momentum. Does every interaction reinforce that this is the right choice? Friction at this stage, whether it is a slow response time, a confusing pricing structure, or a misaligned sales pitch, can undo weeks of positive experience built in earlier stages.
Retention: The deal is closed, but the journey continues. Onboarding, product adoption, and renewal conversations are all part of the customer journey and all carry experience implications that affect lifetime value and expansion revenue. Many B2B SaaS teams treat retention as a customer success function separate from marketing, but the experience during onboarding directly reflects the promises made in the awareness and consideration stages.
What makes this mapping exercise genuinely useful rather than theoretical is multi-touch attribution. Attribution is the mechanism that makes the journey visible in data. It connects the ad click in the awareness stage to the demo request in the consideration stage to the closed-won deal in the decision stage. Without it, each stage looks like a disconnected event rather than part of a continuous sequence.
Multi-touch attribution assigns credit to each touchpoint in the journey based on its contribution to the final conversion. This means you can see not just that a prospect converted, but which combination of channels, messages, and interactions moved them through each stage. That visibility is what transforms a journey map from a whiteboard exercise into an actionable optimization tool.
When you layer this data across hundreds or thousands of customer journeys, patterns emerge. You start to see which awareness channels produce prospects who actually reach the decision stage. You identify which content types accelerate movement through consideration. You discover which sales touchpoints correlate with faster close rates. The journey map becomes a revenue map.
Where the Experience Breaks Down
Knowing the stages of the journey is one thing. Knowing where the experience falls apart within those stages is where real optimization begins. In B2B SaaS, the most common experience gaps tend to cluster around three recurring failure points.
Message mismatch between ad and landing page: A prospect clicks an ad that speaks directly to their pain point, only to land on a generic page that makes no reference to the specific problem the ad addressed. The experience breaks immediately. The continuity of message is severed, and the prospect's trust erodes. This is one of the most common and most costly experience gaps in B2B SaaS, and it is almost entirely preventable with proper tracking and creative alignment.
Slow or impersonal follow-up after lead capture: A prospect fills out a demo request form and waits hours for a response. Or they receive an automated email that addresses them as "Hi there" with no reference to how they found the company or what they expressed interest in. The experience expectation at this stage is immediacy and relevance. Generic follow-up signals that the company does not know who they are or what they need, which undermines the credibility built in earlier touchpoints.
Disconnected handoffs between marketing and sales: Marketing captures a lead, records their source and behavior, and passes a name and email to the sales team. The sales rep has no context about which ads the prospect engaged with, which content they consumed, or what stage of evaluation they are in. The prospect then has to re-explain their situation from scratch, which creates friction and signals internal disorganization.
What makes these gaps particularly damaging is that they are often invisible to the teams responsible for fixing them. Marketing teams typically measure top-of-funnel metrics: impressions, clicks, leads. Sales teams measure bottom-of-funnel metrics: pipeline, close rates, revenue. The middle of the funnel, where most of these experience gaps live, falls into a data blind spot that neither team owns.
Touchpoint analysis is the diagnostic tool that surfaces these gaps. When conversion tracking is implemented across the full funnel, not just at the point of lead capture but through every meaningful interaction, marketers can identify exactly where prospects disengage. Which pages have high exit rates after ad clicks? At what point in the nurture sequence do open rates drop? Which stages show the highest drop-off between marketing-qualified and sales-qualified leads?
This kind of analysis transforms journey mapping from a strategic document into a living diagnostic. Instead of theorizing about where the experience breaks down, you can see it in the data. And when you can see it, you can fix it with precision rather than guesswork.
How Attribution Data Reveals the True Customer Experience
Attribution data does more than track conversions. When used correctly, it reveals the shape of the customer experience across the entire journey. Different attribution models act as different lenses, each illuminating a different aspect of what prospects actually went through.
First-touch attribution shows you what created initial awareness. It tells you which channel or ad was responsible for introducing a prospect to your brand. This is valuable for understanding which top-of-funnel investments are seeding the pipeline, but it tells you nothing about what sustained the prospect's interest through consideration and into the decision stage.
Last-click attribution shows you what closed the deal. It identifies the final touchpoint before conversion and assigns full credit there. This is useful for understanding what drove the final action, but it systematically undervalues every earlier touchpoint that built the relationship and moved the prospect toward that final click.
Linear attribution distributes credit equally across all touchpoints in the journey. This gives you a more complete picture of the full experience, but it treats every interaction as equally important, which rarely reflects reality.
Data-driven attribution uses algorithmic weighting to assign credit based on actual conversion patterns across your historical data. It identifies which touchpoints, in which combinations and sequences, are most predictive of conversion. This is the most sophisticated model and the most accurate reflection of how the customer experience customer journey actually unfolds for your specific audience.
Sophisticated marketing teams do not rely on any single model. They compare multiple models to understand different dimensions of the journey. First-touch tells them where to invest for awareness. Last-click tells them what to protect in the decision stage. Data-driven models tell them which full sequences to replicate and scale.
But all of this analysis depends on data accuracy. This is where server-side tracking becomes foundational. Browser-based pixel tracking has become increasingly unreliable due to ad blockers, browser privacy restrictions, and iOS privacy changes. When pixels fail to fire, touchpoints disappear from the journey record. The map becomes incomplete, and the experience story becomes distorted.
Server-side tracking via Conversion APIs, such as Meta's Conversion API and Google's Enhanced Conversions, sends event data directly from your server to ad platforms, bypassing browser-level restrictions entirely. This ensures that touchpoint data is complete and accurate, which in turn produces a more reliable picture of the customer journey.
When attribution data is accurate and complete, the connection between experience and outcome becomes clear. You can see which channels and messages drove the highest-quality leads through the full journey, not just to the top of the funnel. You can identify which sequences produced the shortest sales cycles or the highest average contract values. And you can use that knowledge to replicate and scale the experiences that actually work.
Turning Journey Data Into Revenue Decisions
Mapping the journey and measuring the experience is valuable. But the ultimate goal is to use that data to make decisions that improve revenue outcomes. This is where pipeline and revenue attribution become the connective tissue between marketing activity and business results.
Pipeline attribution connects specific marketing touchpoints to deals in the sales pipeline. Revenue attribution goes further, connecting those touchpoints to closed-won deals and actual revenue. For B2B SaaS teams, this is the most meaningful measure of marketing effectiveness. It moves the conversation from "how many leads did we generate" to "which marketing investments actually produced revenue."
When you can see that a specific combination of ad creative, channel, and nurture sequence consistently produces pipeline that closes at a higher rate, you have a data-backed case for investing more in that sequence and less in channels that generate leads but not revenue. This is how marketing teams earn credibility in budget conversations and earn the right to scale their programs.
AI-driven insights accelerate this process significantly. Analyzing patterns across thousands of customer journeys manually is not feasible at scale. AI can identify which ad creatives, channels, and touchpoint sequences produce the best journey outcomes, including higher conversion rates, shorter sales cycles, and higher lifetime value, and surface those patterns in a way that human analysts can act on quickly.
Rather than relying on intuition about which campaigns are working, teams can use AI recommendations to prioritize investments based on actual journey performance data. This shifts the optimization process from reactive to proactive.
The practical framework for continuous journey optimization follows a clear cycle. First, measure every meaningful touchpoint across the full funnel using accurate, server-side tracking. Second, identify experience gaps by analyzing where prospects disengage and which stages show the highest drop-off. Third, test targeted improvements at those specific stages, whether that means tightening message alignment between ads and landing pages, improving follow-up speed and personalization, or creating better handoff documentation between marketing and sales. Fourth, feed enriched conversion data back to ad platforms to improve algorithmic targeting and reach more prospects who match the profile of your best customers.
This cycle compounds over time. Each improvement in journey quality produces better data. Better data feeds smarter targeting. Smarter targeting reaches higher-quality prospects. Higher-quality prospects have better experiences and convert at higher rates. The flywheel builds momentum with each iteration.
From Journey Map to Revenue Impact
The core principle running through everything in this article is straightforward: customer experience and the customer journey are two sides of the same coin. The journey tells you what happened. The experience tells you how it felt. Together, they tell you why prospects converted or why they didn't.
Marketers who see only one side are optimizing with incomplete information. They might improve their ad creative without knowing that the experience breaks down at the follow-up stage. They might invest in onboarding improvements without realizing that the highest drop-off is happening during the consideration stage, before prospects ever become customers.
The goal is not just to draw a journey map. The goal is to use that map to make smarter decisions about where to allocate ad spend, how to sequence touchpoints for maximum impact, and where to invest in experience improvements that will actually move the revenue needle.
This requires a single, connected view of your data. Ad platform data, CRM events, website behavior, and revenue outcomes need to live in the same place, connected across the full customer journey. Without that unified view, every optimization decision is made with partial information.
Cometly is built to provide exactly that view. It connects your ad platforms, CRM, and website to track the entire customer experience customer journey in real time, from the first ad click to closed-won revenue. With multi-touch attribution, server-side tracking, AI-driven insights, and pipeline and revenue attribution all in one platform, Cometly gives marketing teams the data clarity they need to optimize every stage of the journey with confidence.
If your team is making decisions based on an incomplete picture of the customer journey, now is the time to change that. Get your free demo and start capturing every touchpoint to maximize your conversions.



