

Picture this: your marketing team has just launched a new campaign. The creative looks sharp, the targeting feels right, and the clicks are rolling in. But two weeks later, the pipeline is quiet. Leads are trickling into the CRM, a few demos get booked, and then nothing. Deals stall. Prospects go cold. And nobody can quite explain why.
This is one of the most frustrating experiences in B2B SaaS marketing, and it happens more often than most teams want to admit. The problem is rarely the ad itself. More often, the culprit is invisible friction hiding somewhere along the customer journey, quietly pushing prospects away before they ever reach a buying decision.
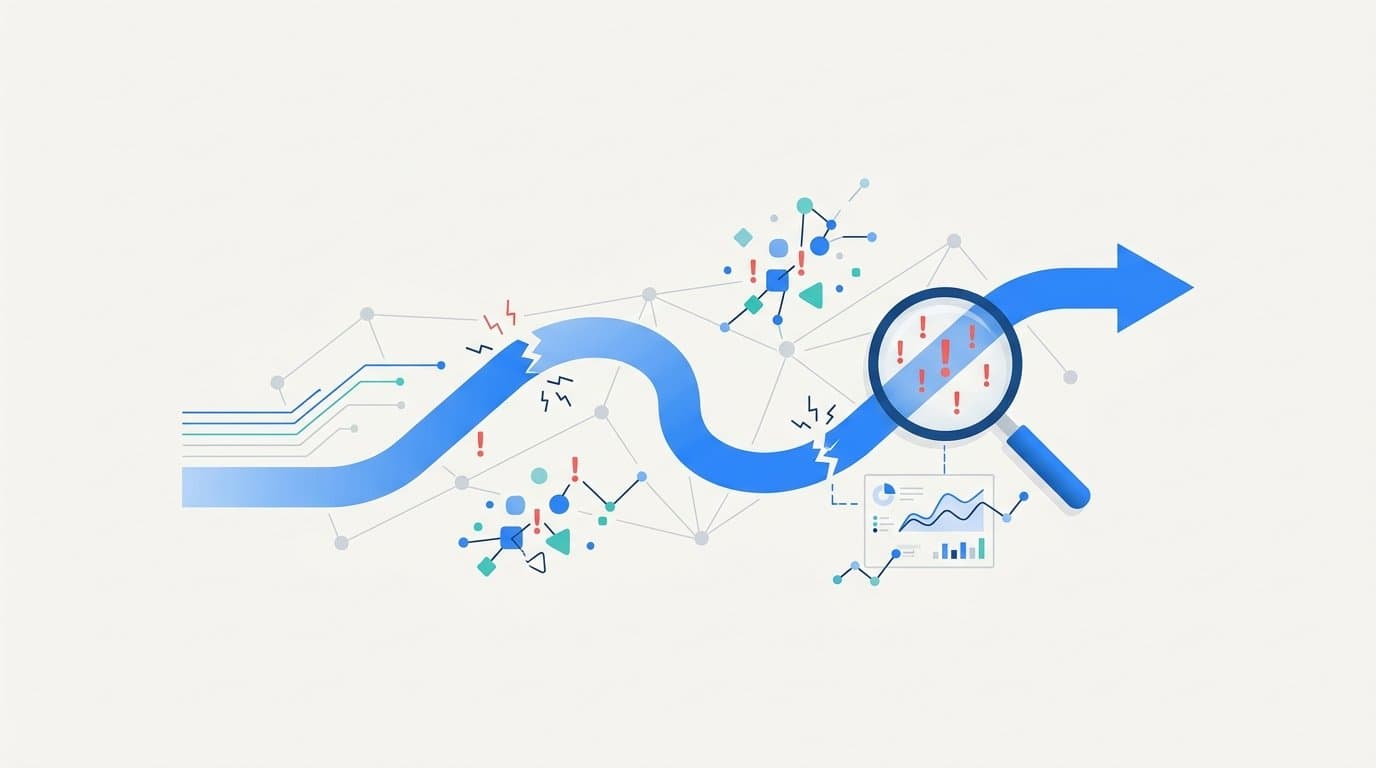
Customer journey pain points are the specific moments where a prospect hits a wall. Maybe the messaging does not match their actual problem. Maybe there is a lag between their first click and any meaningful follow-up. Maybe they cannot figure out how your pricing works. Each of these moments chips away at intent, and in a long B2B sales cycle, that erosion adds up fast.
For B2B SaaS marketers who are accountable for connecting ad spend to revenue, understanding these pain points is not optional. It is the difference between scaling what works and burning budget on what looks like it works. This article will walk you through what customer journey pain points are, where they tend to hide across the funnel, why most teams miss them, and how to use attribution data to surface and solve them before they cost you pipeline.
The Hidden Friction Slowing Your Pipeline
A customer journey pain point is any specific moment where a prospect experiences confusion, delay, or frustration that reduces their likelihood of moving forward. It is not always dramatic. Sometimes it is a landing page that does not match the ad copy. Sometimes it is a sales follow-up that arrives three days too late. Sometimes it is a pricing page that raises more questions than it answers. Small friction points compound quickly in long sales cycles.
It helps to think about pain points in three broad categories based on where they occur in the funnel.
Awareness-stage friction happens when the wrong audience is seeing your message. Your ad might be well-crafted, but if it is reaching people who do not fit your ideal customer profile, you will generate clicks that never convert. Irrelevant messaging is another culprit here. If your ad speaks to a pain your audience does not actually feel, engagement will be shallow and lead quality will suffer.
Consideration-stage friction tends to show up as an unclear value proposition or slow follow-up. A prospect who clicks your ad and lands on a page that does not immediately communicate why your product is the right fit for their specific situation will bounce. And if they do fill out a form, a delayed response from sales can kill momentum that took multiple touchpoints to build.
Decision-stage friction is where deals go to stall. Pricing confusion, lack of customer proof, unclear implementation timelines, or too many stakeholders without enough information can all create hesitation at the final stage. By this point, you have invested significant time and budget to get a prospect here, so friction at this stage is particularly costly.
B2B SaaS journeys are uniquely vulnerable to all three categories because of their structural complexity. Unlike a direct-to-consumer purchase that might happen in a single session, a B2B SaaS buying decision often involves multiple stakeholders, weeks or months of evaluation, and touchpoints spread across email, paid ads, organic search, review sites, and direct sales conversations.
This extended timeline means friction does not just stop one deal. It compounds. A prospect who hits a pain point at week two of their evaluation might disengage quietly, and your team may not notice until the pipeline report looks thin at the end of the quarter. By then, the opportunity to course-correct has already passed.
Understanding where these pain points live, and how to detect them before they become pipeline problems, starts with knowing where they typically appear across the funnel.
Where Friction Hides Across the Funnel
Customer journey pain points do not announce themselves. They show up in the data as anomalies, drop-offs, and gaps that are easy to overlook when you are looking at each channel in isolation. Here is where they tend to cluster at each stage of the funnel.
Top-of-funnel: misaligned targeting. The most common top-of-funnel pain point is attracting the wrong audience. When ad targeting is too broad or based on assumptions rather than data, campaigns generate high click volume but low-quality leads. Sales teams spend time chasing prospects who were never a good fit, and marketing looks at CPL metrics without realizing that a low cost per lead means nothing if those leads never convert. The pain point here is not always visible in the ad platform. It shows up later, when you try to connect ad performance to pipeline and revenue.
Middle-of-funnel: broken handoffs. This is where some of the most damaging friction lives, and it is often the least visible. When a prospect clicks an ad and fills out a form, there is a critical moment between that action and their entry into the CRM. If lead data is incomplete, misattributed, or delayed, the handoff between marketing and sales breaks down. Sales follows up without the context of what the prospect engaged with. Marketing cannot tell which campaign drove the lead. The momentum that the prospect had when they clicked the ad dissipates in the gap between systems that do not talk to each other.
Mid-funnel friction also appears as a long time-to-MQL or a high drop-off rate between lead and opportunity. These are signals that something in the nurture sequence, the qualification process, or the sales follow-up is creating resistance. Without visibility into the full journey, it is nearly impossible to pinpoint which part of the process is responsible.
Bottom-of-funnel: attribution blind spots. At the decision stage, the pain point shifts from prospect experience to team knowledge. When a deal closes, most teams cannot accurately identify which touchpoints actually influenced the decision. Was it the LinkedIn ad from six weeks ago? The case study they downloaded? The webinar they attended before requesting a demo? Without multi-touch attribution, the answer defaults to "the last thing we tracked," which is almost never the full story.
This attribution blind spot makes it impossible to replicate success. If you cannot identify what actually drove a closed deal, you cannot confidently invest more in those activities. You end up making budget decisions based on incomplete information, which means the friction points that cost you deals this quarter will likely cost you deals next quarter too.
Why Most Teams Miss These Pain Points Until It Is Too Late
The reason customer journey pain points go undetected for so long is not a lack of data. Most B2B SaaS marketing teams are actually swimming in data. The problem is that the data lives in separate places, and nobody has a complete view of the journey from first touch to closed revenue.
Siloed data is the root cause. Ad platforms report on impressions, clicks, and conversions at the campaign level. CRMs track leads, opportunities, and pipeline stages. Website analytics measure behavior on individual pages. Each of these tools provides a slice of the picture, but without a way to connect them, teams are making decisions based on fragments. A campaign might look successful in the ad platform while generating leads that never convert. A channel might appear underperforming in isolation while actually playing a critical role in multi-touch journeys that close at a high rate.
Last-click attribution distorts the picture. Many teams still rely on last-click attribution as their default model, and this is one of the most persistent sources of blind spots in B2B marketing. Last-click attribution gives all the credit for a conversion to the final touchpoint before the lead was captured. This means every interaction that built awareness, established trust, and moved the prospect through the consideration stage gets zero credit. Over time, teams defund the channels that actually build pipeline because those channels do not show up in the conversion reports. The pain points that live in the middle of the journey become invisible.
Lack of real-time visibility slows response. Even teams that have invested in analytics tools often find themselves looking at data that is days or weeks old. By the time a report surfaces a drop-off in conversion rates or a spike in time-to-MQL, the campaigns responsible have already run for another two weeks. Course correction becomes reactive rather than proactive. You are always fixing last month's problems instead of preventing next month's.
Browser-based tracking limitations have made this worse. Ad blockers, iOS privacy updates, and the gradual deprecation of third-party cookies have reduced the reliability of pixel-based tracking. This means drop-off points and conversion events that would have been captured a few years ago are now going untracked, creating gaps in the journey data that make pain points even harder to detect.
The teams that identify and fix friction fastest are the ones who have solved the data visibility problem first. And that starts with the right attribution infrastructure.
How to Identify Pain Points Using Attribution Data
Finding customer journey pain points is fundamentally a data problem. The good news is that with the right attribution setup, the data you need to surface friction is already being generated. You just need a way to connect it and read it correctly.
Map every touchpoint from first click to closed revenue. The starting point is multi-touch attribution. Unlike last-click models, multi-touch attribution assigns credit to every interaction a prospect had before converting, giving you a realistic view of which channels, campaigns, and content pieces are actually contributing to pipeline. When you map the full journey, drop-off points become visible. You can see where prospects disengage, which stages have the longest delays, and which paths through the funnel lead to closed deals versus dead ends.
Multi-touch models come in several forms. Linear attribution distributes credit equally across all touchpoints. Time-decay attribution gives more credit to interactions closer to the conversion. Data-driven attribution uses historical patterns to weight touchpoints based on their actual influence. Each model reveals different aspects of the journey, and comparing them can surface pain points that a single model would hide.
Use customer journey analytics to compare conversion rates across channels. Once you have multi-touch data, the next step is to analyze conversion rates at each stage by channel and campaign. This comparison reveals which paths through the funnel produce high-quality leads that close at a strong rate, and which paths generate activity without producing revenue. A channel that drives a high volume of leads but shows consistently low conversion rates from lead to opportunity is signaling a pain point, either in targeting, in the post-click experience, or in the handoff to sales.
Customer journey analytics also let you identify patterns across segments. Are enterprise prospects stalling at a different stage than mid-market prospects? Are leads from one ad format converting faster than leads from another? These patterns point directly to where friction is concentrated.
Analyze time-to-convert by channel and campaign. Time-to-convert is one of the most underused signals in B2B marketing analytics. When a particular channel or campaign consistently produces deals that take significantly longer to close than others, that is a friction signal. It suggests that something in the experience those prospects are having, whether it is the content they are seeing, the messaging they are receiving, or the sales process they are going through, is creating resistance.
Spotting these delays early gives you the opportunity to intervene with better content, more relevant messaging, or a more responsive follow-up sequence before the deal goes cold. Without time-to-convert data broken down by channel and campaign, these patterns stay hidden in aggregate pipeline metrics that do not tell you where the problem actually lives.
Turning Pain Point Insights Into Smarter Ad Decisions
Identifying pain points is only half the work. The real value comes when you use those insights to make smarter decisions about where to put your budget and how to optimize your campaigns.
Reallocate budget toward channels that move prospects through the funnel. Once you know which channels and campaigns are generating high-intent traffic that converts at a strong rate, and which ones are producing clicks that go nowhere, the budget decision becomes much clearer. Shifting spend away from low-quality traffic sources and toward channels that consistently produce pipeline is one of the highest-leverage moves a B2B marketing team can make. But it requires full-funnel attribution data to do it with confidence rather than guesswork.
This is where connecting ad spend to revenue data becomes essential. If you can see, at the campaign level, which ads are contributing to closed-won revenue rather than just leads or clicks, you can make budget decisions that are grounded in actual business outcomes.
Send enriched conversion data back to ad platforms. One of the most powerful ways to reduce top-of-funnel friction is to help ad platforms find more of the right audience. This is where server-side tracking and Conversion APIs come in. When you send enriched, conversion-ready event data back to Meta, Google, and other ad platforms, their optimization algorithms have better information to work with. Instead of optimizing toward people who click ads, the platform can optimize toward people who actually become customers.
This approach is particularly valuable in a privacy-first tracking environment where browser-based pixels are capturing less data than they used to. Server-side tracking fills those gaps, giving ad platforms a more complete signal and reducing the targeting misalignment that causes top-of-funnel friction in the first place.
Leverage AI-driven recommendations to surface full-journey performance. Surface-level metrics like impressions and clicks tell you what happened at the top of the funnel. AI-driven analytics can tell you what those interactions actually led to across the entire customer journey. By analyzing patterns across large datasets, AI can identify which combinations of touchpoints most reliably predict conversion, which ad creative tends to appear in the journeys of your best customers, and which campaigns are underperforming relative to their actual potential.
These recommendations give marketing teams a way to act on pain point insights at scale, without having to manually analyze every campaign and channel combination. The result is a faster feedback loop between identifying friction and making the changes that reduce it.
Building a Single Source of Truth for the Customer Journey
All of the strategies above depend on one foundational capability: having a single, unified view of the customer journey that every team in your organization can work from. Without it, the insights from attribution data stay fragmented across tools, and the friction points you identify in one system do not connect to the actions you need to take in another.
A single source of truth connects every layer of your data. In practice, this means one platform that brings together your ad data, website behavior, CRM events, and revenue data into a coherent picture of how prospects move from first awareness to closed deal. When marketing, sales, and leadership are all looking at the same data, conversations about pipeline health and campaign performance become grounded in shared facts rather than competing reports from different tools.
Cometly is built to serve as that unified layer for B2B SaaS teams. It connects your ad platforms, CRM, and website tracking into a single view of every customer journey, with real-time visibility into how each touchpoint is contributing to pipeline and revenue. From ad click to closed-won, every interaction is captured and attributed so you can see exactly where friction is occurring and what to do about it.
Connecting revenue data closes the loop. One of the most important capabilities in a modern attribution setup is the ability to connect your actual revenue data to your ad performance. When you integrate Stripe revenue data with your ad campaigns, you can see which campaigns are generating not just leads or demos, but actual closed revenue. This closes the loop that most marketing teams are missing and eliminates the guesswork from budget decisions. You stop asking "which campaigns are performing?" and start asking "which campaigns are driving revenue?" Those are very different questions, and the answers lead to very different decisions.
Continuous monitoring outperforms one-time audits. Customer journey pain points are not static. They shift as your campaigns evolve, as your audience changes, and as your product and messaging develop. A friction point that did not exist six months ago might be costing you pipeline today. This is why ongoing journey tracking matters more than periodic audits. Teams that monitor their customer journey continuously can catch friction early, when it is still easy to fix, rather than discovering it in a quarterly review when it has already affected months of pipeline.
Putting It All Together
Customer journey pain points are rarely obvious. They do not announce themselves in your dashboard or flag themselves in your weekly report. They hide in the gaps between your data sources, in the stages of the funnel where visibility is lowest, and in the attribution models that credit the wrong touchpoints for your best outcomes.
But here is the core insight: pain points are always measurable when you have the right data infrastructure. When you can map every touchpoint from first ad click to closed revenue, compare conversion rates across channels, analyze time-to-convert at each funnel stage, and send enriched data back to your ad platforms, friction becomes visible. And once it is visible, it becomes fixable.
B2B SaaS marketers who track the full customer journey gain a decisive advantage. They know which channels to scale, which campaigns to cut, and which stages of the funnel need attention before deals stall. They make budget decisions based on revenue outcomes rather than surface-level metrics. And they build the kind of marketing operation that compounds over time, because every insight feeds the next round of optimization.
If you are ready to stop guessing where your pipeline friction is hiding and start seeing every touchpoint that drives revenue, Get your free demo and discover how Cometly connects your ad data, CRM, and revenue into a single source of truth for the customer journey.



