Most B2B SaaS marketing teams accumulate tools the way they accumulate browser tabs: quickly, with good intentions, and without a clear plan for what to close. Over time, you end up with three platforms tracking the same conversions, two tools reporting different numbers for the same campaign, and a budget line that nobody can fully justify.
That is a marketing tool overlap problem, and it is more common than most teams admit.
A marketing tool overlap audit is the process of systematically reviewing every tool in your marketing stack, identifying where functionality duplicates, where data conflicts, and where spend is wasted. The goal is not to strip your stack down to the bare minimum. The goal is to ensure every tool earns its place by doing something no other tool in your stack already does.
For B2B SaaS companies running paid acquisition, the cost of overlap goes beyond the subscription fees. Duplicate tracking creates inflated conversion counts. Conflicting attribution data leads to misallocated budget. And when your ad platforms receive noisy or redundant signals, their optimization algorithms suffer, meaning you pay more to reach less of the right audience.
Here is what makes this problem particularly insidious: each tool in your stack looks justified on its own. Your ad platform pixel tracks conversions. Your attribution software tracks conversions. Your CRM tracks lead sources. Your web analytics platform tracks sessions and goals. All of them are doing their job. The problem is they are all doing each other's jobs too, and none of them are talking to each other in a consistent way.
This guide walks you through a practical, six-step audit process that any marketing team can complete. You will inventory your current stack, map functionality against each tool, surface conflicts in your tracking and attribution data, and build a rationalized stack that gives you a single source of truth. By the end, you will know exactly which tools to keep, which to consolidate, and how to close the gaps that are quietly costing you revenue intelligence.
Step 1: Build a Complete Inventory of Every Marketing Tool You Use
You cannot audit what you cannot see. Before you can identify overlap, you need a complete, honest list of every tool your marketing function touches. This sounds obvious, but most teams underestimate the scope of their own stack by a significant margin.
Start by pulling every active subscription from your finance or accounts payable records. Filter for anything billed to the marketing budget or a marketing team member's corporate card. This gives you the paid tools. But paid tools are only part of the picture.
Next, audit your ad platforms directly. Log into Google Ads, Meta Ads Manager, LinkedIn Campaign Manager, and any other platforms you run. Check which pixels are installed on your site, which conversion events are configured, and which third-party integrations are active. You may find tracking connections you forgot were set up.
Then check your tag management system. If you use Google Tag Manager or a similar platform, review every tag that is currently firing. This is where duplicate pixels and redundant tracking scripts tend to hide. A tag that was installed for a trial two years ago and never removed is still firing on every page load.
Shadow IT is a real and significant source of overlap in B2B SaaS marketing stacks. Individual team members or agency partners often add tools independently without informing marketing ops. Ask every person on your marketing team, including any external agencies, to list every tool they use or have access to. You will likely find tools that never made it onto the official stack list.
For each tool you identify, document the following in a shared spreadsheet:
Tool name and category: Common categories include paid ad management, conversion tracking, attribution and analytics, CRM and pipeline, marketing automation, reporting and dashboards, and session or behavioral analytics.
Owner: The specific person or team responsible for this tool. If nobody can name an owner, that is itself a signal.
Monthly or annual cost: Include all tiers, seats, and add-ons.
Primary use case: What was the stated reason this tool was purchased? Document this as it was originally justified, not how it is currently used.
Data sources it connects to: Which platforms, CRMs, or data warehouses does this tool pull from or push data into?
Notes: Any initial observations about redundancy, confusion, or data quality issues associated with this tool.
Success indicator: You have a single shared document listing every tool, with owner and primary use case filled in for every row. If any row has a blank owner field, that tool is a consolidation candidate by default.
Step 2: Map Functional Capabilities Across Your Stack
Now that you have your inventory, the next step is to look beyond what each tool was purchased to do and document everything it actually does. This distinction matters because most modern marketing tools are multi-functional, and secondary features are one of the primary drivers of overlap.
Your CRM may have built-in lead source tracking. Your ad platform may offer its own attribution reporting. Your marketing automation tool may include a landing page builder with its own conversion tracking. None of these were the primary reason you bought those tools, but they are all actively competing with dedicated tools you are also paying for.
Create a capability matrix. Rows represent each tool in your inventory. Columns represent functional categories across your stack. Useful column categories for a B2B SaaS marketing stack include:
Conversion tracking: Does this tool record conversion events such as form fills, demo requests, or trial signups?
Attribution modeling: Does this tool assign credit to marketing channels or touchpoints for driving a conversion?
Audience segmentation: Does this tool create or manage audience lists for targeting or personalization?
Reporting dashboards: Does this tool surface performance metrics in a visual interface?
Lead scoring: Does this tool assign scores to leads based on behavior or firmographic data?
Ad optimization signals: Does this tool send conversion data back to ad platforms to improve algorithmic targeting?
CRM and pipeline data: Does this tool store or sync contact, opportunity, or deal stage information?
For each cell in the matrix, mark one of three states: primary function, meaning this is the core reason the tool exists in your stack; secondary function actively used, meaning your team uses this capability even though it was not the primary purchase reason; or secondary function available but unused, meaning the tool offers this capability but your team ignores it.
Pay particular attention to the conversion tracking and attribution modeling columns. These are the most common sources of conflict in B2B SaaS stacks. It is not unusual to complete this matrix and find that four or five tools all have marks in the conversion tracking column, with two or three of them marked as primary functions.
That is the overlap. When multiple tools each claim to be your primary conversion tracking source, you will always end up with conflicting numbers, because each one is counting differently, attributing differently, and reporting through a different lens.
This step also frequently reveals consolidation opportunities that have nothing to do with tracking conflicts. You may find that a standalone reporting dashboard is redundant because your attribution platform already surfaces the same metrics. Or that a separate audience segmentation tool is duplicating functionality your CRM already handles.
Success indicator: You have a completed capability matrix that visually shows where two or more tools share the same functional category, particularly in conversion tracking and attribution.
Step 3: Audit Your Conversion Tracking and Attribution Data for Conflicts
This is the step where the real cost of overlap becomes concrete. Instead of looking at tools in the abstract, you are now going to look at what they are actually reporting and compare those numbers directly.
Pull conversion and revenue data from every tool in your stack that tracks it. Use the same date range for all of them, ideally 30 to 90 days of recent data. Then put those numbers side by side in a conflict log.
Look specifically for discrepancies in these areas:
Total conversions reported: If your attribution platform reports 200 demo requests in a given month and your ad platforms collectively report 340, that gap needs an explanation. Either your ad platforms are double-counting, or your attribution platform is missing events.
Revenue attributed per channel: If your attribution software attributes 60 percent of pipeline to paid search and your CRM's source tracking attributes 30 percent to the same channel, you are working with fundamentally different pictures of your business.
Lead counts by source: Compare how many leads each tool attributes to each channel. Discrepancies here often reveal different attribution window settings or different definitions of what counts as a lead.
Cost per acquisition by campaign: If your ad platform reports a CPA of $200 for a specific campaign and your attribution platform reports $450 for the same campaign over the same period, the difference tells you something important about how each tool is counting and attributing.
Several conflict patterns appear repeatedly in B2B SaaS stacks. Google Ads and Meta Ads both claiming credit for the same conversion is common when a user clicked ads on both platforms within their respective default attribution windows. A pixel firing multiple times for the same event is a technical issue that inflates conversion counts at the source. And a CRM showing different lead sources than your attribution platform is almost always a sign that the two tools use different touch models, one might be last-click while the other uses multi-touch.
For each discrepancy you find, document the gap size and write a hypothesis about the cause. Is it duplicate tracking? Mismatched attribution models? A data sync delay? Browser-side signal loss from ad blockers or iOS privacy changes?
A unified attribution platform that connects your ad data, CRM events, and website behavior serves as the most reliable reference point for resolving these conflicts. Rather than each tool reporting its own siloed slice of the customer journey, a platform like Cometly provides a single view of every touchpoint from first ad click through to closed revenue. When you have that unified view, you can identify which tool is over-counting and which is under-counting, rather than simply having two numbers with no way to adjudicate between them.
Success indicator: You have a conflict log with at least three to five specific data discrepancies documented, each with a size of gap and a probable cause identified.
Step 4: Score Each Tool on Unique Value and Replaceability
With your capability matrix and conflict log in hand, you now have enough information to make informed decisions about which tools stay and which get consolidated. This step gives you a structured framework for making those decisions without relying on gut feel or internal politics.
For each tool in your stack, answer three questions:
1. Does it provide data or functionality that no other tool in your stack currently provides?
2. Is the data it generates accurate and trusted by the team members who use it?
3. Would removing it create a gap that another existing tool could fill without additional configuration?
Based on your answers, assign each tool two scores. First, a unique value score of high, medium, or low. Second, a replaceability score of high, medium, or low. A tool with high unique value and low replaceability stays. A tool with low unique value and high replaceability is a consolidation candidate. Everything in between needs a closer look.
Factor in integration depth when scoring replaceability. A tool that connects deeply to your CRM, your ad platforms, and your website is structurally harder to replace than a standalone reporting dashboard that pulls data from a single source. Removing a deeply integrated tool requires you to rebuild those connections elsewhere, which adds time and risk to the consolidation process.
Pay particular attention to the signal quality each tool sends back to your ad platforms. Tools that feed enriched first-party conversion data back to Meta or Google through server-side integrations and Conversion API connections provide compounding value over time. They improve ad platform targeting and optimization on an ongoing basis, which means their value is not just what they show you in a dashboard but what they enable your ad platforms to do with better data. A tool with this capability scores high on unique value even if its reporting interface looks similar to another tool you own.
Involve the team members who use each tool daily before finalizing your scores. A tool that looks redundant on paper may be the primary workflow interface for a key team member, and removing it without a transition plan creates productivity disruption that offsets any cost savings. Conversely, a tool that looks essential based on its feature list may be something nobody on the team actually opens.
Document the written justification for every score. This creates accountability and gives you a record to reference when team members push back on consolidation decisions.
Success indicator: Every tool in your inventory has a unique value score, a replaceability score, and a written justification for both.
Step 5: Design Your Rationalized Stack Around a Single Source of Truth
You now have all the information you need to design a better stack. This step is about making deliberate architectural decisions rather than just cutting tools that look redundant.
Using your scores from Step 4, group every tool into one of three buckets: keep as primary, keep as secondary with a clearly defined and limited scope, or deprecate and consolidate.
The most consequential decision in this step is choosing which platform serves as your single source of truth for attribution and revenue data. This is the platform that every other tool either reports into or gets validated against. It is the reference point you use when numbers conflict. It is the data layer that your team trusts when making budget decisions.
Your single source of truth for attribution needs to connect your ad platforms, your CRM, and your website tracking into one unified view of the customer journey. It needs to see the full path from first ad click through every subsequent touchpoint to closed revenue. Without that end-to-end view, you are always working with partial information, and partial information leads to partial decisions.
Cometly is built specifically for this role. It connects ad platforms, CRM data, and website behavior into a single customer journey view with real-time insights, supports multi-touch attribution and server-side conversion tracking, and sends enriched conversion signals back to ad platforms through Conversion API integrations. This means it does not just improve your internal reporting. It actively improves the quality of data your ad platforms use to optimize targeting and delivery.
Once you have chosen your attribution foundation, define clear data ownership rules for every metric type. Your attribution platform owns channel-level revenue attribution. Your CRM owns pipeline stage and deal data. Your ad platforms own impression and click data. Document these rules explicitly so there is no ambiguity about where to go when a number is questioned.
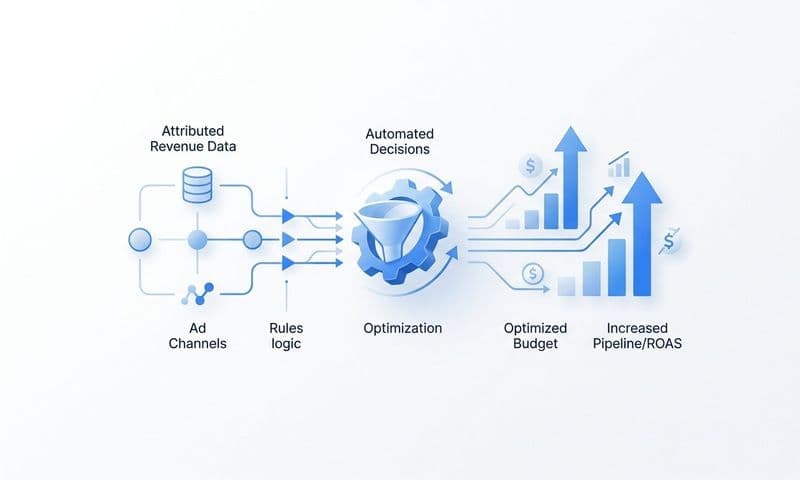
Then map the intended data flow. An ad click fires a server-side event. That event is enriched with CRM data to add firmographic context. The enriched event is sent back to your ad platforms as a high-quality conversion signal. All of this data flows into your attribution dashboard where your team can see the complete picture and make decisions.
Plan your consolidation sequence carefully. Do not deprecate a tracking tool until its replacement has been verified to capture the same events with equivalent accuracy. Sequence matters: remove low-risk standalone tools first and leave tracking infrastructure changes for last.
Success indicator: You have a written stack architecture document that shows which tool owns each function, which platform is your single source of truth, and how data flows between every remaining tool.
Step 6: Execute the Consolidation and Validate Data Integrity
Planning a rationalized stack and actually operating one are two different things. This step is about executing the consolidation carefully, in the right order, with validation at every stage.
Start with the lowest-risk removals. Standalone reporting dashboards that pull from a single data source are the safest place to begin. Removing them does not affect tracking, does not change what data gets collected, and does not alter the signals your ad platforms receive. If the reporting those tools provided is now covered by your attribution platform, the removal is straightforward.
For each tool you plan to remove, run a parallel period of at least two weeks where both the tool being deprecated and its replacement are active simultaneously. During this period, compare their outputs daily. If the replacement is capturing equivalent data, the numbers should converge within an acceptable variance range. If they diverge significantly, you have a gap in your replacement setup that needs to be resolved before you proceed.
After each removal, return to your conflict log from Step 3. Check whether the specific discrepancy that tool was causing has been resolved. If Google Ads was double-counting conversions because a browser-side pixel and a server-side event were both firing without deduplication, removing the redundant pixel should bring those numbers into alignment. Verify that it did.
Test your conversion tracking end to end after each major change. Run a controlled event through your stack, such as a test form submission or a simulated demo request, and verify that it appears correctly in your attribution platform, syncs to your CRM with the right source data, and is sent back to your ad platforms as an enriched, deduplicated conversion signal. Do not assume the plumbing is working. Confirm it.
Update your capability matrix from Step 2 after each tool removal to reflect the current state of your stack. This keeps the document accurate and turns it into a living reference rather than a one-time audit artifact.
Finally, set a recurring audit cadence. For fast-growing teams that are frequently adding new tools, quarterly reviews are appropriate. For more stable stacks, semi-annual reviews are sufficient. New tools get added continuously, and without a scheduled review process, overlap creeps back in within months.
Success indicator: Conversion counts across your remaining tools are within an acceptable variance range. Your attribution data tells a consistent story across channels. Your ad platforms are receiving clean, deduplicated conversion signals that improve their optimization over time.
Your Post-Audit Marketing Stack Checklist
Use this checklist as a repeatable reference for every future audit your team runs.
Inventory complete: Every tool is documented with owner, cost, primary use case, and data connections.
Capability matrix built: Every tool is mapped against every functional category, with primary and secondary functions identified.
Conflict log created: Conversion and attribution discrepancies are documented with gap sizes and probable causes.
Tools scored: Every tool has a unique value score and a replaceability score with written justification.
Stack architecture defined: A single source of truth is designated, data ownership rules are documented, and the intended data flow is mapped.
Consolidation validated: Parallel tracking periods confirmed replacement accuracy before each tool was deprecated.
The goal of this audit is not minimalism. It is clarity. Every tool in your rationalized stack should have a defined role, a defined owner, and a defined place in your data flow. When a number is questioned, there should be one authoritative source to check.
The biggest payoff from a well-executed audit is attribution accuracy. Clean, deduplicated conversion data improves both your internal budget decisions and the quality of signals you send to ad platform algorithms. When Meta and Google receive enriched, accurate conversion data through server-side integrations, their optimization engines work better, which means your ad spend goes further.
Cometly anchors this rationalized stack by connecting your ad platforms, CRM, and website data into a single customer journey view with real-time insights. Its 70+ native integrations mean it can ingest data from most tools already in your stack, and its AI-powered recommendations help you identify which campaigns are actually driving revenue, not just clicks. Get your free demo and establish the attribution foundation your rationalized stack needs.