Most B2B SaaS marketing teams are running paid ads across multiple channels simultaneously. The problem is not the spending. The problem is not knowing which spend is actually working. Without clear paid advertising performance insights, budget decisions become guesswork, and guesswork burns cash.
This article breaks down seven strategies that help marketing teams move from surface-level metrics to revenue-connected intelligence. Whether you are managing Google Ads, Meta campaigns, LinkedIn, or TikTok, the frameworks here apply across channels and company stages.
Each strategy builds on the last, taking you from foundational tracking hygiene all the way to AI-powered optimization. By the end, you will have a clear picture of what to measure, how to connect ad data to revenue, and which approaches give you the most accurate view of campaign performance.
These are not theoretical concepts. They are practical approaches used by growth-focused B2B SaaS teams who need to justify ad spend, scale what works, and cut what does not. Let us get into it.
1. Build a First-Party Data Foundation Before Scaling Ad Spend
The Challenge It Solves
Browser-based pixel tracking has become increasingly unreliable. Ad blockers, iOS privacy updates, and ongoing cookie deprecation mean that a meaningful portion of your conversions are simply not being recorded by traditional tracking methods. When your data is incomplete from the start, every insight you derive from it is compromised. Scaling ad spend on top of broken tracking is one of the most expensive mistakes a growth team can make.
The Strategy Explained
Server-side tracking and Conversion API (CAPI) integrations send conversion data directly from your server to ad platforms, bypassing browser limitations entirely. This approach captures events that would otherwise be lost to ad blockers or privacy restrictions, giving you a more complete and accurate picture of what is actually happening after someone clicks your ad.
For B2B SaaS companies specifically, this matters even more. Long sales cycles mean touchpoints occur across multiple sessions, devices, and timeframes. Browser cookies cannot reliably stitch that journey together. Server-side tracking can. Think of it as building on solid ground before adding floors to your house. The stronger your data foundation, the more reliable every insight that follows.
Implementation Steps
1. Audit your current tracking setup to identify gaps between reported conversions and actual CRM-recorded leads or sign-ups.
2. Implement server-side event tracking using a platform that supports direct API connections to Meta, Google, and other ad platforms.
3. Validate your setup by comparing server-side conversion counts against platform-reported numbers and CRM data to confirm accuracy.
4. Set up deduplication logic to ensure that the same conversion event is not counted twice across both browser and server-side tracking.
Pro Tips
Prioritize the conversion events that matter most to your business, such as demo requests, trial sign-ups, and qualified lead submissions. Not every micro-event needs server-side tracking. Focus your setup on the signals that actually feed your attribution models and ad platform optimization algorithms. Platforms like Cometly make this significantly easier with native Conversion API integrations that connect directly to your ad platforms without requiring custom engineering work. The iOS 14 privacy changes that accelerated these tracking challenges are worth understanding in full if you have not already reviewed their long-term impact.
2. Choose the Right Attribution Model for Your Sales Cycle
The Challenge It Solves
Last-click attribution is one of the most common and most damaging defaults in B2B paid advertising. When a deal takes weeks or months to close and involves multiple stakeholders, crediting only the final touchpoint dramatically undervalues every ad interaction that happened before it. Top-of-funnel campaigns look like they are not working. Mid-funnel nurture campaigns are invisible. Budget shifts to bottom-funnel channels, which then underperform because the pipeline feeding them has dried up.
The Strategy Explained
Multi-touch attribution distributes conversion credit across all the touchpoints in a buyer's journey rather than awarding it entirely to the last interaction. Different models handle this distribution in different ways. Linear models give equal credit to every touchpoint. Time-decay models give more credit to touchpoints closer to the conversion. Data-driven models use machine learning to assign credit based on actual influence patterns in your data.
The right model for your team depends on the length and complexity of your sales cycle. If your average deal takes three months and involves five touchpoints, a linear or time-decay model will give you a far more accurate picture than last-click. The goal is to select a model that reflects how your buyers actually behave, not how a default platform setting assumes they do.
Implementation Steps
1. Document the average length of your sales cycle and the typical number of touchpoints involved from first ad exposure to closed deal.
2. Review your current attribution model settings across each ad platform and note where last-click is still the default.
3. Select a multi-touch attribution model that aligns with your sales cycle complexity, starting with linear if you are new to multi-touch.
4. Run both models in parallel for a period to compare how credit distribution changes across your campaigns before committing to a new model.
Pro Tips
Avoid switching attribution models mid-quarter when you are making budget decisions. Establish your model, let it run for a full reporting cycle, and then use the data to inform your next planning period. Consistency in your model is as important as the model itself. Tools like Cometly allow you to compare attribution models side by side so you can see how different frameworks change the credit picture before making permanent changes. Understanding attribution window performance is equally important when evaluating how your model captures touchpoints across longer sales cycles.
3. Track the Full Customer Journey, Not Just the Click
The Challenge It Solves
Most paid advertising reporting stops at the click or, at best, the form fill. But in B2B SaaS, the click is just the beginning. A prospect might click a LinkedIn ad, read a blog post, attend a webinar, and engage with a retargeting campaign before ever requesting a demo. If you are only tracking the click that preceded the form fill, you are crediting one touchpoint and ignoring the five that made it possible.
The Strategy Explained
Customer journey analytics maps every interaction a prospect has with your brand from first ad exposure through every subsequent touchpoint, all the way to closed-won revenue. This visibility reveals which ad sequences and channel combinations produce the highest-value customers, not just the most form fills.
Here is where it gets interesting: the campaigns that generate the most leads are often not the same campaigns that generate the most revenue. Journey analytics exposes that gap. You might discover that a specific LinkedIn campaign rarely produces the first touch but almost always appears in the journey of your highest-value customers. Without full journey visibility, you would never know to protect that budget.
Implementation Steps
1. Define the key stages in your customer journey, from first ad click through demo, trial, opportunity, and closed-won deal.
2. Ensure your tracking captures events at each stage and that those events are tied to a persistent user or account identifier across sessions.
3. Connect your ad platform data to your CRM so that journey stages map to pipeline stages, not just website events.
4. Analyze journey paths by customer value, not just conversion volume, to identify which sequences produce your best customers.
Pro Tips
Pay particular attention to the touchpoints that appear most frequently in the journeys of your highest-value accounts. These are often the channels that deserve more budget, even if they do not look impressive in last-click or volume-based reporting. Cometly's customer journey analytics capabilities are built specifically to surface these patterns for B2B SaaS teams. Pairing journey data with a structured marketing attribution report makes it far easier to communicate these findings to leadership and justify budget decisions.
4. Connect Ad Spend Directly to Pipeline and Revenue
The Challenge It Solves
Click-through rate, cost per click, and even cost per lead are useful directional metrics. But they can be deeply misleading when used as primary success measures for B2B SaaS ad campaigns. A campaign with a low CPL might be generating leads that never close. A campaign with a high CPL might be generating leads that convert to annual contracts worth many times the acquisition cost. Without connecting ad spend to actual pipeline and revenue, you cannot tell the difference.
The Strategy Explained
Revenue-connected attribution replaces surface metrics with closed-loop KPIs that reflect true business outcomes. This means integrating your ad platform data with your CRM to track which campaigns are generating pipeline, and integrating with your billing system to track which campaigns are generating revenue.
When you can see cost per pipeline opportunity and cost per closed deal by campaign, channel, and audience segment, budget decisions become much clearer. You stop optimizing for the cheapest leads and start optimizing for the most valuable ones. This shift is one of the most significant maturity leaps a B2B SaaS marketing team can make, and it requires the right data infrastructure to support it. Understanding how to properly measure advertising effectiveness at the revenue level is the foundation that makes this shift possible.
Implementation Steps
1. Integrate your ad platform data with your CRM so that lead source information is captured and maintained through every pipeline stage.
2. Connect your billing or revenue data, such as Stripe, to your attribution platform so that closed-won revenue can be traced back to originating campaigns.
3. Build reporting views that show cost per opportunity and cost per closed deal alongside traditional metrics like CPL and CTR.
4. Set revenue-based targets for each paid channel and use those targets to guide budget allocation decisions each quarter.
Pro Tips
Start by connecting just one revenue data source, such as your CRM's closed-won stage, before attempting full billing integration. Getting partial revenue attribution up and running quickly is more valuable than waiting for a perfect setup. Cometly integrates directly with Stripe and major CRMs to create this closed-loop view without requiring custom development work from your engineering team.
5. Use Cross-Channel Analytics to Find Your Real Top Performers
The Challenge It Solves
When you run campaigns across Google, Meta, LinkedIn, and TikTok simultaneously, each platform's native dashboard tells a different story. Google claims credit for conversions that Meta also claims. LinkedIn reports results using its own attribution window. The numbers do not add up, and you end up with a fragmented, inflated picture of performance that makes it nearly impossible to know which channels are genuinely driving growth.
The Strategy Explained
Unified cross-channel analytics consolidates data from all your paid channels into a single view with a consistent attribution model applied across all of them. This eliminates the overlapping, self-serving attribution that native dashboards produce and gives you a neutral, accurate comparison of channel performance.
The natural question becomes: what do you do with this view once you have it? You use it to identify which channels are genuinely contributing to pipeline and revenue, which are consuming budget without proportional return, and where increasing or decreasing investment would have the most impact. Paid ads analytics across a unified platform is the tool that turns your paid advertising portfolio from a collection of separate campaigns into a coordinated, optimizable system.
Implementation Steps
1. Identify all paid channels currently active in your marketing mix and audit which conversion events each platform is currently tracking.
2. Choose a single attribution platform that can ingest data from all channels and apply a consistent attribution model across them.
3. Rebuild your primary performance reporting around this unified view rather than relying on native platform dashboards for budget decisions.
4. Compare channel performance on revenue-connected KPIs rather than platform-reported conversions to identify true top performers.
Pro Tips
When you first consolidate your data into a unified view, expect some channels to look significantly worse than they did in their native dashboards. This is not a problem with the data. It is the data correcting for self-attribution inflation. Use this as an opportunity to reallocate budget toward channels that hold up under neutral attribution scrutiny. Cometly connects to over 70 native integrations, making it straightforward to pull all your paid channel data into one consistent attribution view.
6. Feed Enriched Conversion Data Back to Ad Platforms
The Challenge It Solves
Ad platforms like Meta and Google rely on machine learning to optimize campaign delivery. Their algorithms decide who sees your ads, when, and at what frequency based on the conversion signals you send them. When those signals are incomplete or delayed because browser tracking missed events, the algorithm has less to work with. The result is targeting that is less precise, bidding that is less efficient, and overall campaign performance that underperforms its potential.
The Strategy Explained
Sending enriched, server-side conversion events back to ad platforms gives their algorithms better raw material to work with. Instead of receiving a basic pixel fire that says "someone converted," the platform receives a complete, server-verified event that includes revenue value, lead quality signals, and accurate timing data.
This approach, often called closing the feedback loop, improves algorithmic targeting over time. The platform learns which users are most likely to become high-value customers rather than just which users are most likely to fill out a form. For B2B SaaS teams where lead quality varies significantly, this distinction is enormously valuable. Better signals lead to better audiences, which leads to lower cost per acquisition and stronger long-term campaign performance. Leveraging lookalike audience performance becomes significantly more powerful when the seed data you are feeding platforms is enriched with real revenue signals.
Implementation Steps
1. Identify the conversion events that carry the most signal value for your business, such as qualified demo requests or trial activations with revenue potential.
2. Set up server-side event transmission to Meta's Conversion API and Google's Enhanced Conversions for these high-value events.
3. Include revenue values and lead quality scores in your conversion event payloads where your CRM data supports it.
4. Monitor your Event Match Quality scores in Meta and your conversion tracking diagnostics in Google to confirm that enriched data is being received correctly.
Pro Tips
Focus on sending conversion events that reflect actual business value rather than every micro-interaction on your site. Sending too many low-quality signals can dilute the algorithm's understanding of what a valuable conversion looks like. Prioritize quality over quantity in what you send back. Platforms like Cometly are designed to handle this enrichment and transmission automatically, ensuring your ad platform algorithms are consistently receiving clean, revenue-qualified conversion data.
7. Use AI-Driven Insights to Scale What Is Working
The Challenge It Solves
Manual reporting creates an unavoidable lag between when performance data becomes available and when your team acts on it. By the time you have pulled reports, analyzed trends, and made budget decisions, the campaign conditions that produced your data may have already changed. For teams managing large ad portfolios across multiple channels, this lag means you are always optimizing for yesterday's performance rather than today's reality.
The Strategy Explained
AI-powered analytics continuously monitors campaign performance across all channels, surfaces anomalies and patterns as they emerge, and recommends optimization actions in real time. Instead of waiting for your weekly reporting cycle, you receive signals when something is working exceptionally well or when performance is deteriorating, before it significantly impacts your results.
This approach replaces reactive decision-making with proactive optimization. Your team is no longer hunting for insights in spreadsheets. The insights come to you, prioritized by impact and ready to act on. For growth teams that need to move quickly, this kind of automated intelligence is the difference between scaling confidently and scaling cautiously. Combining AI-driven signals with a clear campaign performance analytics framework ensures your team is acting on the right data at the right time.
Implementation Steps
1. Consolidate your paid channel data into a single platform that supports AI-driven analysis across all sources simultaneously.
2. Configure performance alerts for significant changes in key metrics, such as cost per opportunity, conversion rate, and revenue per campaign.
3. Review AI-generated recommendations on a regular cadence, such as daily or every two days, rather than waiting for weekly reporting meetings.
4. Test AI-recommended budget reallocations on a portion of your budget before applying them broadly to validate the recommendations against your own judgment.
Pro Tips
Treat AI recommendations as a starting point for decision-making, not an automatic override of your strategy. The best results come from combining AI-surfaced patterns with your team's contextual knowledge about campaign goals, audience behavior, and business priorities. Cometly's AI ads manager is built to surface high-performing ads and campaigns across every channel, giving growth teams the intelligence they need to scale with confidence rather than caution.
Putting It All Together
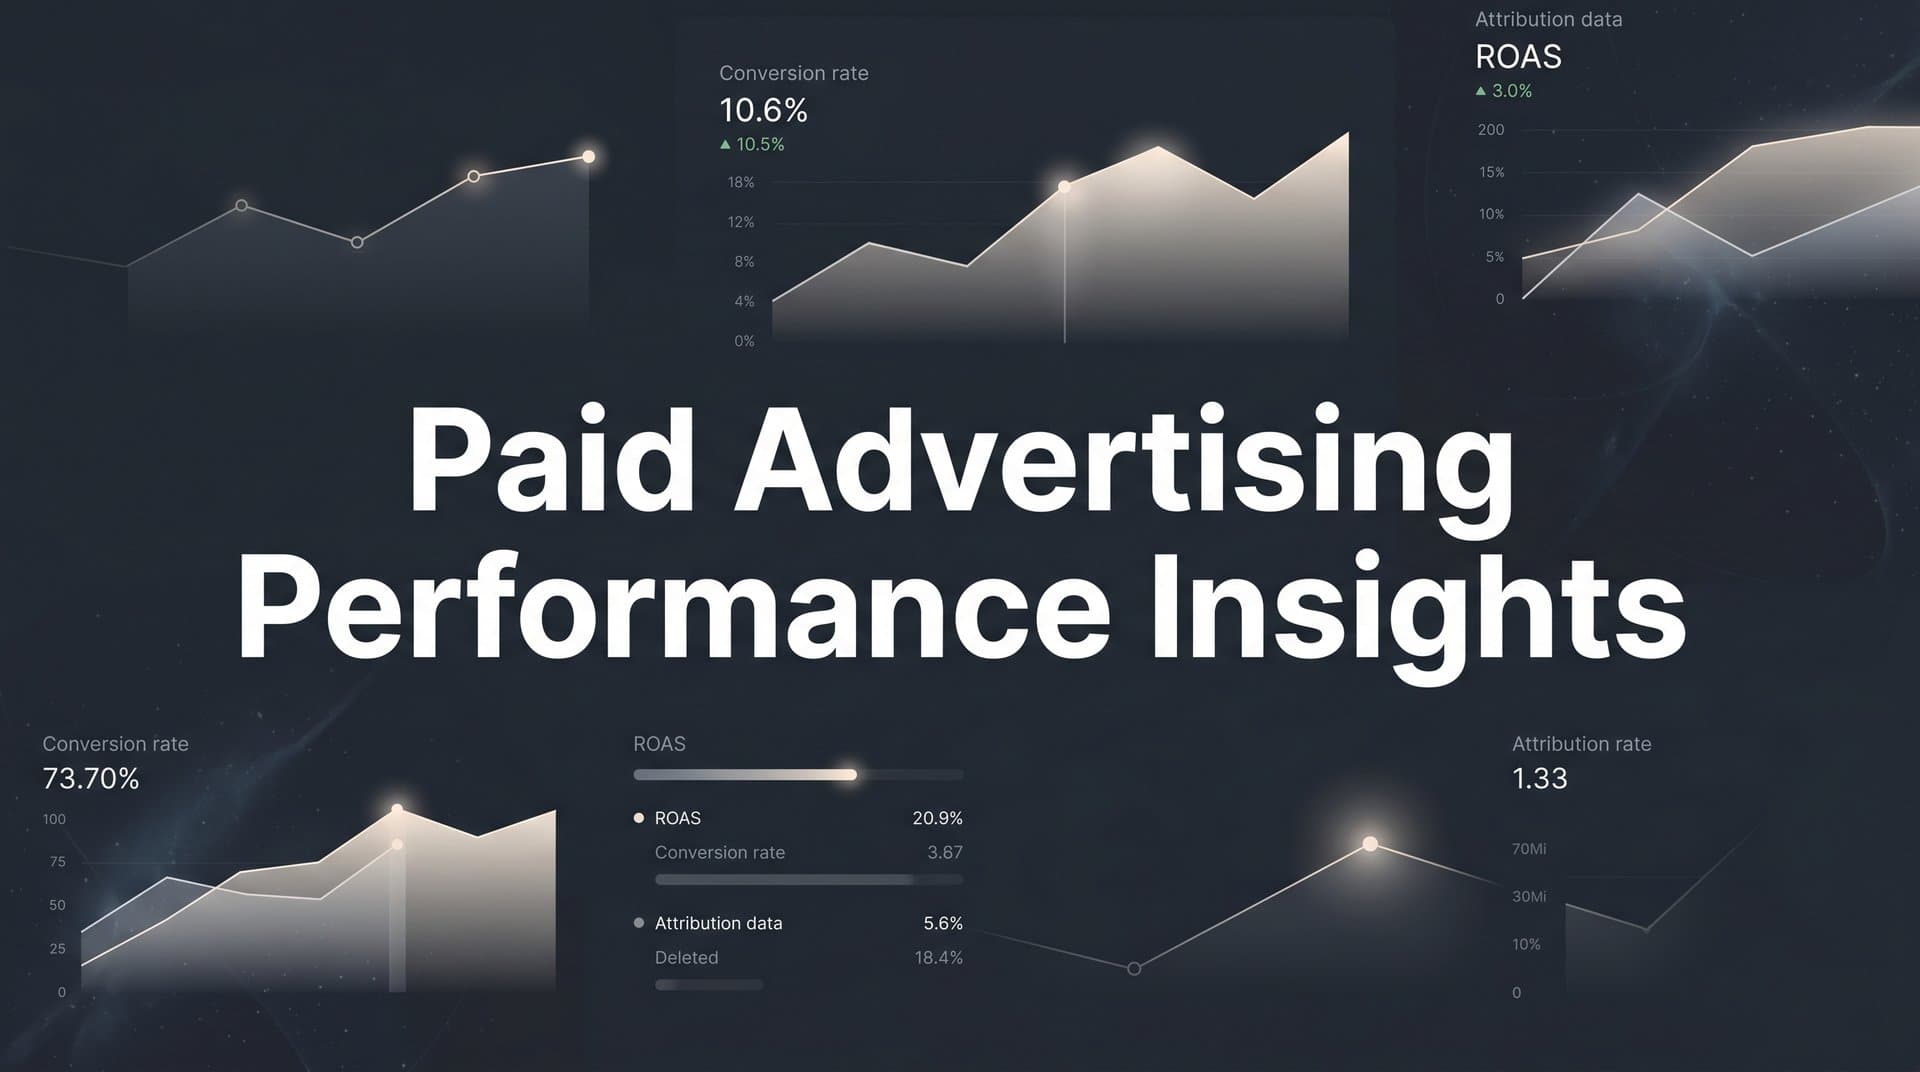
Paid advertising performance insights are only valuable when they are accurate, complete, and connected to revenue. The seven strategies outlined here build on each other progressively, and that progression matters.
Start with a solid first-party data foundation so that every insight you generate is built on reliable data. Choose an attribution model that reflects your actual sales cycle so that credit is distributed in a way that mirrors reality. Expand your view from individual clicks to the full customer journey so you understand which sequences and combinations produce your best customers.
From there, connect that journey to pipeline and revenue so your budget decisions are grounded in business outcomes rather than vanity metrics. Consolidate your cross-channel data into a single, consistent attribution view so you can finally compare channels on equal footing. Feed enriched conversion signals back to ad platforms so their algorithms work harder for you. And let AI surface the patterns your team cannot catch manually so you can act faster than your competitors.
The marketers who win are not necessarily the ones with the biggest budgets. They are the ones who know exactly where their budget is working and can act on that knowledge faster than everyone else.
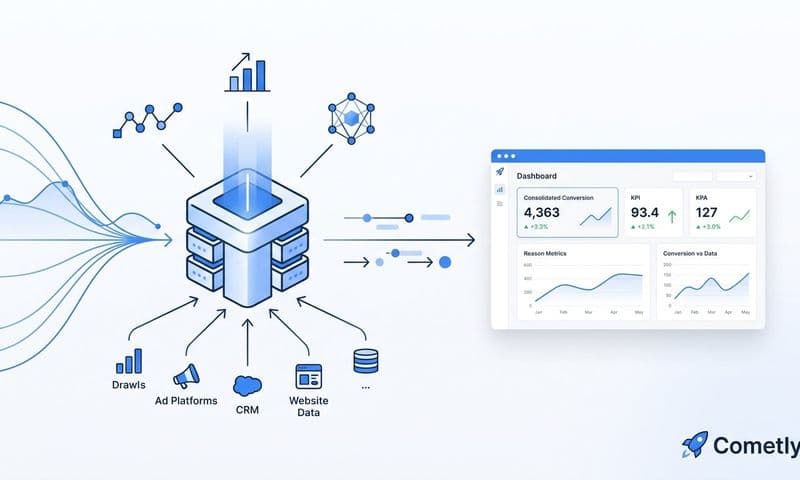
Cometly is built to give B2B SaaS marketing teams exactly that kind of clarity. It connects your ad platforms, CRM, and website into a single attribution view, tracks every touchpoint from first click to closed revenue, and uses AI to surface the insights that drive smarter scaling decisions. If you are ready to stop guessing and start growing with confidence, Get your free demo today and see how Cometly can become your single source of truth for paid advertising performance.