

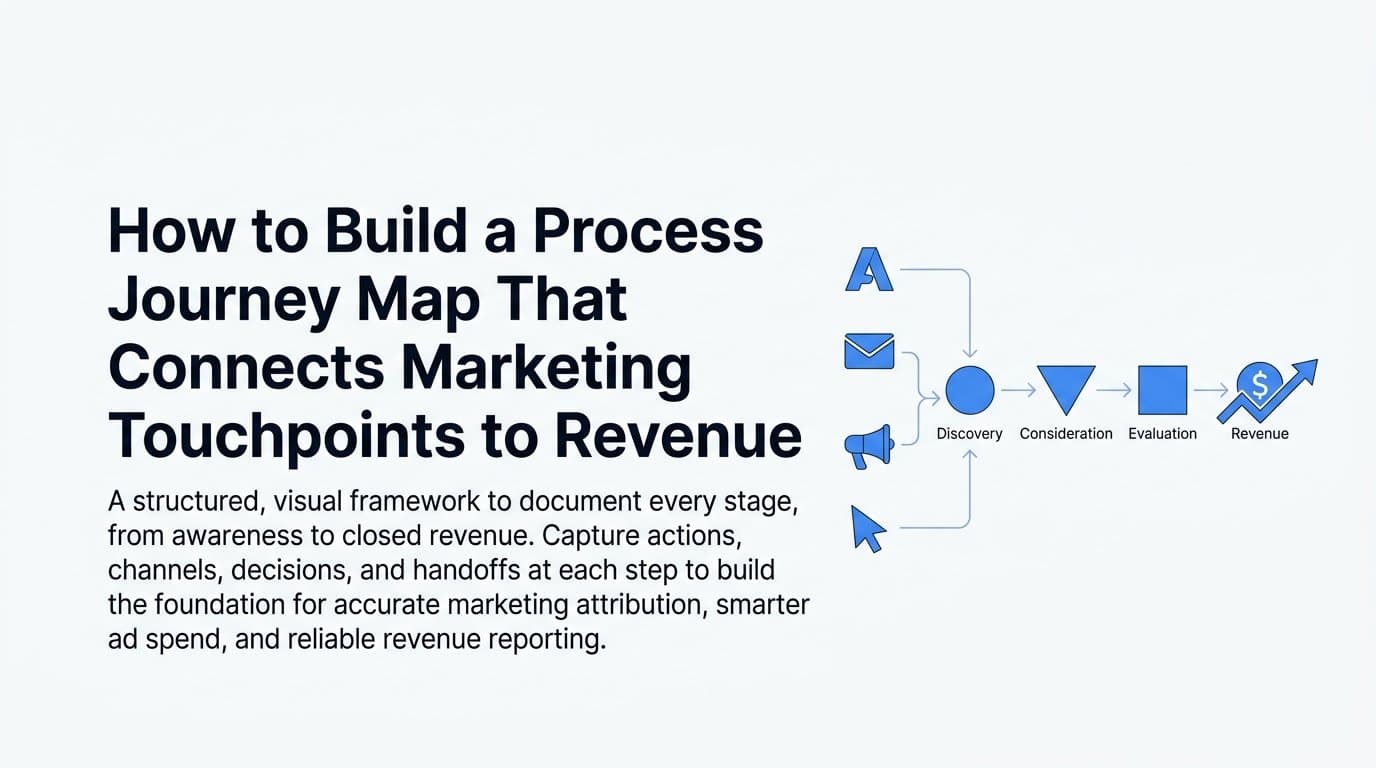
Most B2B SaaS marketing teams know they have a customer journey problem before they can articulate it. Leads arrive from multiple channels, move through sales cycles that span weeks or months, and somewhere between the first ad click and a closed deal, the data trail goes cold. You are left guessing which campaigns actually drove revenue and which ones just generated noise.
A process journey map solves this by giving your team a structured, visual framework that documents every stage a prospect moves through, from initial awareness to becoming a paying customer. Unlike a basic funnel diagram, a process journey map captures the specific actions, channels, decisions, and handoffs that occur at each stage.
When built correctly, it becomes the foundation for accurate attribution, smarter ad spend decisions, and a shared understanding of what actually drives revenue. It also exposes the gaps in your tracking setup before those gaps cause reporting errors that distort your budget decisions.
This guide walks you through how to build one from scratch. You will learn how to define your journey stages, identify the touchpoints that matter most, map the data flow between your tools, assign attribution logic, connect your map to live tracking infrastructure, and use that map to find real optimization opportunities.
Whether you are a marketing leader trying to justify ad spend or a growth operator building out your attribution stack, this process gives you a repeatable method for turning scattered data into a clear, actionable picture of your customer journey. Let's get into it.
Step 1: Define Your Journey Stages and Scope
Before you can map anything, you need to agree on what the journey actually looks like. This sounds simple, but it is where most teams run into their first problem: marketing and sales often have different definitions of the same stages.
Start by opening your CRM and looking at your pipeline stages. These are the closest thing you have to a documented journey, and they give you a practical starting point grounded in real data rather than theory.
For most B2B SaaS companies, the journey moves through stages that look something like this:
Awareness: The prospect encounters your brand for the first time through a paid ad, organic search result, social post, or referral.
Consideration: The prospect engages more deeply, visiting your website multiple times, reading content, or watching a demo video.
Lead Capture: The prospect submits a form, signs up for a trial, or requests a demo, creating a record in your CRM.
Marketing Qualified Lead (MQL): The lead meets a defined threshold of engagement or fit criteria that signals readiness for sales outreach.
Sales Qualified Lead (SQL): A sales rep has reviewed and accepted the lead, confirming it meets the criteria for active pursuit.
Opportunity: A formal deal is open in the CRM with a projected close date and value.
Closed-Won: The deal is signed and revenue is recognized.
Resist the urge to add too many micro-stages at this point. The goal is to capture the major transitions where handoffs or decisions occur, not every possible interaction. You can always add granularity later.
For each stage, document two things: who owns it and what the entry and exit criteria are. Marketing typically owns Awareness through MQL. Sales owns SQL through Closed-Won. Defining ownership prevents the data gaps that happen when no one is accountable for a transition.
Entry and exit criteria are equally important. If your MQL definition is vague, your data will be vague. A prospect becomes an MQL when they meet specific conditions, such as visiting the pricing page and downloading a resource. A prospect exits the Opportunity stage when a contract is signed or the deal is marked lost. These definitions make your map reflect actual behavior rather than aspirational flow.
Tip: Interview both your marketing and sales teams before finalizing stage definitions. You will often discover that the two teams are using the same labels to describe different things, and that misalignment is a root cause of attribution confusion.
You know this step is complete when you have a linear list of five to eight stages, each with a documented owner and clear transition criteria.
Step 2: Identify Every Touchpoint Within Each Stage
Now that your stages are defined, the next step is to populate each one with every interaction a prospect can have with your brand. This is your touchpoint inventory, and it is the core of the process journey map.
Go through each stage and list every channel and interaction type that could occur there. Think broadly at first. You can prioritize later.
Paid touchpoints include Google Ads, Meta ads, LinkedIn campaigns, and retargeting sequences. Owned touchpoints include your website, landing pages, email nurture sequences, and webinars. Earned touchpoints include organic search, review sites like G2 or Capterra, and referrals from existing customers or partners.
For each touchpoint, note three things:
Channel type: Is it paid, owned, or earned? This matters for budget allocation decisions later.
Intent: What is this touchpoint designed to do? Is it creating awareness, nurturing consideration, or driving a conversion action? A LinkedIn thought leadership ad has a different job than a retargeting ad serving a demo request offer.
Tracking status: Is this touchpoint currently being tracked? If yes, how? If no, why not? This is your attribution audit in real time.
The tracking status column is where things get revealing. Most teams discover that their paid channels are well-tracked at the click level but poorly tracked at the conversion level. Email touchpoints often go unrecorded in the CRM. Sales calls and demos, which are among the highest-intent interactions in the entire journey, frequently have no connection back to the originating ad campaign.
Flag any touchpoints that involve offline or human interactions. A demo call is a critical touchpoint, but it lives in a calendar tool or sales rep's notes rather than in your attribution platform. These are the interactions that most commonly break the digital tracking chain.
Tip: Pull a sample of ten to twenty recent closed-won deals from your CRM and trace back every recorded interaction for each one. This exercise validates your touchpoint list against real journeys and often surfaces interactions you forgot to include, or reveals that touchpoints you assumed were being tracked are actually missing from the record.
You know this step is complete when each stage has at least three to five documented touchpoints, and each touchpoint has a channel, intent, and current tracking status recorded next to it.
Step 3: Map the Data Flow Between Your Tools
Your process journey map now has stages and touchpoints. The next layer is understanding how data moves between the tools that capture those touchpoints. This is where most attribution problems originate, and making it visible is one of the highest-value things this exercise produces.
Start by listing every tool in your marketing and sales stack that touches prospect data. This typically includes your ad platforms (Google Ads, Meta, LinkedIn), your website analytics tool, your CRM, your email platform, and your attribution software.
Then, for each touchpoint in your map, document the data flow: where does the data originate, and where does it end up?
A typical flow for a paid search conversion might look like this: a prospect clicks a Google Ad, lands on your website, submits a form, the form fires a conversion event to Google Ads via a browser pixel, the lead record is created in your CRM, and your attribution platform receives the event data from both Google and the CRM. That is a clean flow when it works. The problem is that it often does not.
Common failure points include:
Missing UTM parameters: If UTM parameters are not appended to every ad URL and captured at the form level, you cannot trace a CRM lead back to its originating campaign. This single gap makes revenue attribution to specific ads nearly impossible.
Pixel blocking: Browser privacy restrictions and ad blockers prevent client-side pixels from firing reliably. If your conversion tracking relies entirely on browser-based pixels, you are likely undercounting conversions.
Inconsistent CRM field population: If sales reps do not consistently log activities, or if lead source fields are left blank, your CRM data becomes unreliable as an attribution source.
Note whether your tracking relies on client-side or server-side data collection at each stage. Client-side tracking uses browser pixels that are increasingly blocked. Server-side tracking, via Conversion APIs like Meta CAPI or Google Enhanced Conversions, sends event data directly from your server to the ad platform, bypassing browser limitations. Flag any critical conversion events that lack server-side coverage, because those are your highest-risk attribution gaps.
Tip: Build a simple table with five columns: Stage, Touchpoint, Tool Capturing Data, Data Sent To, and Gap or Issue. Fill it in for every touchpoint in your map. When you finish, the Gap column will show you exactly where your attribution errors are coming from.
You know this step is complete when you have a documented data flow diagram that shows exactly where each touchpoint's data originates and where it ends up, including every gap or broken handoff in the chain.
Step 4: Assign Attribution Logic to Each Touchpoint
You now have a map of your stages, touchpoints, and data flows. The next question is: when a deal closes, how do you distribute credit across all the touchpoints that contributed to it?
This is the attribution model decision, and it has a significant impact on how you evaluate channel performance and allocate budget.
The main models each tell a different story about your customer journey:
First-touch attribution gives all credit to the first interaction a prospect had with your brand. It is useful for understanding which channels are best at creating awareness and generating new demand.
Last-touch attribution gives all credit to the final interaction before conversion. It highlights what is driving prospects to take action, but it ignores everything that built the relationship up to that point.
Multi-touch linear attribution distributes credit equally across all touchpoints in the journey. It gives a more balanced view of the full funnel but can dilute the perceived impact of high-intent touchpoints.
Time-decay attribution gives more credit to touchpoints that occurred closer to the conversion. For longer sales cycles, this model acknowledges that late-stage interactions often have more direct influence on the close.
Position-based attribution (also called U-shaped) gives the most credit to the first and last touchpoints, with the remainder distributed across the middle. It balances awareness and conversion credit while still recognizing the nurture layer.
For B2B SaaS with complex, multi-month sales cycles, multi-touch models typically give a more accurate picture than single-touch models. A prospect who saw five LinkedIn ads, attended a webinar, received three nurture emails, and then booked a demo should not have all the credit assigned to the demo request page.
Document which model you will use as your primary view and which you will use as a secondary check. Using multiple model views helps you validate decisions. For example, use first-touch to evaluate awareness channel spend and multi-touch to evaluate full-funnel ROI.
Pay special attention to touchpoints that currently receive zero attribution credit but are known to influence deals. Nurture emails sent between an MQL and an SQL, or retargeting ads that run during the consideration stage, often play a real role in keeping prospects engaged but go uncredited in single-touch models.
You know this step is complete when every touchpoint in your map has a defined role in your attribution logic, and you have documented both your primary and secondary attribution model views.
Step 5: Connect Your Map to Live Tracking Infrastructure
The process journey map you have built so far is a strategic document. This step is where it becomes operational. You are going to use it as a checklist to configure and verify your actual tracking setup.
Go back to your map and treat every touchpoint as a tracking requirement. If a touchpoint is documented in your map but does not have a corresponding conversion event firing and being received by your attribution platform, that is a gap you need to close.
Start with your highest-value conversion events: form submissions, trial signups, demo requests, and Closed-Won opportunities. These are the events that directly feed your revenue attribution, and they need to be rock solid before you worry about earlier-stage touchpoints.
For each critical conversion event, implement server-side tracking via Conversion API if you have not already. Sending event data directly from your server to Meta, Google, or your attribution platform bypasses the browser restrictions that make client-side pixels unreliable. This step alone can significantly improve the completeness of your conversion data.
Next, audit your UTM parameter setup. Every paid ad URL should have UTM parameters appended consistently: source, medium, campaign, content, and term where applicable. Those parameters need to be captured at the form submission level and stored in your CRM as lead source fields. If a lead comes in and the source field is blank, you have a UTM gap that makes revenue attribution impossible for that record.
Set up event deduplication for any conversion events that fire via both client-side and server-side tracking. Without deduplication, the same conversion will be counted twice, which inflates your reported conversion numbers and distorts your attribution data.
Once your tracking is configured, run a test. Submit a form yourself, move through the journey manually, and confirm that each stage fires the correct event in the correct tool. Check that the event appears in your ad platform, your CRM, and your attribution platform with consistent data attached.
Platforms like Cometly are built specifically to support this kind of setup. Cometly connects your ad platforms, CRM, and website into a single attribution view, making it straightforward to verify that your process journey map aligns with your live data. It also supports server-side Conversion API integration and event deduplication, which addresses two of the most common tracking failure points identified in Step 3.
You know this step is complete when every touchpoint in your map has a live, verified tracking event and your attribution platform is receiving accurate data from all major sources.
Step 6: Analyze the Map to Find Revenue Gaps and Optimization Opportunities
With live data flowing through your tracking infrastructure, your process journey map shifts from a planning document into an analysis tool. This is where the work pays off.
Start by comparing expected touchpoint sequences against actual customer journey data. Your map represents how you designed the journey to work. Your data shows how prospects are actually moving through it. The gap between those two pictures is where your optimization opportunities live.
Look for stages where prospects are dropping off at a higher rate than expected. A high drop-off between MQL and SQL might indicate a lead quality problem, meaning your awareness campaigns are attracting the wrong audience. A high drop-off between Opportunity and Closed-Won might point to a sales process issue or a pricing objection that is not being addressed. Either way, the map helps you locate the friction point so you can investigate it.
Next, analyze which touchpoints appear most frequently in the journeys of closed-won deals versus deals that went cold. This comparison reveals your highest-value interactions. If prospects who attended a webinar convert at a significantly higher rate than those who did not, that is a signal to invest more in webinar production and promotion. If a specific retargeting ad appears in nearly every closed-won journey, that ad deserves more budget and attention.
Look at which ad channels are generating touchpoints at the awareness stage versus which ones are driving late-stage conversions. A channel that generates a lot of first touches but rarely appears in closed-won journeys may be building brand awareness without closing deals. A channel that appears frequently at the consideration and conversion stages but rarely at awareness may be dependent on other channels to fill the top of the funnel. Understanding this dynamic helps you allocate budget across the full journey rather than optimizing for a single stage.
Use your attribution data to calculate the cost per touchpoint by channel and compare it to the revenue contribution of deals where that touchpoint appeared. This gives you a practical way to evaluate channel efficiency that goes beyond cost per click or cost per lead.
Tip: AI-driven attribution tools can surface patterns across hundreds of customer journeys faster than manual analysis. Cometly's AI-driven recommendations help you identify which ads and campaigns are performing across every channel, so you can prioritize optimization efforts with confidence rather than guesswork.
You know this step is complete when you have identified at least two to three specific touchpoints or stages where changes to your marketing or tracking setup could improve conversion rates or attribution accuracy.
Putting Your Process Journey Map to Work
A process journey map is not a one-time project. It is a living framework that should evolve alongside your marketing mix, your sales process, and your tool stack.
Here is a quick reference checklist to confirm you have completed the full process:
Journey stages defined: Five to eight stages documented with clear ownership and transition criteria.
Touchpoints inventoried: Each stage has documented touchpoints with channel, intent, and tracking status noted.
Data flow mapped: Every touchpoint has a documented data origin, destination, and any identified gaps.
Attribution model assigned: Primary and secondary attribution models are documented, with each touchpoint's role defined.
Tracking verified: Live conversion events are firing for every touchpoint, with server-side coverage on critical events.
Gaps analyzed: At least two to three optimization opportunities have been identified from live journey data.
Plan to review and update your map quarterly. New campaigns introduce new touchpoints. Tool changes can break existing data flows. Sales process updates can shift stage definitions. A quarterly review catches these changes before they create attribution errors that go unnoticed for months.
Cometly is built to operationalize exactly this kind of data-driven operation. It tracks every touchpoint across your ad platforms, CRM, and website, compares attribution models side by side, and feeds enriched conversion data back to Meta, Google, and other ad platforms to improve targeting and optimization. The result is a single source of truth that keeps your process journey map accurate and actionable over time.
Start with Step 1 today. Open your CRM, look at your pipeline stages, and write down the five to eight stages that represent how your prospects actually move from first touch to closed revenue. Everything else builds from there.
A process journey map bridges the gap between how you think your customers move through your funnel and how they actually do. By working through these six steps, you build attribution that is grounded in real behavior rather than assumptions. The teams that get the most value from this exercise are the ones that connect it directly to their tracking infrastructure and use it to make ongoing budget decisions.
Cometly is built to support exactly this kind of operation, connecting your ad platforms, CRM, and website into a single source of truth so your journey map stays accurate and actionable over time. Get your free demo today and start capturing every touchpoint to maximize your conversions.



