

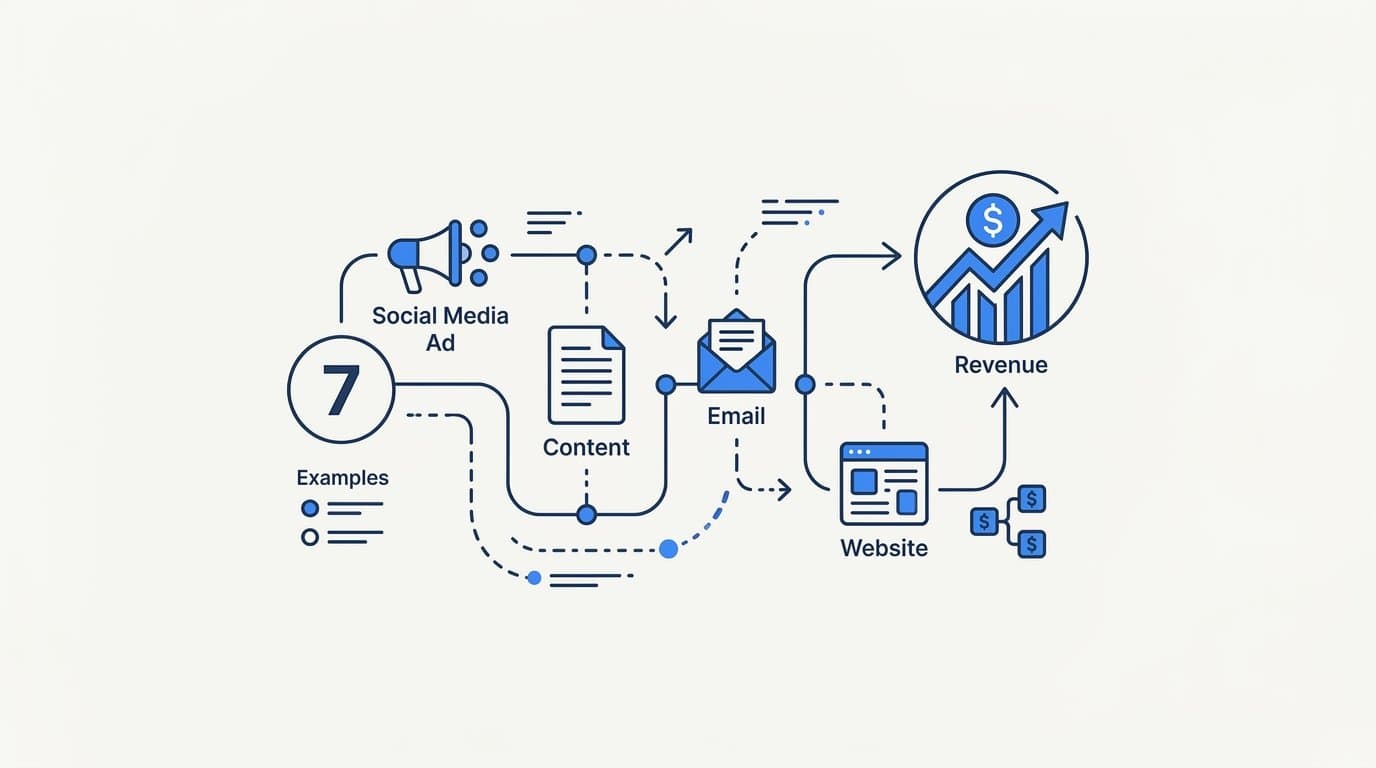
Most B2B SaaS marketing teams build user journey maps as a UX exercise and then leave them in a slide deck. That is a missed opportunity. A well-structured user journey map example does more than document how users move through your product. It reveals exactly where your marketing attribution breaks down, which touchpoints are influencing pipeline, and where ad spend is going to waste.
For growth teams trying to connect ad clicks to closed-won revenue, journey mapping is the analytical foundation that makes attribution data meaningful. Without it, you are optimizing campaigns based on incomplete signals. With it, you can align every touchpoint, from a paid social ad to a product demo request, to a measurable revenue outcome.
This article walks through seven practical user journey map examples built specifically for B2B SaaS marketing teams. Each one addresses a different stage of the funnel, a different attribution challenge, or a different data gap that prevents teams from scaling confidently. Whether you are running multi-touch attribution for the first time or trying to improve the quality of conversion events sent back to Meta and Google, these examples give you a concrete framework to work from.
1. The Awareness-to-Lead Journey Map
The Challenge It Solves
First-touch attribution is a common starting point for understanding which channel introduced a prospect to your brand. The problem is that many B2B SaaS buyers interact with multiple channels before ever submitting a lead form. When teams rely solely on first-touch data without a structured journey map, they often misread which channels are actually driving qualified traffic versus generating vanity clicks that never convert.
The Strategy Explained
The awareness-to-lead journey map documents every interaction from the first paid ad impression to the moment a prospect submits a form or requests a demo. This includes paid search, paid social, display, and organic touchpoints that occur before the conversion event.
The goal is to identify which ad types and channels are generating traffic that actually becomes qualified leads, not just sessions. When you map this journey visually and connect it to your attribution data, patterns emerge quickly. You might discover that LinkedIn ads drive initial awareness but prospects almost always visit via organic search before converting. That insight changes how you allocate budget and how you structure your attribution model.
Implementation Steps
1. Define your lead conversion event clearly: form submission, demo request, or trial signup. Make sure this event is tracked server-side so it is not affected by ad blockers or browser restrictions.
2. Pull a report of all touchpoints that occurred before each lead conversion over the last 90 days. Group them by channel and ad type to identify patterns.
3. Map the most common paths from first impression to lead submission. Identify which paths produce the highest lead quality, not just the highest volume.
4. Use this map to inform how you weight channels in your attribution model. If organic search consistently appears as a second or third touchpoint before conversion, it deserves credit in a multi-touch model.
Pro Tips
Do not optimize purely for cost-per-lead at the top of the funnel. A channel that drives fewer but higher-quality leads is more valuable than one flooding your CRM with unqualified contacts. Your awareness-to-lead map should include a lead quality score alongside volume metrics so you are making decisions on the right signals from the start.
2. The Multi-Channel Touchpoint Journey Map
The Challenge It Solves
B2B SaaS buying decisions rarely happen in a straight line. Prospects interact with paid search, paid social, organic content, and email sequences before they convert. When teams optimize only for the last visible click, they systematically underfund the top-of-funnel channels that started the conversation. This creates a slow erosion of pipeline quality that is hard to diagnose without a cross-channel view.
The Strategy Explained
The multi-channel touchpoint journey map documents the full sequence of interactions across every channel before a conversion event. It answers the question: what combination of touchpoints most reliably produces a qualified opportunity?
This map is where cross-channel attribution models become essential. Linear attribution distributes credit equally across all touchpoints in the journey. Time-decay models weight recent interactions more heavily. Position-based models give more credit to the first and last touch while distributing the remainder across the middle. None of these models is universally correct, but comparing them against each other using the same journey data reveals which channels would lose budget under last-click and which would gain it under a more balanced model.
Implementation Steps
1. Connect all your ad platforms, your website analytics, and your CRM into a single attribution view. Without this unified data layer, your journey map will have gaps that lead to incorrect conclusions.
2. Identify your top ten converting paths by channel sequence. For example: LinkedIn ad, then organic blog, then Google branded search, then demo request. These sequences tell you where to invest.
3. Apply at least two attribution models to the same journey data and compare how credit shifts across channels. Use this comparison to challenge assumptions about which channels are performing.
4. Set budget allocation rules based on the multi-touch view rather than last-click data. Channels that consistently appear early in high-converting journeys deserve sustained investment.
Pro Tips
Tools like Cometly allow you to compare attribution models side by side using the same underlying journey data. This makes it much easier to have budget conversations with leadership because you can show exactly how credit shifts depending on the model, rather than arguing from gut instinct.
3. The Trial-to-Paid Conversion Journey Map
The Challenge It Solves
For product-led growth SaaS companies, the trial-to-paid conversion is one of the most important attribution moments in the entire funnel. But it is also one of the most commonly miscaptured. Browser-based pixel tracking frequently misses this event due to ad blockers, browser privacy restrictions, and cross-device behavior. When this conversion event is not accurately captured, the signals sent back to ad platforms are degraded, and campaign optimization suffers.
The Strategy Explained
The trial-to-paid journey map connects in-product trial behavior back to the original acquisition source. It answers the question: which campaigns and channels are producing trial users who actually convert to paying customers, not just users who sign up and churn?
Server-side tracking via the Conversion API is the key infrastructure change that makes this journey map reliable. Because server-side events are sent directly from your server to the ad platform, they are not affected by browser-level blocking. This means your trial-to-paid conversion data is more complete, more accurate, and more useful for both attribution analysis and ad platform optimization.
Implementation Steps
1. Identify the specific in-product actions that predict paid conversion: completing onboarding, reaching a usage threshold, inviting a team member. These are your leading indicators.
2. Implement server-side conversion tracking for both the trial signup event and the paid conversion event. Verify that these events are being received correctly by your ad platforms.
3. Map the time between trial signup and paid conversion by acquisition channel. Some channels may produce faster converters, which affects how you structure retargeting sequences and email nurture.
4. Feed the paid conversion event back to Meta and Google as a high-value conversion signal. This improves the ad platform AI's ability to find users who resemble your paying customers, not just your trial signups.
Pro Tips
Do not optimize ad campaigns toward trial signups if your trial-to-paid rate varies significantly by channel. A channel with a lower signup volume but a higher conversion rate to paid is more valuable. Your journey map needs to surface this distinction clearly so budget decisions reflect actual revenue impact.
4. The Sales-Assisted Journey Map for B2B SaaS
The Challenge It Solves
Enterprise and mid-market B2B SaaS deals often involve sales cycles that stretch 30 to 90 days or longer, with multiple stakeholders engaging at different points. Marketing generates the initial interest, but sales takes over for discovery, demos, and negotiation. Without a structured journey map that spans both marketing and sales touchpoints, it is nearly impossible to attribute pipeline and revenue back to the campaigns that started the conversation.
The Strategy Explained
The sales-assisted journey map connects CRM pipeline data to the original marketing touchpoints that created each opportunity. It requires integrating your CRM with your attribution platform so that deal stage progression, closed-won events, and revenue data are mapped back to the specific ads and channels that drove the initial engagement.
Offline conversion tracking is the mechanism that makes this possible. When a deal closes in your CRM, that event can be sent back to your ad platforms as an offline conversion, giving credit to the campaign that influenced the outcome even though the conversion happened weeks or months after the initial click.
Implementation Steps
1. Connect your CRM to your attribution platform. Map CRM deal stages to specific journey milestones: MQL, SQL, opportunity created, closed-won.
2. Ensure that every lead entering your CRM carries a source identifier tied to the original marketing touchpoint. This is the thread that connects ad spend to revenue.
3. Set up offline conversion tracking to send closed-won events back to your ad platforms. Include revenue value in the conversion event so platforms can optimize toward high-value deals, not just any conversion.
4. Build a journey map that visualizes the average path from first marketing touch to closed-won by deal size and industry segment. Use this to identify which campaigns are producing enterprise-level opportunities versus SMB deals.
Pro Tips
Account-based marketing teams will find this journey map especially useful. When you can see which campaigns influenced multiple stakeholders within the same account, you can structure ABM sequences more intelligently and attribute revenue to the right combination of touchpoints rather than crediting a single interaction.
5. The Retargeting and Re-Engagement Journey Map
The Challenge It Solves
Retargeting campaigns target users who have already interacted with your brand but did not convert. The attribution challenge here is significant. If a prospect was going to convert anyway through organic or direct traffic, and your retargeting ad simply appeared in their feed before they did, you risk attributing that conversion to the retargeting campaign when it deserves credit elsewhere. This double-counting inflates retargeting ROAS and leads to over-investment in a channel that may be claiming credit rather than driving it.
The Strategy Explained
The retargeting and re-engagement journey map documents how prospects who did not initially convert re-enter the funnel, which touchpoints they interact with during their return, and how to correctly attribute the final conversion across the original and retargeting interactions.
First-party data enrichment is the key to making this journey map accurate. When your retargeting audiences are built from enriched first-party data rather than simple pixel-based cookie pools, you are targeting the right users with the right message. This reduces wasted spend on users who were never likely to convert and improves the signal quality of the conversions that do occur.
Implementation Steps
1. Audit your current retargeting attribution setup. Identify whether your retargeting conversions are being reported with view-through attribution, click-through attribution, or both. Understand what that means for how credit is being assigned.
2. Build retargeting audiences from first-party CRM data and enriched behavioral signals rather than relying solely on pixel-based tracking. This improves audience quality and reduces audience overlap with organic converters.
3. Use a holdout test or incrementality measurement to assess how many retargeting conversions are truly incremental versus conversions that would have happened anyway. This gives you a realistic view of retargeting's actual contribution.
4. Map the re-engagement journey separately from the initial awareness journey. Identify which retargeting ad formats and messages are most effective at different stages of the re-engagement sequence.
Pro Tips
Frequency caps matter more than most teams realize in retargeting. Without them, you risk burning out audiences and generating negative brand associations. Your re-engagement journey map should include frequency thresholds as a built-in guardrail, not an afterthought.
6. The Revenue Attribution Journey Map
The Challenge It Solves
Most marketing attribution stops at the lead or MQL stage. Teams celebrate a low cost-per-lead without knowing whether those leads ever became paying customers. This creates a fundamental disconnect between marketing metrics and business outcomes. When you cannot connect ad spend to actual revenue, you cannot calculate true ROAS, and you cannot make confident budget decisions based on what is actually working.
The Strategy Explained
The revenue attribution journey map connects the full customer journey from first ad click to closed-won deal and revenue. It requires integrating billing or payment data with your marketing attribution platform so that actual revenue, not just pipeline, is tied back to specific campaigns and channels.
For B2B SaaS companies using Stripe, connecting Stripe revenue data to ad platform data creates a complete attribution picture. You can see which campaigns are driving customers with the highest lifetime value, which channels produce the fastest time-to-revenue, and which ad types generate trials that convert at the highest rate. This is the data that enables confident, revenue-driven budget allocation.
Implementation Steps
1. Integrate your billing system with your attribution platform. Map revenue events, including initial payment, expansion revenue, and churn, back to the original acquisition source.
2. Calculate true ROAS by channel and campaign using actual revenue data, not lead volume or MQL counts. This single change often reveals that the channels with the lowest cost-per-lead are not the ones producing the highest revenue.
3. Segment your revenue attribution by customer cohort. Customers acquired through different channels often have different retention rates and expansion patterns. Your journey map should reflect these differences.
4. Use revenue attribution data to set campaign-level ROAS targets that reflect the actual value of customers acquired through each channel, including their expected lifetime value.
Pro Tips
Revenue attribution is where Cometly's Stripe integration becomes particularly powerful. When your billing data and ad platform data are connected in a single attribution view, you can move beyond vanity metrics and make every budget decision based on the revenue impact of your campaigns. This is the shift from marketing as a cost center to marketing as a measurable growth driver.
7. The AI-Optimized Journey Map for Scaling Campaigns
The Challenge It Solves
Ad platform AI, including Meta Advantage+ and Google Performance Max, relies on conversion signal quality to optimize targeting and bidding. When the conversion events you send back to these platforms are incomplete, delayed, or inaccurate, the AI makes suboptimal decisions about who to show your ads to and how much to bid. This is a hidden performance leak that affects every campaign running on these platforms, and most teams do not realize it is happening.
The Strategy Explained
The AI-optimized journey map identifies the highest-converting paths in your customer journey and uses that data to inform which conversion events to prioritize in your ad platform feedback loop. It is not just about tracking conversions. It is about sending the right conversion signals, enriched with first-party data, back to the platforms so their AI can find more users who look like your best customers.
Server-side conversion events sent via the Conversion API carry more data and are more reliable than browser-based pixel events. When you enrich these events with customer attributes from your CRM, such as company size, industry, or deal value, you give the ad platform AI a much richer profile of what a high-value conversion looks like. This improves targeting quality over time and reduces wasted spend on audiences that are unlikely to convert.
Implementation Steps
1. Audit the conversion events you are currently sending to Meta and Google. Identify gaps caused by ad blockers, browser restrictions, or delayed reporting. Prioritize implementing server-side tracking for your highest-value conversion events.
2. Enrich your conversion events with first-party data attributes before sending them to ad platforms. The more context the platform AI has about who converted and what they are worth, the better it can optimize targeting.
3. Use your journey map data to identify the conversion events that most reliably predict revenue, not just engagement. Prioritize sending these events as your primary optimization signals.
4. Monitor ad platform AI performance over time as enriched conversion data accumulates. Campaigns optimizing toward high-quality, server-side conversion signals typically improve in efficiency as the AI learns from better data.
Pro Tips
Do not send every conversion event to your ad platforms with equal weight. A trial signup and a closed-won deal are very different signals. Use conversion value to differentiate them so the platform AI learns to prioritize audiences that produce high-value outcomes, not just any outcome. Cometly's AI recommendations can help identify which conversion events are most predictive of revenue so you are feeding the right signals into this feedback loop.
Putting It All Together
User journey maps are not static documents. The most effective ones are living frameworks connected to real attribution data that updates as campaigns run. The seven examples covered here each address a specific gap: from first-touch awareness all the way to closed-won revenue.
The key is to start with the journey stage where your attribution data is weakest and build from there. If you cannot reliably track what happens between a paid ad click and a demo request, start with the awareness-to-lead map. If your sales cycle is long and your CRM data is disconnected from your ad platforms, the sales-assisted map is your priority.
Once your journey maps are grounded in real conversion data, you can feed that data back to ad platforms to improve targeting, use AI to surface scaling opportunities, and make budget decisions with confidence. Each of the seven maps builds on the others. The awareness map informs your multi-channel model. The trial-to-paid map improves the signals you send to ad platforms. The revenue attribution map tells you which of it all is actually worth the investment.
Cometly connects every touchpoint across your customer journey, from ad clicks to CRM events to closed revenue, giving your team the single source of truth that makes journey mapping actionable rather than theoretical. When your attribution data is complete and your conversion signals are enriched, every campaign decision becomes clearer and every scaling move becomes less of a gamble.
Ready to elevate your marketing game with precision and confidence? Discover how Cometly's AI-driven recommendations can transform your ad strategy. Get your free demo today and start capturing every touchpoint to maximize your conversions.



