

Most B2B SaaS companies are remarkably good at spending money to acquire customers. They run paid search campaigns, invest in content, sponsor events, and build SDR teams. What they are often surprisingly bad at is understanding what actually happens between the first ad impression and the moment a prospect signs a contract. That gap is not a small oversight. It is the reason marketing budgets get misallocated, conversion rates stagnate, and growth leaders struggle to explain which investments are genuinely driving revenue.
Customer experience mapping is the strategic practice that closes this gap. At its core, it is the process of documenting every interaction a prospect or customer has with your brand, across every channel and every stage of the funnel, so you can see the journey as it actually unfolds rather than as you assume it does. For B2B SaaS companies, where buying cycles are long, stakeholders are multiple, and touchpoints span paid ads, organic content, sales calls, and product demos, this visibility is not a luxury. It is a competitive requirement.
The challenge is that a customer experience map is only as useful as the data powering it. Without accurate attribution data connecting every touchpoint to real conversion outcomes, the map is a creative exercise rather than a decision-making tool. This article is a practical explainer for growth leaders who want to understand what customer experience mapping is, how it works, and how modern attribution technology transforms it from a static diagram into a living revenue intelligence asset.
The Gap Between How You Think Customers Buy and How They Actually Do
Here is a scenario that plays out constantly in B2B SaaS marketing teams. The team builds a funnel model based on their best understanding of the buyer journey: prospect sees an ad, visits the website, downloads a resource, gets nurtured by email, books a demo, and converts. Budget gets allocated accordingly. Campaigns get optimized around that assumed sequence. And then the numbers do not add up the way they should.
The problem is that the assumed journey and the actual journey are rarely the same thing. Real B2B buying paths are non-linear. A prospect might see a LinkedIn ad, ignore it, search for a competitor review three weeks later, read a blog post from organic search, get a cold email from an SDR, attend a webinar, and then finally book a demo after a colleague mentions the product in a Slack channel. No single touchpoint tells the full story, and optimizing for only one of them misses the compounding effect of the entire sequence.
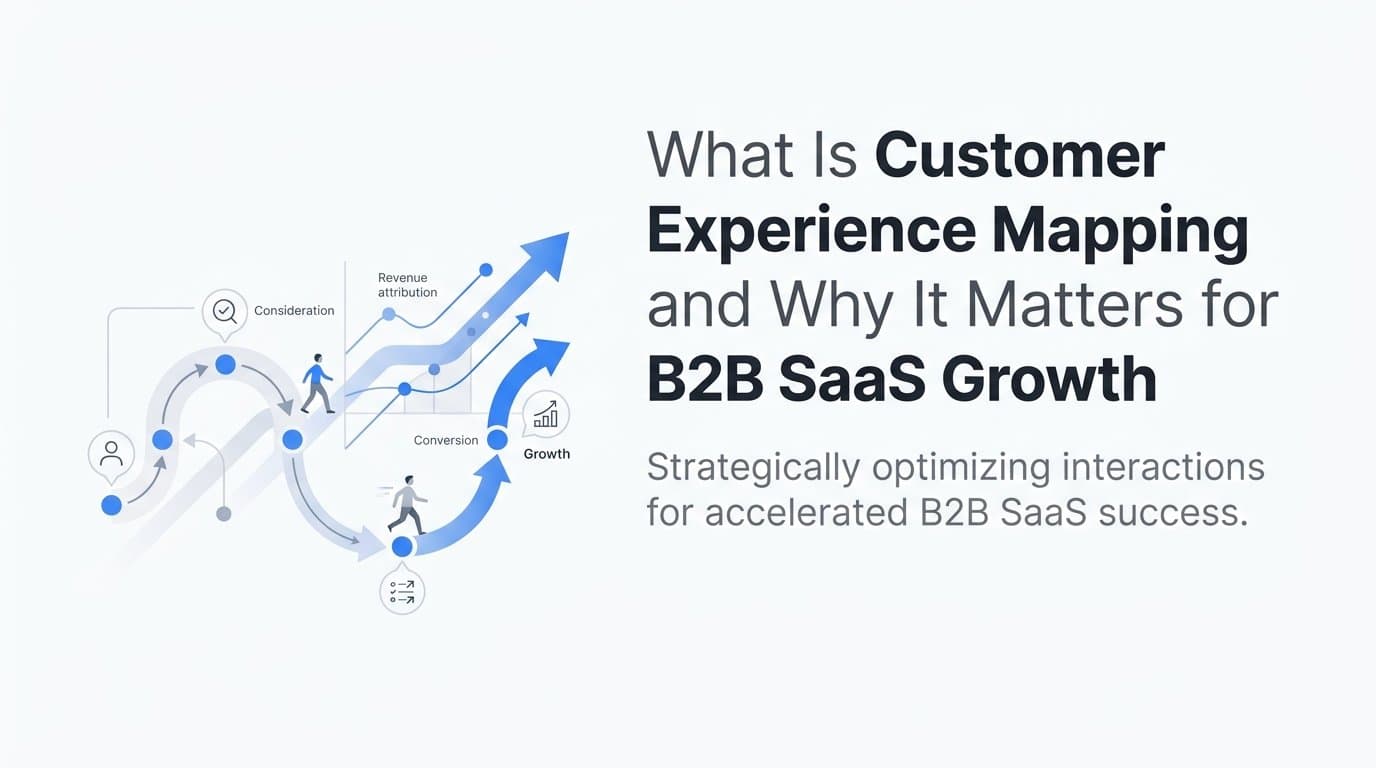
Customer experience mapping is the process of making that actual journey visible. It involves documenting every interaction a prospect or customer has with your brand across all channels and stages, from initial awareness through purchase and beyond. The map captures not just what happened but when it happened, in what order, and what the prospect did next.
Critically, a customer experience map is not a static diagram you build once in a workshop and hang on a wall. It is a living data asset that needs to be continuously updated as real customer behavior evolves. The most valuable maps are built from observed data rather than internal assumptions, which means they require a connected data infrastructure that can capture and sequence touchpoints across every channel where your buyers spend time.
When marketing teams operate without this kind of map, they are essentially optimizing in the dark. They may be cutting budget from a channel that looks low-performing in last-click attribution but is actually a critical early touchpoint in the journeys of their best customers. They may be investing heavily in content that attracts traffic but stalls prospects at the consideration stage. Without a map grounded in real data, these blind spots are invisible, and the budget decisions that follow are built on incomplete information.
The Core Components of a Customer Experience Map
A customer experience map is more than a list of channels your prospects use. It is a structured framework that organizes touchpoints into stages, connects each stage to specific customer actions and signals, and ties every interaction back to a channel source so you understand not just what happened but where it came from.
The foundational layer of any customer experience map is the stage structure. For B2B SaaS, this typically includes awareness, consideration, decision, onboarding, and retention. Each stage represents a distinct phase in the buyer's relationship with your brand and requires different content, messaging, and engagement strategies to move the prospect forward.
Within each stage, the map captures specific touchpoints. These are the individual interactions a prospect has with your brand, whether that is seeing a paid ad, landing on a product page, watching a demo video, receiving a follow-up email, or joining a sales call. Each touchpoint needs to be tied to a channel source so you can trace it back to its origin, whether that is a Google Ads campaign, an organic search result, a referral from a review site, or a direct outreach from your sales team.
Beyond behavioral data, a complete customer experience map also captures intent and emotional signals at each stage. This means understanding what questions prospects are asking when they first discover your brand, what objections they raise during a sales conversation, and what content or interactions consistently move them from one stage to the next versus what causes them to disengage. These qualitative signals are often gathered through sales call recordings, support ticket analysis, and direct customer interviews, and they add crucial context to the quantitative touchpoint data.
Think of it this way: behavioral data tells you what prospects did, and intent signals tell you why they did it. A prospect who visits your pricing page three times in one week is sending a very different signal than one who reads a top-of-funnel blog post and bounces. The map needs to reflect both dimensions to be genuinely useful.
The channel attribution layer is what makes the map actionable for marketing investment decisions. When you can see that a particular sequence of touchpoints, such as a paid social ad followed by an organic search visit followed by a direct demo request, consistently produces closed-won revenue, you have a clear signal about where to concentrate your budget and creative energy. Without that channel-level attribution, the map can describe what happens but cannot tell you which levers to pull to influence it.
Why Attribution Data Is the Engine Behind Accurate Journey Maps
A customer experience map is only as accurate as the data feeding it. This is the point where many well-intentioned journey mapping initiatives break down. Teams build beautiful maps based on assumptions, anecdotes, and incomplete analytics data, then make budget decisions based on a picture of the customer journey that does not reflect reality.
The core data requirement for accurate journey mapping is multi-touch attribution. Unlike last-click or first-click attribution models that assign all credit to a single interaction, multi-touch attribution distributes credit across all the touchpoints in a customer's journey. This gives marketers a true picture of which channels and campaigns are contributing to conversion, not just which one happened to be the final click before a form submission.
Different multi-touch attribution models tell different stories. A linear model distributes credit equally across all touchpoints. A time-decay model gives more credit to touchpoints closer to the conversion event. A data-driven model uses machine learning to assign credit based on the actual statistical contribution of each touchpoint. The model you choose shapes how you interpret the journey map and which investments you prioritize, which is why understanding attribution modeling is inseparable from understanding customer experience mapping.
There is a second, increasingly urgent data quality challenge that marketers need to address: the erosion of browser-based tracking. Ad blockers, cookie restrictions, and mobile privacy changes have created significant gaps in pixel-based tracking. In practical terms, this means that a meaningful portion of touchpoints in your customers' journeys are going unrecorded if you are relying solely on browser-side tracking. Those missing touchpoints create blind spots in your journey map that distort the picture of how customers actually move through the funnel.
Server-side tracking and Conversion API integrations address this problem by capturing event data at the server level rather than relying on the browser. This approach is more resilient to privacy restrictions and ad blockers, which means more complete touchpoint data flowing into your journey map. For B2B SaaS companies making significant investments in paid channels like Meta and Google, the difference between complete and incomplete event data can materially change which campaigns appear to be working and which appear to be underperforming.
Cometly is built around this data quality requirement. Its server-side tracking and Conversion API integrations ensure that touchpoint data is captured accurately across the customer journey, giving marketing teams the complete, reliable data foundation that accurate journey mapping requires. Without this infrastructure, the map has gaps that lead to misaligned decisions.
How to Build a Customer Experience Map That Drives Marketing Decisions
Building a customer experience map that actually influences marketing decisions requires a different approach than the typical workshop-and-whiteboard exercise. It starts with real data, not assumptions, and it requires connecting sources that are often siloed: your ad platforms, your CRM, your website analytics, and your product usage data.
The first step is defining your ideal customer profile and mapping the stages they move through. This is not just a demographic exercise. It means identifying the specific job titles and roles involved in the buying decision, the typical timeline from first awareness to signed contract, and the primary channels through which your best customers first discovered your brand. This profile becomes the lens through which you interpret all of the touchpoint data you collect.
From there, the process involves layering in real touchpoint data rather than hypothetical ones. Pull campaign data from your ad platforms to understand which ads are generating first touches. Connect your CRM data to understand where prospects are in the sales process and what interactions preceded each stage transition. Use your website analytics to identify which pages prospects visit and in what sequence. When these data sources are connected, patterns emerge that would be invisible if you looked at each source in isolation.
One of the most valuable analyses you can run once the data is connected is identifying high-drop-off points between stages. Where are prospects engaging with your brand and then going silent? Cross-reference those drop-off moments with the ad campaigns, landing pages, or content pieces that preceded them. If prospects consistently disengage after visiting a particular landing page, that is a signal that the page is creating friction rather than building momentum toward the next stage.
The natural question then becomes: what should you do with those insights? The map should directly inform budget and creative investment decisions. If the data shows that a particular channel or campaign type appears most frequently in the journeys of prospects who convert to closed-won revenue, that is where you concentrate investment. If a stage transition consistently requires a specific type of content or interaction to move prospects forward, that is where you build creative resources.
The key discipline here is letting the data lead. It is easy to rationalize continuing to invest in channels or content types that feel right based on intuition. The map is valuable precisely because it replaces that intuition with evidence, showing you where the real leverage points are in the journey rather than where you assumed they would be.
Turning Your Journey Map Into a Revenue Intelligence Tool
Most customer experience maps stop at the lead or opportunity stage. They track how prospects move through the marketing funnel but do not connect that movement to what ultimately happens in terms of pipeline creation and closed revenue. For B2B SaaS growth teams, this is where a significant amount of strategic value gets left on the table.
A mature customer experience map connects marketing activity directly to pipeline and revenue. This means being able to see not just which campaigns generate leads but which campaigns generate leads that actually close, at what deal size, and on what timeline. This level of visibility requires connecting your ad platform data to your CRM and, ideally, to your revenue data as well. When that connection exists, you can evaluate marketing investments based on their actual contribution to revenue rather than their contribution to top-of-funnel metrics that may or may not translate downstream.
This is where AI-driven analysis of journey data adds meaningful capability. When you have a large enough volume of customer journeys in your data set, patterns emerge that are not visible through manual analysis. AI can identify which sequences of touchpoints correlate with shorter sales cycles, which campaign types tend to attract prospects with higher average contract values, and which early-stage signals are predictive of eventual conversion. These patterns, surfaced at scale, allow growth teams to make more precise investment decisions than any analyst could produce by reviewing individual journeys.
There is another dimension of revenue intelligence that often gets overlooked: the feedback loop back to ad platforms. When you have enriched, accurate event data that reflects the full customer journey through to closed revenue, you can send that data back to Meta, Google, and other ad platforms through their Conversion API integrations. This improves the algorithmic targeting those platforms use to find new prospects, because the optimization signal you are sending reflects actual revenue outcomes rather than just clicks or form fills. The result is that the platforms get better at finding prospects who match the journey patterns of your best customers.
Cometly connects Stripe revenue data with ad platform data, making it possible to see exactly which campaigns and channels are contributing to closed revenue rather than just pipeline. This is the kind of end-to-end visibility that transforms a customer experience map from a descriptive tool into a genuine revenue intelligence asset. Growth teams can see the full picture from first ad click to signed contract and make investment decisions accordingly.
Putting It All Together: From Map to Measurable Growth
Customer experience mapping shifts marketing from intuition-based to evidence-based decision making. That shift does not happen by building a diagram in a workshop. It happens when you connect the right data infrastructure, run the right attribution models, and create a continuous feedback loop between what you observe in the customer journey and how you allocate budget and creative resources.
The map is not a one-time project. It is a continuously updated view of how real customers move through your funnel, and it requires connected data infrastructure across ad platforms, CRM, and analytics to stay accurate. As your product evolves, as your market shifts, and as your customer base grows, the journey map needs to evolve with it. Teams that treat it as a living asset rather than a static deliverable are the ones who extract the most strategic value from it over time.
For B2B SaaS teams ready to build this kind of data foundation, Cometly provides the attribution and analytics layer that makes accurate customer experience mapping possible. With multi-touch attribution, server-side tracking, Conversion API integrations, and direct connections to CRM and revenue data, Cometly gives marketing teams the complete, accurate view of the customer journey they need to make decisions with confidence. It connects every touchpoint to revenue, so you can see exactly where to invest, where to fix friction, and how to scale what is working.
The marketing teams that grow most efficiently are not the ones with the biggest budgets. They are the ones who understand their customers' journeys more accurately than their competitors do, and who use that understanding to put every dollar of spend where it will have the greatest impact on revenue.
If you are ready to build a customer experience map grounded in real attribution data rather than assumptions, Get your free demo and see how Cometly connects every touchpoint to revenue so your team can map, measure, and scale with precision.



