Most B2B SaaS marketing teams have a cost per lead number memorized. They know it by channel, by campaign, sometimes by individual ad creative. But ask those same teams what it costs to generate a qualified sales opportunity, and you'll often get a pause, a rough estimate, or a blank stare.
That gap is expensive. When you optimize for cheap leads without understanding what those leads cost at the pipeline stage, you end up filling your CRM with contacts that never convert and your SDRs with calendars full of unqualified calls. The volume looks good. The pipeline does not.
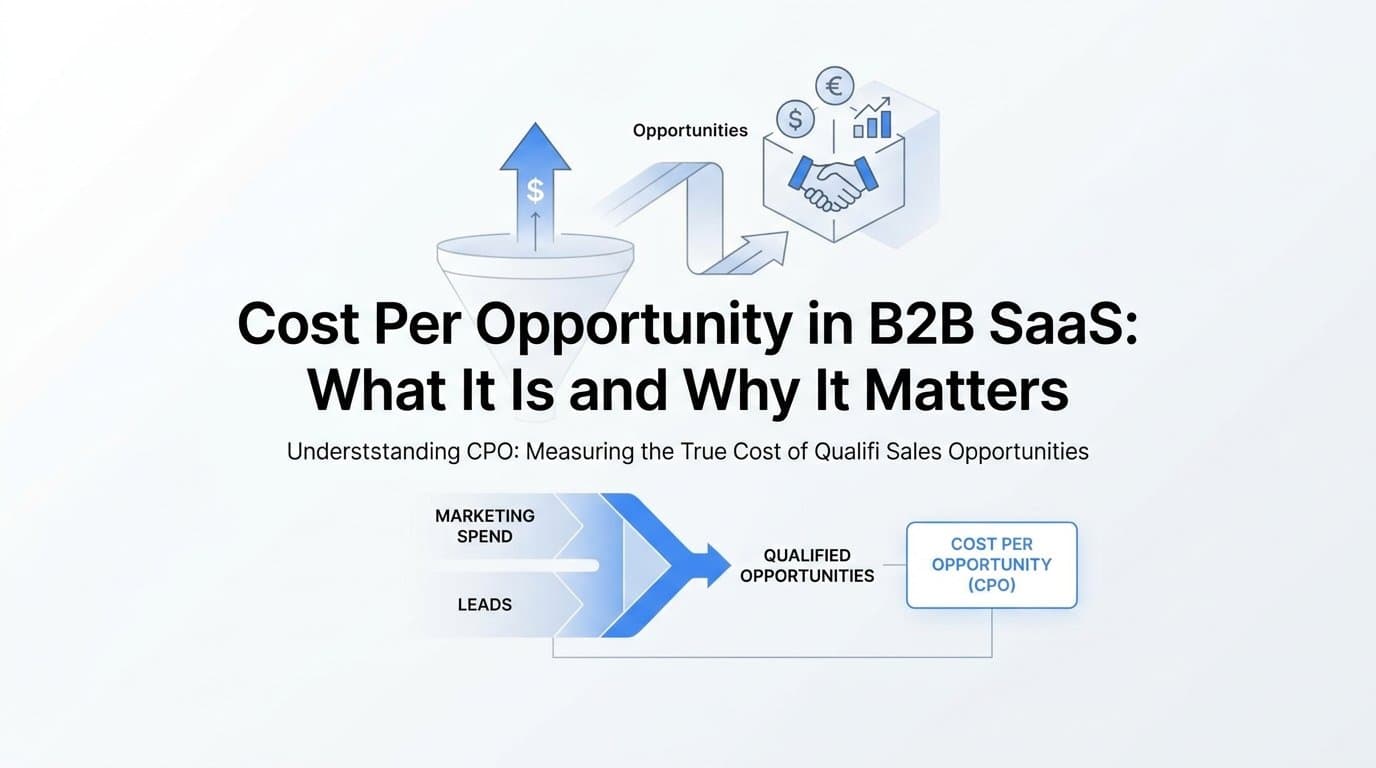
Cost per opportunity, or CPO, is the metric that closes this gap. It sits directly between marketing spend and revenue outcomes, giving growth leaders a real-time signal about pipeline generation efficiency that cost per lead cannot provide and that cost per acquisition arrives too late to act on. This article will walk you through exactly what CPO is, how to calculate it correctly, what drives it up or down, how to set meaningful targets, and how to use it to make smarter budget decisions across your channels.
The Metric That Sits Between Leads and Revenue
Cost per opportunity is defined as your total marketing and sales development spend divided by the number of qualified opportunities created in a given period. That sounds straightforward, but understanding where it sits relative to other efficiency metrics is what makes it genuinely useful.
Cost per lead (CPL) measures how much it costs to get someone to raise their hand. It lives at the top of the funnel and tells you about audience reach and initial interest. Cost per acquisition (CPA), or customer acquisition cost (CAC), measures how much it costs to close a deal. It lives at the bottom of the funnel and tells you about overall go-to-market efficiency. CPO lives in the middle, measuring how much it costs to move a lead through qualification and into your active sales pipeline.
For B2B SaaS teams, this middle layer is often the most actionable. Leads are a leading indicator that can be gamed by targeting broad, low-intent audiences. Closed revenue is a lagging indicator that, depending on your sales cycle length, may take three to twelve months to materialize after the initial marketing investment. CPO gives you a feedback loop that is fast enough to act on but meaningful enough to trust.
Here's where it gets interesting: a company with a three-month average sales cycle cannot wait until deals close to evaluate whether last quarter's campaign budget was well spent. CPO lets that team assess pipeline generation efficiency within weeks rather than quarters.
To make CPO reliable, you need a consistent definition of what counts as an opportunity. In B2B SaaS, an opportunity is typically a deal that has passed a formal qualification stage, such as BANT (Budget, Authority, Need, Timeline) or MEDDIC criteria, and has been entered into the sales pipeline by an account executive or SDR. It is not every inbound lead, not every demo request, and not every free trial signup. It is a deal that a qualified human has reviewed and determined is worth actively pursuing.
This definition must be consistent across your marketing and sales teams. If your AEs and SDRs apply different qualification standards depending on the week or the quota pressure they are under, your CPO figure will fluctuate for reasons that have nothing to do with marketing efficiency. Alignment on the opportunity definition is not a data hygiene detail. It is the foundation on which the entire metric rests.
How to Calculate Cost Per Opportunity
The core formula is simple: Total Marketing and SDR Spend divided by Number of Qualified Opportunities Created. The complexity is in deciding what goes into the numerator.
Your spend calculation should include all investment directly attributable to generating and qualifying pipeline. That means paid media spend across all channels, content production costs for demand generation assets, SDR salaries and commissions, sales development tools such as sequencing software and data enrichment platforms, and any agency or contractor fees tied to demand generation activity.
What to exclude is equally important. Marketing operations infrastructure, brand awareness campaigns with no direct demand generation intent, and general overhead costs should typically stay out of the CPO calculation. The goal is to capture the spend that is causally linked to opportunity creation, not every dollar that flows through the marketing budget.
To illustrate the calculation logic, consider a hypothetical scenario. Imagine a B2B SaaS company that spends a combined total across paid media, content production, SDR compensation, and sales tools in a given quarter. They generate a certain number of qualified opportunities in that same period. Dividing total spend by opportunities created gives them their CPO for the quarter. That number can then be compared to prior quarters, broken down by channel, or benchmarked against their internal target based on revenue goals.
The period you choose matters. Monthly CPO calculations can be noisy due to spend timing and pipeline lag. Quarterly calculations tend to smooth out those fluctuations and give a more reliable trend line. Whatever cadence you choose, apply it consistently so your comparisons are meaningful.
Now for the attribution challenge, which is where most teams run into trouble. When a prospect has interacted with a LinkedIn ad, a Google search result, a retargeting campaign, and a direct outbound sequence before becoming an opportunity, which channel gets credit for generating that opportunity? If you are using last-click attribution, the answer is whichever touchpoint they clicked immediately before converting. That is almost certainly not the most accurate answer.
Accurate channel-level CPO requires multi-touch attribution data. You need to know which touchpoints contributed to each opportunity across the full customer journey, not just the final one. Without that, you will systematically over-credit bottom-of-funnel channels like branded search and under-credit the upper-funnel channels that initiated the journey. Your CPO by channel will be distorted, and the budget decisions you make based on it will move spend in the wrong direction.
This is why connecting your ad platform data to your CRM pipeline events is not optional for teams that want to use CPO as a real decision-making tool. Blended CPO across all channels is a useful starting point, but channel-level CPO is where the actionable insights live.
What Drives CPO Up or Down in B2B SaaS
Understanding your CPO number is one thing. Understanding why it moves is another. Several demand-side and supply-side factors influence how much it costs to generate a qualified opportunity, and most of them are within your control to some degree.
On the demand side, your target audience segment has a significant effect. Enterprise buyers are harder to reach, require more touchpoints, and take longer to qualify, which drives CPO up. SMB audiences are often cheaper to reach but may have lower conversion rates into qualified pipeline. The competitive intensity of your paid media landscape also matters: in crowded categories where multiple vendors are bidding for the same keywords and audiences, CPCs rise and CPO follows.
Deal size plays a role too. Higher average contract value (ACV) deals typically justify higher CPO because the return on each opportunity is larger. A company selling seats at a few hundred dollars per month has a very different CPO tolerance than one selling enterprise contracts at six figures annually. This is why universal CPO benchmarks are rarely useful, a point we will return to in the next section.
On the supply side, your lead-to-opportunity conversion rate is one of the most powerful levers available. This rate reflects how well your inbound leads match your ideal customer profile, how quickly and effectively your SDRs follow up, and how strong your qualification process is. A channel with a high cost per lead can still produce a competitive CPO if its leads convert to opportunities at a high rate. Conversely, a channel generating very cheap leads may have a terrible CPO if those leads rarely pass qualification.
This is a critical insight for budget allocation. Many teams cut channels based on CPL without ever calculating what those channels actually cost at the opportunity stage. A LinkedIn campaign with a CPL three times higher than Google Search might generate opportunities at a fraction of the cost if its audience is more qualified and converts at a higher rate.
Attribution model choice also affects how CPO appears by channel, even when the underlying reality has not changed. Last-click attribution assigns all opportunity credit to the final touchpoint before conversion. Linear attribution distributes credit equally across all touchpoints. Time-decay models weight recent touchpoints more heavily. Each model tells a different story about which channels are generating opportunities efficiently. The model you choose should reflect how your buyers actually behave, not which model makes your favorite channel look best.
Benchmarking CPO and Setting Targets
One of the most common questions marketing leaders ask is: "What should our CPO be?" The honest answer is that there is no universal benchmark that applies across B2B SaaS. CPO varies too widely based on ACV, sales cycle length, market segment, and go-to-market motion for any external number to be reliably useful.
A company selling enterprise security software with a nine-month sales cycle and a high six-figure ACV will naturally have a much higher CPO than a company selling a project management tool to small businesses at a few hundred dollars per year. Comparing those two CPO figures tells you almost nothing meaningful about efficiency.
What is useful is building your CPO target from your own revenue model. The framework works like this. Start with your revenue goal for the period. Apply your pipeline coverage ratio, which is the multiple of pipeline you need relative to your revenue target. B2B SaaS teams commonly plan for three to five times pipeline coverage, meaning if you need to close a million dollars in new ARR, you need three to five million dollars in qualified pipeline. Divide that pipeline target by your average deal size to get the number of opportunities you need to create. Then divide your available demand generation budget by that opportunity count to get your maximum allowable CPO.
This approach grounds your CPO target in your specific business model rather than an industry average that may not apply to your situation. It also creates a direct link between marketing efficiency and revenue planning, which makes CPO a metric that resonates with CFOs and revenue leaders, not just marketing teams.
Once you have a target, tracking CPO as a trend over time becomes more valuable than any single snapshot. Is your CPO improving or degrading as you scale spend? Are you generating more opportunities per dollar invested as your brand builds awareness and your content matures? Or are you experiencing diminishing returns as you exhaust your highest-intent audience segments? These trend questions are where CPO becomes a strategic planning tool rather than just a reporting metric.
Set a cadence for reviewing CPO trends, ideally quarterly with monthly check-ins, and track it alongside pipeline coverage and opportunity-to-close rates to get a complete picture of go-to-market efficiency.
Using CPO to Make Smarter Channel and Budget Decisions
The real power of CPO shows up when you calculate it by channel. This is where the metric moves from a reporting exercise to a budget reallocation tool.
Consider two channels side by side. Channel A generates leads at a low cost per lead but has a poor lead-to-opportunity conversion rate. Channel B generates leads at a higher cost per lead but its audience is well-qualified and converts to opportunities at a much higher rate. When you look at CPL, Channel A looks more efficient. When you look at CPO, Channel B may be dramatically more efficient. Budget decisions made on CPL alone would move spend toward Channel A and away from the channel that is actually generating pipeline more effectively.
This scenario plays out constantly in B2B SaaS marketing. Display advertising and broad social targeting often produce cheap leads and expensive opportunities. Intent-based search, targeted LinkedIn campaigns aimed at specific job titles and company sizes, and high-quality content that attracts in-market buyers often produce more expensive leads but far more efficient pipeline.
Comparing CPO by channel also reveals which campaigns and ad sets within a channel are driving the most efficient pipeline creation. You might find that one campaign targeting a specific persona generates opportunities at a fraction of the cost of another campaign targeting a broader audience, even within the same channel. That level of granularity is what allows you to optimize spend rather than just reallocate it between channels.
This is where accurate conversion tracking becomes non-negotiable. To calculate CPO at the channel and campaign level, you need event data flowing reliably from your CRM into your attribution system. When a lead becomes an opportunity in your CRM, that event needs to be captured, attributed to the touchpoints that influenced it, and connected back to the ad spend that drove those touchpoints.
Without server-side tracking and proper CRM integration, this connection breaks down. Browser-based pixel tracking misses a growing share of events due to ad blockers, cookie restrictions, and cross-device journeys. When those touchpoints are lost, your channel-level CPO calculations become unreliable, and the budget decisions you make based on them carry more risk than you realize.
Server-side conversion tracking fills these gaps by capturing events directly from your server rather than relying on browser-side signals. Combined with first-party data enrichment, it gives your attribution system a more complete view of the customer journey and produces more accurate CPO figures at every level of granularity.
Connecting CPO to Your Full Attribution Stack
CPO is only as accurate as the attribution data feeding it. This is not a caveat to mention in passing. It is the central operational challenge for any team trying to use CPO as a serious decision-making metric.
If touchpoints are missed because pixel-based tracking is blocked or dropped, your attribution system will under-count the contributions of certain channels and over-credit others. If touchpoints are duplicated because you are tracking the same event through multiple methods without deduplication, your CPO figures will be artificially deflated. If CRM opportunity events are not properly connected to the ad interactions that preceded them, you will only ever have a blended CPO across all channels, never the channel-level insight that makes CPO actionable.
A full-funnel attribution platform solves this by creating a single connected data layer that spans your ad platforms, your website, and your CRM. When a prospect clicks a LinkedIn ad, visits your pricing page, downloads a piece of content, and then responds to an SDR sequence before becoming an opportunity, each of those touchpoints is captured, stored, and associated with that specific deal. The opportunity creation event in your CRM triggers an attribution lookup that connects the deal to the marketing interactions that influenced it, and the resulting CPO figure reflects the actual cost of generating that pipeline.
This is exactly what Cometly is built to do for B2B SaaS teams. By connecting your ad platforms, CRM, and website data into a single source of truth, Cometly makes it possible to calculate CPO by channel, by campaign, and by individual ad creative without manual spreadsheet work or fragile data exports. You can see which touchpoints contributed to each opportunity, how much was spent on those touchpoints, and what the resulting CPO is at every level of your campaign structure.
Cometly's server-side conversion tracking ensures that first-party event data flows accurately from your CRM back to your attribution system, filling in the gaps that browser-based tracking leaves behind. Its AI-driven insights surface which campaigns and channels are generating the most efficient pipeline, so you can act on that information quickly rather than discovering it weeks later in a manual analysis.
For teams managing budget across multiple paid channels while trying to hit pipeline coverage targets, this kind of real-time visibility into CPO by channel is not a nice-to-have. It is the infrastructure that makes data-driven budget decisions possible in the first place.
Putting It All Together
Cost per opportunity is one of the most actionable metrics a B2B SaaS marketing team can track. It sits at the exact intersection of spend efficiency and pipeline creation, giving you a feedback loop that is faster than waiting for deals to close and more meaningful than optimizing for cheap leads.
The key principles to carry forward are straightforward. Define your opportunity clearly and consistently across marketing and sales before you start tracking. Include all relevant spend in your calculation, paid media, content, SDR costs, and tools, while excluding costs that are not causally linked to pipeline creation. Use multi-touch attribution to understand CPO by channel rather than relying on blended figures that obscure where your pipeline is actually coming from. And set your CPO target based on your own revenue model, working backward from pipeline coverage needs and deal economics, rather than chasing external benchmarks that may not reflect your business.
When you track CPO trends over time and use channel-level CPO to guide budget reallocation, you stop optimizing for metrics that feel good and start optimizing for the ones that actually drive revenue.
If you want to track CPO accurately without building a custom data infrastructure, Cometly connects your ad data to pipeline outcomes in real time, giving you the attribution clarity you need to make every budget decision with confidence. Get your free demo today and start seeing exactly which touchpoints are driving your pipeline and at what cost.