

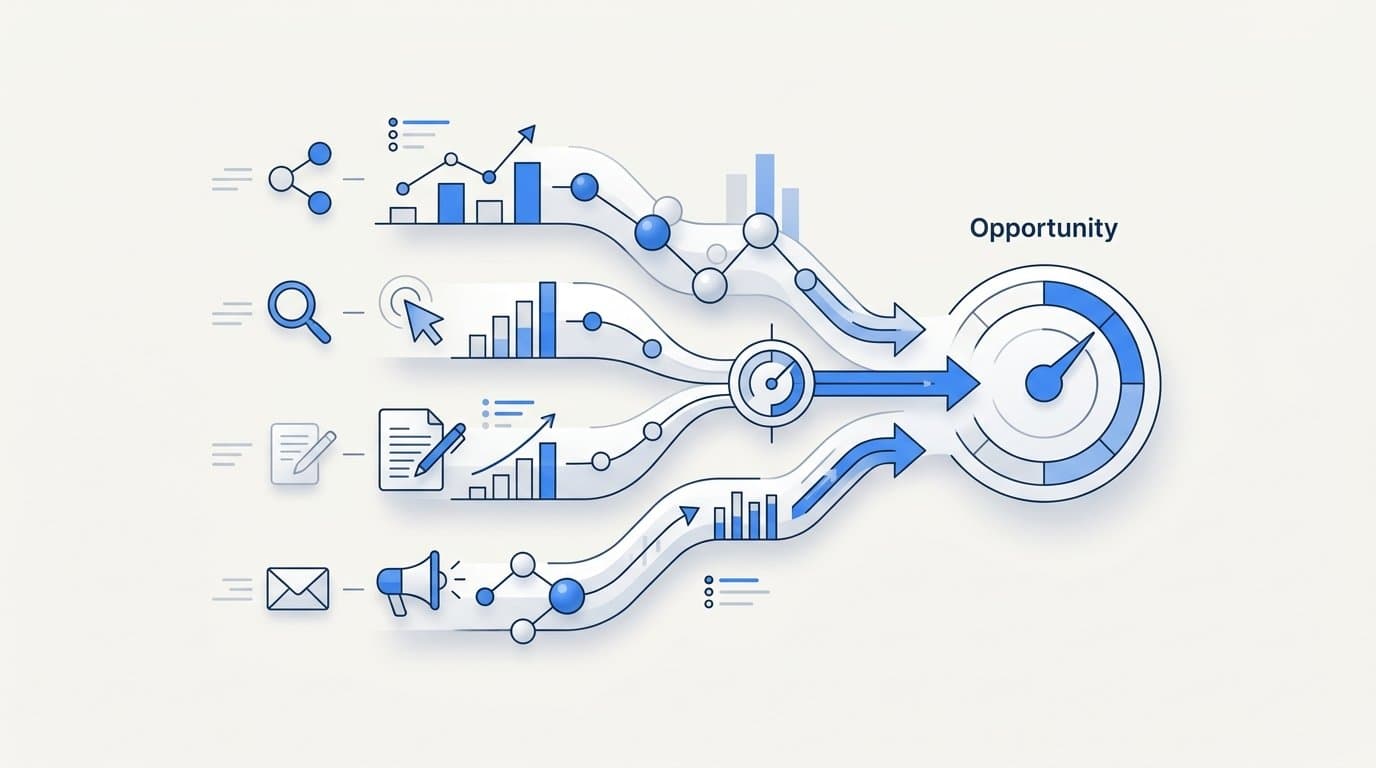
Most B2B SaaS marketing teams can tell you exactly how much they paid for their last thousand leads. Ask them what those leads actually cost in terms of qualified pipeline, and the conversation gets quieter. That gap, between cost per lead and cost per opportunity, is where budget decisions go wrong.
Cost per lead (CPL) is a useful starting point, but it treats every form fill as equally valuable. In reality, a lead from a high-intent paid search campaign and a lead from a top-of-funnel content download are not the same thing. They convert at different rates, require different levels of sales effort, and contribute very differently to your pipeline. When you optimize for CPL, you are optimizing for volume, not revenue potential.
Cost per opportunity (CPO) by channel changes the question. Instead of asking how cheaply you can acquire a contact, you are asking how much it costs to generate a qualified sales opportunity from each channel. That is a revenue-stage metric, and it gives marketing and sales a shared language for evaluating channel performance against actual business outcomes.
This guide is built for growth leaders and marketing teams who are ready to move past vanity metrics and make smarter channel investment decisions. You will learn how to calculate CPO by channel, why attribution models matter more than most teams realize, how to interpret results across different channel types, and how to turn CPO data into confident budget decisions.
Why Cost Per Lead Leaves Budget Decisions Half-Finished
There is nothing wrong with tracking cost per lead as a monitoring metric. The problem starts when teams use CPL as their primary optimization signal for channel investment. At that point, a critical blind spot opens up.
CPL treats all leads as equivalent units. A lead from a branded paid search campaign and a lead from a broad awareness ad on Meta both count as one lead in your CPL calculation. But their downstream conversion rates to qualified opportunities can differ dramatically. A channel that looks efficient on a CPL basis may be generating contacts that never make it to your pipeline, while a channel with a higher CPL might be sending you exactly the buyers your sales team wants to talk to.
Think of it this way: if your paid search channel generates leads at twice the cost of your content syndication channel, CPL would suggest you should shift budget toward content syndication. But if paid search leads convert to opportunities at four times the rate, the actual cost per opportunity from paid search is lower. You would be making the wrong call based on incomplete data.
This is not a hypothetical edge case. It is a common pattern in B2B SaaS marketing, where channel audiences vary significantly in job title, buying intent, and organizational fit. A channel reaching senior decision-makers at companies that match your ICP will almost always outperform a channel reaching a broader, less qualified audience, even if the latter looks cheaper at the lead stage.
Cost per opportunity connects ad spend to a revenue-stage outcome. It forces the question: did this channel's investment actually produce pipeline? That shift in framing creates alignment between marketing and sales, because both teams are now evaluating channel performance against the same downstream metric rather than debating whether a lead was "good" after the fact.
For growth leaders, CPO by channel is also a more defensible number in budget conversations. Saying "this channel generates pipeline at X cost per opportunity" is a fundamentally stronger argument than "this channel has a good CPL." It ties marketing investment directly to the revenue model, which is the conversation every CFO and CEO wants to have.
How to Calculate Cost Per Opportunity by Channel
The math behind cost per opportunity is straightforward. The complexity lives in the setup that makes the math meaningful.
The core formula is: CPO = Total Channel Spend / Number of Opportunities Attributed to That Channel. For a given time period, you take everything you spent on a channel, including media spend, platform fees, and any directly attributable creative or agency costs, and divide it by the number of qualified sales opportunities that channel generated.
Before you run that calculation, three things need to be clearly defined.
Opportunity definition: What counts as an opportunity in your organization? This varies more than most teams expect. Some companies create an opportunity when a lead books a demo. Others require a discovery call to be completed. Others use a specific CRM stage tied to a qualification framework like BANT or MEDDIC. Whatever your definition is, it needs to be consistent across the entire team and applied uniformly across all channels. If your sales team creates opportunities differently depending on how a lead came in, your CPO data will be unreliable from the start.
Time period alignment: Channel spend and opportunity creation need to be measured over the same window, but you also need to account for the lag between a lead entering your funnel and becoming a qualified opportunity. In B2B SaaS, that lag can range from a few days to several weeks depending on your sales cycle. A common approach is to use a rolling 30 or 60-day attribution window that accounts for the typical lead-to-opportunity conversion timeline in your business.
Attribution model selection: This is where CPO calculations get genuinely complex, and it deserves its own section later in this article. But at the calculation stage, the key point is that you must choose an attribution model before you start dividing spend by opportunities. If an opportunity involved touchpoints across paid search, LinkedIn, and organic content, which channel gets credit for that opportunity? How you answer that question determines what CPO numbers you see for each channel.
Once those foundations are in place, the calculation itself is simple to run. Pull your channel spend from your ad platforms. Pull your opportunity creation data from your CRM, filtered by the attribution source assigned to each opportunity. Divide. Repeat across every channel you want to compare.
The real challenge is not the arithmetic. It is building the data infrastructure that connects ad platform spend data to CRM opportunity records accurately and consistently. That connection is where most B2B SaaS teams hit friction, and it is why attribution platforms exist.
Channel-by-Channel Breakdown: What to Expect and Why Results Vary
CPO varies significantly across channel types, and understanding why helps you set realistic benchmarks and avoid drawing the wrong conclusions from your data.
Paid Search: Channels like Google Ads typically produce higher-intent opportunities because users are actively searching for solutions. Someone searching for "B2B SaaS project management software" is further along in the buying process than someone who saw a display ad while reading industry news. That intent advantage tends to show up in conversion rates from lead to opportunity. The tradeoff is that competitive keyword auctions drive up cost per click, which means paid search often carries a higher CPO than other channels in absolute terms. But when you factor in win rate and deal size downstream, it frequently justifies that cost.
Paid Social (LinkedIn, Meta, Instagram): Paid social channels can generate strong opportunity volume, particularly LinkedIn for B2B SaaS companies targeting specific job titles or industries. The audience targeting capabilities are powerful, but most paid social traffic enters the funnel at an earlier stage of intent. That means more nurturing touchpoints are typically required before a lead converts to a qualified opportunity. CPO on paid social tends to be lower per lead but can climb when you factor in the full nurturing sequence needed to move contacts to pipeline. Attribution also gets complicated because paid social often plays an assist role rather than a closing role in the buying journey.
Organic Search and Content: Content-driven channels, including SEO, blog traffic, and gated resources, tend to produce lower CPO over time once the content asset is established. The challenge is attribution. A blog post that introduced your brand six months ago may not receive credit for an opportunity that closed after the prospect also attended a webinar and clicked a retargeting ad. Without a proper attribution window and multi-touch tracking, organic channels are systematically undercredited. Their CPO appears higher than it actually is because the contribution to opportunity creation is invisible in simpler measurement setups.
Events and Webinars: These channels often generate high-quality opportunities because they involve active engagement and self-selection. Someone who registers for and attends a live webinar is demonstrating meaningful intent. The CPO calculation for events needs to include all direct costs: platform fees, speaker time, promotional spend, and production. When those costs are fully loaded, event CPO can be high, but the quality of opportunities generated often makes the investment worthwhile.
Referral and Partner Channels: Referral-driven opportunities frequently have the lowest CPO because the acquisition cost is minimal and the trust signal is built in. These channels are worth tracking separately to understand their true contribution to pipeline, even if they are harder to scale predictably.
The Attribution Problem That Distorts Your CPO Numbers
Here is where most CPO analyses go wrong. The formula is simple, but the attribution model you apply determines everything about what the numbers actually mean.
Last-click attribution assigns 100% of the credit for an opportunity to the final touchpoint before conversion. This is still the default in many CRM setups and ad platforms. For CPO calculations, last-click systematically undervalues upper-funnel channels. If a prospect first discovered your product through a LinkedIn ad, read three blog posts, attended a webinar, and then clicked a branded search ad before booking a demo, last-click gives all the credit to paid search. LinkedIn, content, and the webinar show zero contribution to that opportunity. Their CPO appears inflated because they are generating no attributed opportunities despite doing real work in the buying journey.
First-touch attribution has the mirror problem. It assigns all credit to the channel that initiated the relationship, ignoring everything that happened between first contact and opportunity creation. This overstates the value of awareness channels and undercredits the conversion-stage touchpoints that actually pushed the lead to engage with sales. A retargeting campaign that re-engaged a cold prospect and drove them to book a demo gets no credit under first-touch, even though it was the direct trigger for opportunity creation.
Multi-touch attribution models distribute credit across all touchpoints in the buying journey. Common approaches include linear attribution, which splits credit equally across all touchpoints; time-decay attribution, which gives more credit to touchpoints closer to conversion; and position-based models, which give weighted credit to both the first and last touch while distributing the remainder across middle touches.
For B2B SaaS companies with complex, multi-stakeholder buying journeys, multi-touch attribution produces a more accurate CPO by channel because it reflects how channels actually work together. Paid social might not close many deals on its own, but if it consistently appears early in the journeys of your best opportunities, that contribution has real value and should be reflected in its CPO calculation.
The practical implication is that you should choose your attribution model deliberately, document why you chose it, and apply it consistently before comparing CPO across channels. Changing your attribution model mid-analysis will produce results that look like channel performance changes when they are actually just measurement changes.
Data-driven attribution models, which use algorithmic analysis of your actual conversion data to assign credit weights, are increasingly accessible through modern attribution platforms. For teams with sufficient conversion volume, these models tend to produce the most accurate CPO figures because they are calibrated to your specific buying journey rather than a generic framework.
Turning CPO Data Into Smarter Channel Investment Decisions
Having accurate CPO numbers by channel is only useful if you act on them. Here is how to translate CPO data into budget decisions that actually improve pipeline efficiency.
Benchmark CPO against downstream revenue metrics: A channel's CPO does not exist in isolation. A channel with a high CPO might still be your best investment if the opportunities it generates have a higher average contract value or a better win rate. The relevant question is not just "how much does this channel cost per opportunity?" but "how much pipeline value does each dollar of spend generate?" Combining CPO with average deal size and win rate gives you a cost per dollar of pipeline metric that allows direct comparison across channels regardless of deal size differences.
Track CPO trends over time, not just point-in-time snapshots: A single CPO figure tells you where you are. A trend tells you where you are going. A channel with a rising CPO might be hitting audience saturation or facing increased competition. A channel with a declining CPO might be gaining efficiency as your targeting improves or your content assets compound. Monthly CPO tracking by channel surfaces these trends early, giving you time to adjust before a problem becomes a budget crisis.
Combine CPO with pipeline velocity: Two channels might generate opportunities at similar cost, but if one produces opportunities that close in 30 days and the other produces opportunities that stall in the pipeline for six months, they are not equivalent investments. Pipeline velocity measures how quickly opportunities move through your funnel. Prioritizing channels that generate fast-moving, high-quality opportunities over channels that generate cheap but slow opportunities can meaningfully improve your revenue efficiency.
Use CPO to set channel-level budget floors and ceilings: Once you have reliable CPO benchmarks, you can set rational budget parameters. If your business model supports an opportunity acquisition cost of up to a certain threshold, channels consistently below that threshold deserve more investment. Channels consistently above it need either optimization or reallocation. This turns CPO from a reporting metric into a budget governance tool.
How Cometly Connects Ad Spend to Pipeline Opportunities
The biggest practical barrier to tracking CPO by channel is the data gap between your ad platforms and your CRM. Ad platforms know what they spent and what they clicked. Your CRM knows what became an opportunity. Getting those two data sets to talk to each other accurately and automatically is where most teams get stuck, and where Cometly was built to help.
Cometly tracks every touchpoint from the first ad click through to CRM opportunity creation, giving your marketing team a single source of truth for CPO by channel. Instead of manually exporting data from five ad platforms and cross-referencing it against CRM exports in a spreadsheet, you get a unified view of channel spend and pipeline outcomes in one place. That eliminates the reconciliation work and the errors that come with it.
Accurate opportunity attribution depends on capturing conversion events reliably. Browser-based pixel tracking has become increasingly unreliable due to ad blockers, iOS privacy updates, and the ongoing shift away from third-party cookies. Cometly's server-side conversion tracking and Conversion API integration ensure that opportunity creation events are captured and attributed correctly even when traditional pixel tracking would lose the data. This matters because undercounted opportunity events lead to overstated CPO, which can cause you to underinvest in channels that are actually performing well.
Beyond data capture, Cometly's AI-driven recommendations surface which channels and campaigns are generating the lowest CPO and highest-quality pipeline. Rather than manually analyzing trends across dozens of campaigns, you get proactive insights that identify where to scale and where to pull back. That moves CPO from a metric you report on to a signal that actively drives budget decisions.
For B2B SaaS teams that want to connect every ad dollar to pipeline outcomes, Cometly provides the infrastructure and the intelligence to do it without building a custom data stack from scratch.
Putting It All Together
Cost per opportunity by channel is one of the most actionable metrics a B2B SaaS marketing team can track. It ties spend directly to pipeline, not just activity. It creates a shared language between marketing and sales. And it gives growth leaders the data they need to make channel investment decisions with confidence rather than intuition.
The path to reliable CPO data runs through four steps. First, define what counts as an opportunity consistently across your organization. Second, choose an attribution model that reflects the full buying journey your prospects actually take. Third, calculate CPO per channel over consistent time periods, accounting for the lag between lead acquisition and opportunity creation. Fourth, use those numbers alongside deal size, win rate, and pipeline velocity to guide where you invest and where you pull back.
None of this requires perfect data from day one. Start with the channels where you have the clearest spend and attribution data, build your benchmarks, and expand from there. The teams that consistently win on channel efficiency are not the ones with the biggest budgets. They are the ones who know exactly what each dollar is producing at the pipeline level.
If you are ready to stop estimating and start measuring CPO by channel with real data, Get your free demo and see how Cometly automates the entire process, from tracking every touchpoint to surfacing pipeline attribution insights in real time.



