

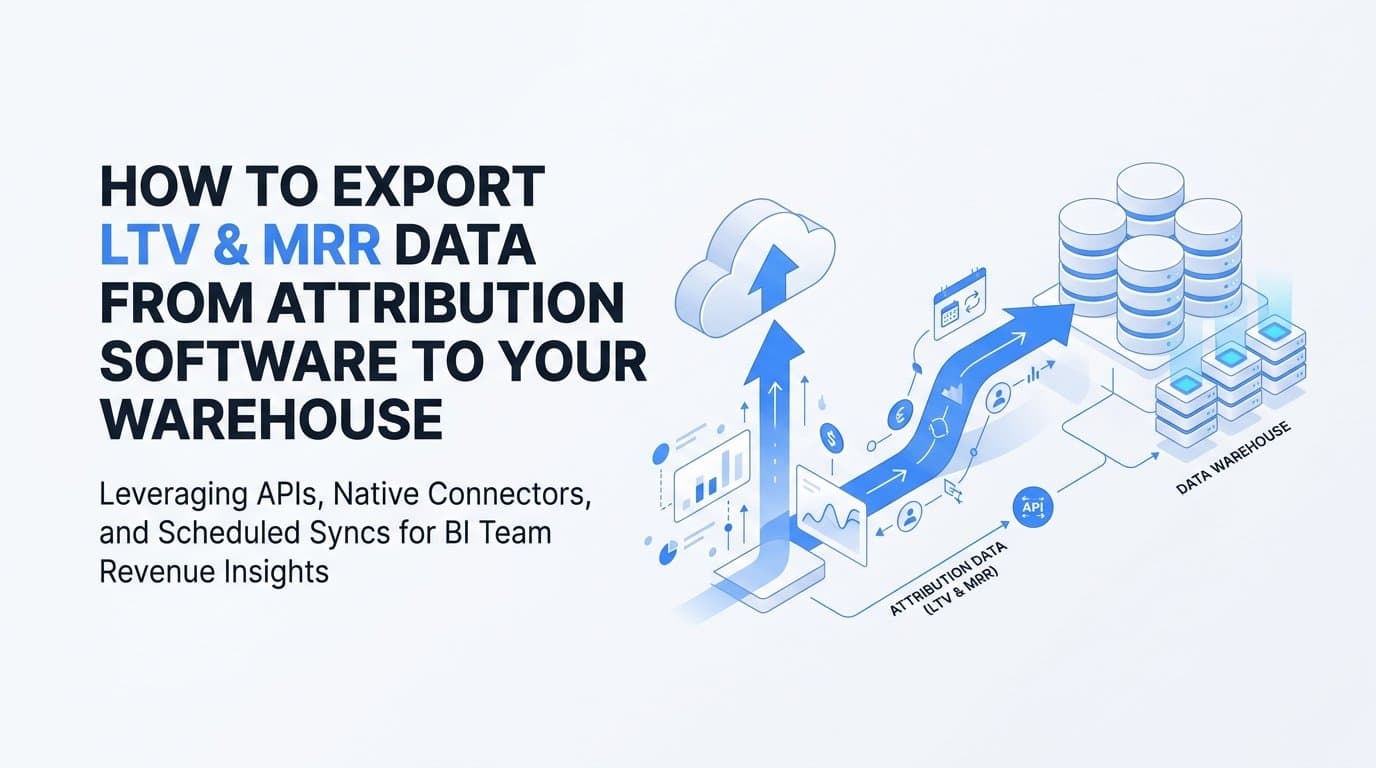
You export LTV and MRR data from attribution software to your data warehouse by connecting your attribution platform's API or native export feature to your warehouse destination, mapping revenue fields to your schema, and scheduling recurring syncs. The result is a reliable data pipeline that lets your BI team answer the question that actually matters: which ad channels produce the highest-value customers, not just the most conversions.
Cometly is a strong starting point for B2B SaaS teams because it natively connects Stripe revenue data with ad attribution. That means LTV and MRR figures already carry channel-level context before they ever reach your warehouse, reducing the number of manual joins your data team has to build.
This guide walks through the exact steps to get that data flowing reliably, whether you are using Cometly, Segment, or another attribution tool. Before you begin, confirm three things: write access to your warehouse (Snowflake, BigQuery, Redshift, or similar), API credentials from your attribution platform, and a clear definition of which revenue metrics you need. Are you tracking LTV at the customer level, MRR at the subscription level, or both joined to acquisition source? Getting that definition locked in before you touch a single API endpoint will save you significant rework later.
What LTV and MRR Fields Does Attribution Software Typically Export?
Attribution platforms vary in how they expose revenue data, so it helps to know what to look for before you start building. Common field names include lifetime_value, customer_ltv, mrr, monthly_recurring_revenue, subscription_amount, and arr. Some tools also expose MRR movement events: new MRR, expansion MRR, contraction MRR, and churned MRR.
The key distinction is whether the platform exports raw payment events or pre-aggregated metrics. Raw events give you the flexibility to calculate LTV your own way in the warehouse. Pre-aggregated metrics are faster to work with but may not match your internal definition of LTV.
Which Data Warehouses Are Most Commonly Used With Attribution Platforms?
Snowflake, BigQuery, and Redshift are the most common destinations for B2B SaaS teams. Most modern attribution platforms, including Cometly, have documented API endpoints that work with all three. Some platforms also offer native connectors specifically for BigQuery or Snowflake, which simplifies authentication and schema management significantly.
Step 1: Identify the Revenue Fields Your Attribution Tool Exposes
Before writing a single line of pipeline code, spend time in your attribution platform's data model documentation. You need to know exactly where LTV and MRR live and in what form they are stored.
In Cometly, revenue data synced from Stripe surfaces at both the customer level and the campaign level. That means you can pull a record that shows a specific customer's current MRR alongside the original ad source and campaign that acquired them. This is the joined view most attribution tools require you to build yourself in the warehouse.
For other tools, check whether the revenue data is stored as raw payment events or as aggregated summaries. Raw events give you the most flexibility. If your tool only exports last-touch revenue summaries, you may not have enough event history to compute true LTV, and you will need to supplement the export with data from your billing system directly.
Confirm the exact field names your tool uses. Common labels include:
lifetime_value or customer_ltv: Total revenue attributed to a customer since acquisition.
mrr or monthly_recurring_revenue: The customer's current monthly subscription value.
subscription_amount: The recurring charge amount, often at the subscription or plan level.
arr: Annual recurring revenue, sometimes exposed as an alternative to MRR.
A common pitfall at this stage is discovering that your attribution tool only exposes revenue summaries tied to the last-touch channel. If you need first-touch or multi-touch LTV analysis, confirm that the platform supports multi-touch attribution models before export. Cometly supports first touch, last touch, and linear attribution, so you can choose the model that matches your team's reporting standard before the data leaves the platform.
Write down every field name, its data type, and its granularity (customer-level, subscription-level, or campaign-level). This list becomes your schema reference for Step 4.
Step 2: Choose Your Export Method
There are three main paths for moving attribution revenue data into your warehouse, and the right one depends on your latency requirements, engineering resources, and what your attribution platform natively supports.
REST API pull: The most common approach. Your pipeline calls the attribution platform's API on a schedule, pulls records updated since the last sync, and loads them into a staging table. Cometly's API lets you pull attributed revenue records with campaign and channel metadata already attached, so the warehouse join is straightforward. Most attribution APIs structure revenue exports as endpoints like /v1/revenue, /v1/customers, or /v1/conversions with a revenue_type filter.
Native warehouse connector: Some platforms offer direct connectors for Snowflake, BigQuery, or Redshift that handle authentication, scheduling, and schema management automatically. If your attribution vendor has a published connector for your warehouse, use it. It eliminates significant custom engineering work and reduces the surface area for bugs.
Webhooks: Event-driven pushes that fire when a revenue event occurs, such as a new subscription, an upgrade, or a cancellation. Webhooks work well for near-real-time MRR updates but require you to stand up a receiver endpoint in your infrastructure to accept and store the events. Use webhooks only when real-time latency is a hard requirement, such as when MRR dashboards feed active campaign decisions.
If your tool lacks a native connector, an ETL layer such as Fivetran, Airbyte, or dbt Cloud can orchestrate the API pull for you. These tools handle pagination, incremental load logic, and schema evolution, which reduces the amount of custom code your team needs to maintain.
The decision rule is straightforward: use a native connector if your vendor offers one, use an API pull with an ETL layer if not, and reserve webhooks for situations where daily or hourly syncs are genuinely too slow for your use case.
Step 3: Authenticate and Configure the API Connection
Once you have chosen your export method, the next step is getting authenticated access to the revenue data. This is where many pipelines stall, usually because of missing permissions on the API token.
Go to your attribution platform's settings panel and generate an API key or OAuth token. When configuring the token's scope, explicitly include permissions for revenue data, billing records, or conversions, depending on how your platform labels these resources. A token with only marketing or campaign read access will return empty or incomplete revenue responses, which is the most common authentication error teams hit at this stage.
Store the credentials in your warehouse or ETL tool's secrets manager. Never embed API keys in plain text inside pipeline code or version-controlled configuration files. Most modern ETL tools and warehouse platforms have built-in secrets management that handles this securely.
Set the base endpoint for your revenue pull. Common patterns include:
/v1/revenue: Direct revenue records with attribution metadata.
/v1/customers: Customer-level records that include LTV and acquisition source fields.
/v1/conversions?revenue_type=subscription: Conversion events filtered to subscription revenue, useful for isolating MRR-generating events.
Before running a full historical pull, test the connection with a small date-range request covering the last seven days. Confirm that the response includes both revenue fields (LTV, MRR, payment amount) and attribution dimensions (campaign_id, channel, source, attribution_model). If attribution dimensions are missing, check whether they require a separate query parameter to include.
Document the API's rate limits before building your pipeline schedule. Most attribution platforms publish requests-per-minute or requests-per-hour limits. Set your pipeline's request intervals to stay comfortably below these limits, especially for historical backfills that touch large date ranges.
How Often Should I Sync Attribution Revenue Data to My Warehouse?
Daily syncs are sufficient for LTV trend analysis and cohort reporting. Hourly syncs make sense for MRR dashboards that inform active campaign decisions. Near-real-time via webhooks is only necessary when your team is making intraday budget decisions based on MRR movement.
Step 4: Map Attribution Revenue Fields to Your Warehouse Schema
With authentication working and a test response confirmed, you can now design the tables that will hold this data in your warehouse. A two-layer approach works best: a staging table that mirrors the raw API response, and a transformation layer that applies business logic.
The staging table should be a direct copy of the API response with minimal transformation. This gives you a recovery point if your transformation logic changes later, and it makes debugging much easier when you need to trace a discrepancy back to the source.
Your target analytical schema should include at minimum:
customer_id: The unique identifier used to join across systems.
acquisition_source and acquisition_campaign: The channel and campaign that originally acquired the customer.
attribution_model: The model used (first touch, last touch, linear) so analysts know how to interpret the source assignment.
first_payment_date: Used to define cohorts for LTV analysis.
ltv_to_date: Cumulative revenue from this customer since acquisition.
current_mrr: The customer's current monthly recurring revenue.
subscription_status: Active, churned, paused, or similar, depending on your billing system's terminology.
If your attribution data and billing data come from separate systems, for example Stripe directly plus a Cometly attribution layer, join them on customer_id or email at the transformation layer. Cometly's Stripe integration means this join is often already done inside the platform, which reduces the complexity of your warehouse transformation significantly.
For LTV, decide whether you are storing a point-in-time snapshot or maintaining a running cumulative sum of payment events. Document this choice explicitly in your data catalog or dbt model description so every team in the organization uses the same LTV definition.
Add a data_exported_at timestamp column to every record. This lets you track exactly when each record was pulled and makes it straightforward to detect gaps in sync history.
One operational detail that often gets overlooked: currency normalization. If you serve international customers, standardize all revenue fields to a single currency before loading into the analytical layer. Mixing currencies in an LTV column produces meaningless aggregates.
Can I Export Attribution Data to BigQuery or Snowflake Directly?
Yes. Most attribution platforms, including Cometly, support API access that works with BigQuery, Snowflake, and Redshift. Some vendors also offer native connectors for these warehouses that handle scheduling and schema management automatically. Check your attribution platform's integrations page before building a custom pipeline.
Step 5: Schedule Recurring Syncs and Validate Data Quality
A pipeline that runs once is not a pipeline. The value of this integration comes from reliable, recurring data flow that keeps your warehouse current with what your attribution platform knows.
Use incremental loads rather than full refreshes. An incremental load pulls only records that have been created or updated since the last successful sync, typically using an updated_at timestamp as the filter. Full refreshes on large revenue datasets consume unnecessary API quota and warehouse compute, and they become increasingly slow as your customer base grows.
Set your sync frequency based on actual business need. Daily is sufficient for LTV cohort analysis and channel-level reporting. If your team is actively managing campaigns based on MRR movement, hourly syncs or webhook-based updates may be warranted.
After each sync, run two validation checks:
Row-count check: Compare the number of customer records in your warehouse against the count shown in your attribution platform's UI. A significant discrepancy signals a pagination error, a filter misconfiguration, or a sync gap.
Revenue-sum reconciliation: Compare the total LTV or MRR sum in your warehouse against the reported total in your attribution platform. For Cometly users, cross-reference the pipeline attribution view in the platform against your warehouse aggregate as a direct sanity check. A tolerance of under one percent variance is a reasonable target for most teams.
Set up automated alerts for sync failures and anomalies. A sudden drop in MRR record counts after a previously stable sync almost always indicates an API authentication expiry rather than actual customer churn. Catching this quickly prevents your dashboards from showing misleading drops that trigger unnecessary alarm across the business.
Store the results of each validation check in a pipeline audit table in your warehouse. This creates a history of sync health that makes it much easier to diagnose issues when they arise weeks later.
How Do I Calculate CAC-to-LTV by Channel After Exporting Attribution Data?
After your attribution revenue data is in the warehouse, calculate CAC-to-LTV by channel by dividing total ad spend per channel (from your ad platform data) by the average LTV of customers acquired through that channel. Join your ad spend table to your attribution-revenue table on acquisition_source or acquisition_campaign, then group by channel and compute the ratio. This metric tells you which channels are producing customers worth scaling toward.
Step 6: Build the Attribution-Revenue Join for Analysis
The previous steps get data into your warehouse. This step turns that data into the analytical asset your growth team actually uses to make decisions.
The goal of the final analytical table is to answer one core question: which channels and campaigns produce customers with the highest LTV and the strongest MRR growth over time? Every column you add should serve that question.
Start by joining your attribution source table (campaign, channel, first touch, last touch, attribution model) to your revenue table on customer_id. If you are using Cometly, much of this join is already reflected in the attributed revenue records you pulled in earlier steps, which means your transformation logic is simpler than it would be with a tool that separates attribution and revenue data entirely.
Build a cohort-based LTV view by grouping customers by their acquisition month and acquisition channel, then tracking cumulative revenue at defined intervals: 3-month LTV, 6-month LTV, and 12-month LTV. This cohort structure is essential for comparing channels fairly, since a channel that acquired customers six months ago has had more time to accumulate revenue than one that started last month.
Add MRR movement columns to the table:
new_mrr: MRR from customers who converted this period, segmented by acquisition source.
expansion_mrr: MRR added from existing customers who upgraded, by original acquisition source.
contraction_mrr: MRR lost from downgrades, by original acquisition source.
churned_mrr: MRR lost from cancellations, by original acquisition source.
These MRR movement columns, segmented by acquisition source, reveal something that a simple LTV number cannot: whether customers from a particular channel tend to expand, stay flat, or churn. A channel that drives high initial MRR but also drives high churn MRR may look attractive at first glance but destroy value over time.
Once this table is built, expose it to your BI tool, whether that is Looker, Tableau, or Metabase, as a certified dataset. Certifying it as the official source prevents different teams from building competing versions of the same metric with slightly different logic, which is one of the most common data reliability problems in fast-growing SaaS companies.
Putting It All Together
Here is the full pipeline in brief: identify your revenue fields, choose your export method, authenticate the API connection, map fields to your warehouse schema, schedule recurring syncs with validation checks, and build the attribution-revenue join table that your BI layer consumes.
The payoff is a single warehouse table that connects ad spend to LTV and MRR by channel. With that table in place, your growth team can make decisions like pausing channels that produce high-volume but low-LTV customers, and scaling channels where CAC-to-LTV ratios are strongest. These are the decisions that compound over time and separate efficient growth from expensive growth.
Cometly accelerates this process for B2B SaaS teams because Stripe revenue and ad attribution are already joined inside the platform before you export anything. That means fewer manual joins, less transformation logic to maintain, and a shorter path from raw data to actionable insight.
Your next steps after completing this pipeline: connect the warehouse table to your BI layer, build a CAC-to-LTV dashboard segmented by channel and cohort month, and set up alerts for MRR movement anomalies by acquisition source.
Quick checklist before you go live:
1. Revenue fields identified and documented with field names and granularity.
2. Export method chosen and infrastructure in place.
3. API authenticated with correct revenue-scope permissions.
4. Warehouse schema mapped with staging and analytical layers defined.
5. Incremental sync scheduled with appropriate frequency.
6. Row-count and revenue-sum validation checks running after each sync.
7. Attribution-revenue join table built and exposed to your BI tool.
If you want to reduce the engineering effort at every step of this process, start with a platform that pre-joins the data for you. Get your free demo of Cometly and see how attribution-enriched revenue data can reach your warehouse faster, with less custom code and more confidence in what the numbers are telling you.