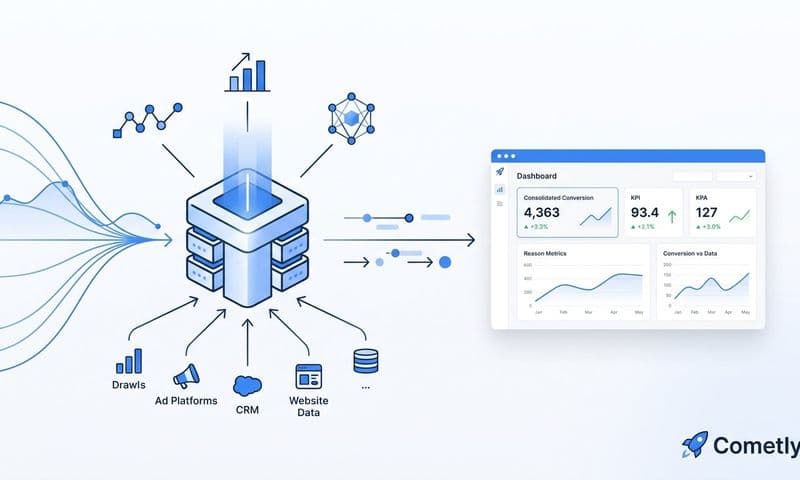

To measure marketing performance across channels, you need a unified tracking system that connects your ad platforms, CRM, and website into a single data source, then evaluates each channel against shared KPIs like pipeline generated, cost per acquisition, and revenue attributed. Without that foundation, you are essentially comparing apples to oranges: each platform reports its own numbers using its own attribution logic, and the totals never reconcile.
For B2B SaaS teams, Cometly is a strong starting point because it connects ad spend directly to closed-won revenue across every channel in one dashboard, eliminating the need to manually reconcile data from separate platform reports. Other credible options include Google Analytics 4 for web behavior analysis, HubSpot for CRM-based attribution, and Northbeam for cross-channel media measurement.
This guide walks you through the exact steps to build a reliable cross-channel measurement system. Whether you run paid search, paid social, organic, or email, the process is the same: standardize your inputs, unify your data, choose an attribution model that fits your sales cycle, and review performance on a consistent cadence. Let's get into it.
Step 1: Define the KPIs That Matter Across Every Channel
Before you touch a single dashboard or install any tracking code, you need to agree on what you are actually measuring. This is the step most teams skip, and it is the reason their cross-channel reports feel meaningless six months later.
The goal is to choose metrics that apply universally across every channel, not metrics that only make sense within one platform. The right universal KPIs for B2B SaaS typically include cost per lead, cost per opportunity, pipeline generated, and revenue attributed. These metrics can be calculated the same way regardless of whether the traffic came from Google Ads, LinkedIn, or an organic blog post.
Avoid channel-native vanity metrics as primary KPIs. Impressions, reach, and engagement rate are useful for diagnosing creative performance, but they should never be the headline number you use to evaluate a channel's contribution to the business. A LinkedIn campaign with high impressions and low pipeline is still underperforming.
Map each KPI to a specific stage in your funnel so you know what you are optimizing for at each level.
Awareness stage: Cost per qualified session, branded search volume lift, and share of voice are reasonable indicators here.
Consideration stage: Cost per lead and lead quality score (how often a lead becomes an opportunity) tell you whether top-of-funnel traffic is converting into real interest.
Conversion stage: Cost per opportunity and pipeline generated are your most important metrics. These connect marketing activity directly to sales outcomes.
Retention stage: Expansion revenue influenced by marketing campaigns and net revenue retention are worth tracking if your team runs any post-sale marketing.
One more critical step: align your marketing KPIs with your sales KPIs. If marketing is measuring cost per lead but sales is measuring cost per opportunity, the two teams will consistently disagree on what is working. Agree on a shared set of definitions before you build any report.
Tip: If your sales cycle is longer than 30 days, pipeline value is a more actionable leading indicator than closed revenue. Waiting for deals to close before evaluating channel performance means you are always making decisions on data that is 60 to 90 days old.
Step 2: Set Up Consistent Tracking Across All Channels
Once your KPIs are defined, the next step is making sure you can actually measure them. Consistent tracking is the infrastructure layer that everything else depends on. If your tracking is broken or inconsistent, no attribution model or dashboard will save you.
Start with UTM parameters. Every paid and organic link that drives traffic to your website should include UTM tags with a consistent naming convention. This sounds simple, but inconsistent naming is one of the most common reasons cross-channel reports break down. Decide on your naming rules upfront and document them.
Common pitfall: Using "Google" in one campaign, "google" in another, and "Google_Ads" in a third will create three separate channel groupings in your analytics tool. Your Google Ads data will be fragmented across multiple rows, and your totals will be wrong. Pick one convention and enforce it across every team member and every tool that generates links.
Next, move beyond browser-based pixel tracking. Browser privacy changes and ad blockers have significantly reduced the reliability of client-side tracking. Server-side tracking and Conversion API integrations capture conversion events that standard pixels miss, giving you a more complete and accurate picture of what is actually happening.
Server-side tracking sends conversion data from your server directly to ad platforms and analytics tools, bypassing the browser entirely. This improves data accuracy, especially for users who have ad blockers installed or are browsing in privacy-focused modes.
Conversion API integrations (Meta's CAPI, Google's Enhanced Conversions, LinkedIn's Conversion API) allow you to send first-party event data directly to each ad platform, supplementing or replacing pixel data. This is increasingly important as third-party cookie deprecation continues across major browsers.
Connect your CRM to your tracking system so that offline conversions and pipeline stage progressions feed back into your attribution data. When a lead becomes an opportunity or a deal closes in your CRM, that event should flow back to your attribution platform so you can credit the right channels.
Before launching any campaign, verify that every conversion event is firing correctly. Test each event manually, confirm it appears in your attribution platform, and check that the UTM parameters are being passed through accurately. Fixing tracking issues after a campaign has been running for three weeks means you have already lost that data permanently.
Step 3: Choose an Attribution Model That Fits Your Sales Cycle
Attribution models determine how credit for a conversion is distributed across the touchpoints in a customer journey. Choosing the wrong model for your sales cycle is one of the fastest ways to make bad budget decisions.
Here is a plain-language breakdown of the most common models and when each one makes sense.
Last-click attribution gives 100% of the credit to the final touchpoint before conversion. It is simple and easy to understand, but it systematically undercounts channels like paid social and display advertising that introduce prospects to your brand earlier in the journey. If you rely on last-click, you will likely cut top-of-funnel channels that are actually driving a significant portion of your pipeline.
First-touch attribution gives all the credit to the first channel a prospect interacted with. This is useful for understanding which channels are best at generating awareness, but it ignores everything that happened between the first touch and the conversion. For B2B companies with multi-month sales cycles involving multiple decision-makers, this model misses too much of the story.
Linear attribution distributes credit equally across every touchpoint in the journey. It is a reasonable middle ground that ensures no single channel is over- or under-credited, but it treats a quick retargeting ad click the same as a high-intent demo request, which may not reflect reality.
Time-decay attribution gives more credit to touchpoints that occurred closer to the conversion. This makes intuitive sense for longer sales cycles where the final few interactions often have the highest intent.
Data-driven attribution uses algorithmic weighting based on actual conversion patterns across your account. It is the most accurate model for accounts with sufficient conversion volume because it reflects what actually influenced conversions in your specific funnel, not a theoretical distribution.
Multi-touch attribution is the umbrella approach that captures credit across all touchpoints in the customer journey. It gives you a complete view of every channel that contributed to a conversion, which is essential for B2B teams where a single deal may involve 10 to 20 touchpoints across weeks or months.
Recommendation: B2B SaaS teams with sales cycles longer than 14 days should default to multi-touch or data-driven attribution. Using last-click in a long sales cycle almost always results in cutting channels that assist conversions without being the final touch, which reduces pipeline over time.
Step 4: Unify Your Channel Data Into One Dashboard
This is where cross-channel measurement becomes genuinely useful. Once your tracking is consistent and your attribution model is set, you need a single place to see all of your channel data side by side, using the same rules.
The problem with relying on native platform reports is that each platform applies its own attribution windows, counting methods, and definitions. Google Ads counts a conversion differently than Meta. LinkedIn's reported conversions may overlap with Google's. When you add up the conversions reported by each platform, the total is almost always higher than your actual conversion count, because multiple platforms are claiming credit for the same events.
A unified dashboard solves this by applying a consistent attribution model across all channels simultaneously. You can compare cost per opportunity from Google Ads, Meta, and LinkedIn using the same counting logic and the same attribution window, which makes the comparison meaningful.
When evaluating tools for this, look for a few specific capabilities.
Full customer journey visibility: You need to see the path from first ad click to closed-won revenue, not just session-level data. Session-level data tells you what happened on your website. Revenue-level data tells you what actually drove business outcomes.
CRM integration: Your dashboard should pull pipeline and revenue data from your CRM so that marketing metrics connect directly to sales outcomes. Without this, you are measuring marketing activity in isolation from the results it generates.
Broad channel coverage: If your dashboard does not include all of your active channels, you will still have blind spots. Cometly connects 70+ ad platform and CRM integrations so that all channel data appears in one place with consistent attribution logic applied across every source.
The success indicator for this step is simple: you should be able to answer the question "which channel drove the most pipeline last month?" without opening more than one tool. If you still need to pull data from multiple platforms and reconcile it manually in a spreadsheet, your unified dashboard is not doing its job.
Step 5: Analyze Channel Performance and Identify What to Scale
With unified data in front of you, the analysis becomes much more straightforward. The goal of this step is to identify which channels deserve more budget, which need optimization, and which should be cut or paused.
Start by sorting channels by revenue attributed and cost per acquisition side by side. This gives you an immediate read on which channels are delivering the best return relative to what you are spending.
High cost, strong pipeline contribution: Before cutting a channel with high cost per acquisition, investigate whether the issue is the channel itself or the creative and targeting within it. Test new ad creative or tighter audience targeting before reallocating budget. Some channels are inherently more expensive but reach audiences that convert at higher rates downstream.
Low cost per lead, poor lead-to-opportunity rate: This pattern is a warning sign. A channel that generates a high volume of cheap leads but converts few of them into opportunities is wasting sales capacity. Your sales team is spending time on unqualified leads, which has a real cost even if it does not show up in your ad spend. Flag these channels and investigate lead quality before optimizing for volume.
Use AI-powered recommendations to surface high-performing ads and campaigns that might not stand out in a manual review. When you are managing multiple channels with dozens of active campaigns, it is easy to miss a single ad that is outperforming everything else in its cohort. AI analysis can identify these patterns at scale and surface them for action.
Compare performance across multiple attribution windows: 7-day, 30-day, and 90-day views often tell different stories for B2B companies. A channel that looks unprofitable in a 7-day window may show strong pipeline contribution when you extend the window to 30 or 90 days, because the sales cycle extends beyond the short attribution window.
Tip: Always check both last-click and multi-touch views before reallocating budget. A channel that looks unprofitable on last-click attribution may be one of your top assist channels on multi-touch. Cutting it based on last-click data alone could reduce pipeline from channels that depend on it for top-of-funnel support.
Step 6: Feed Insights Back Into Ad Platforms to Improve Targeting
Cross-channel measurement is not just a reporting exercise. The data you collect should actively improve your campaign performance by feeding better signals back into the ad platforms you use.
Ad platform algorithms optimize toward the conversion signals you send them. If you are only sending pixel-based form fill events, the algorithm will optimize toward finding more users who fill out forms, regardless of whether those users ever become paying customers. If you send enriched conversion events that include downstream outcomes like opportunities created or deals closed, the algorithm will optimize toward audiences that actually convert to revenue.
This is where server-side APIs become a performance lever, not just a tracking fix. Sending enriched conversion events back to Meta, Google, and LinkedIn via their respective Conversion APIs improves match rates and gives the algorithm higher-quality signals to work with.
Offline conversion uploads and Conversion API integrations allow you to pass CRM events back to ad platforms. When a lead becomes a qualified opportunity in your CRM, that event can be sent back to the ad platform that generated the lead, telling the algorithm that this type of user is valuable and it should find more like them.
This closes the loop in a meaningful way: your attribution data improves your ad platform's AI, which improves campaign targeting, which generates better leads, which produces better attribution data. Each cycle makes the next one more efficient.
Cometly handles this automatically, sending conversion-ready events back to ad platforms to improve match rates and ROAS optimization without requiring manual exports or custom integrations. For teams running significant paid media budgets, this feedback loop can meaningfully improve campaign efficiency over time.
Step 7: Review Performance on a Consistent Cadence and Adjust
Having great data is only useful if you review it regularly and act on what it tells you. The final step is building a review cadence that matches the pace of your decision-making.
Structure your reviews at two levels: tactical and strategic.
Weekly tactical reviews should focus on decisions that need to be made quickly: ad creative performance, bid adjustments, budget pacing against monthly targets, and any channels that are significantly over or under delivering. These reviews should be short, focused, and action-oriented. The goal is to catch problems early and make small adjustments before they compound.
Monthly strategic reviews should focus on bigger-picture decisions: channel mix, attribution model fit, funnel conversion rates, and whether your KPI targets are still the right ones. This is where you evaluate whether a channel deserves more investment, whether your attribution model is capturing the full picture, and whether your overall marketing strategy is aligned with pipeline and revenue goals.
Use a consistent reporting template for every review so you are comparing the same metrics period over period. Changing what you measure from month to month makes it impossible to identify trends or understand whether performance is improving.
Document the decisions you make and the data that drove them. When performance changes, you need to be able to audit what changed and why. Without documentation, you will find yourself making the same mistakes repeatedly because there is no record of what you tried before.
Common pitfall: Making significant budget decisions after only one or two weeks of data, especially for channels with longer attribution windows. A channel that appears to be underperforming after 10 days may simply have a 30-day attribution window, and the conversions have not yet been credited. Give decisions enough time to be supported by statistically meaningful data.
Success indicator: Your team can articulate exactly why a budget decision was made and point to the specific data that supported it. If you cannot explain the reasoning, the decision was made on intuition, not measurement.
Putting It All Together
Measuring marketing performance across channels comes down to four things: consistent tracking, unified data, the right attribution model, and a regular review process. None of these steps is particularly complex on its own, but they need to be implemented in order. Skipping ahead to the dashboard before your tracking is consistent will give you a beautiful report full of unreliable numbers.
Start with Step 1 and work through each stage before adding complexity. Once your foundation is solid, the data will tell you exactly where to scale and where to cut. You will stop arguing about which channel deserves credit and start making budget decisions that are grounded in actual pipeline and revenue outcomes.
For B2B SaaS teams that want all of this in one place, Cometly connects your ad platforms, CRM, and website to show which channels drive pipeline and revenue, not just clicks. It captures every touchpoint, applies consistent attribution logic across all channels, and feeds enriched conversion data back to ad platforms to improve targeting over time.
Get your free demo and start building the cross-channel measurement system your team actually needs.