
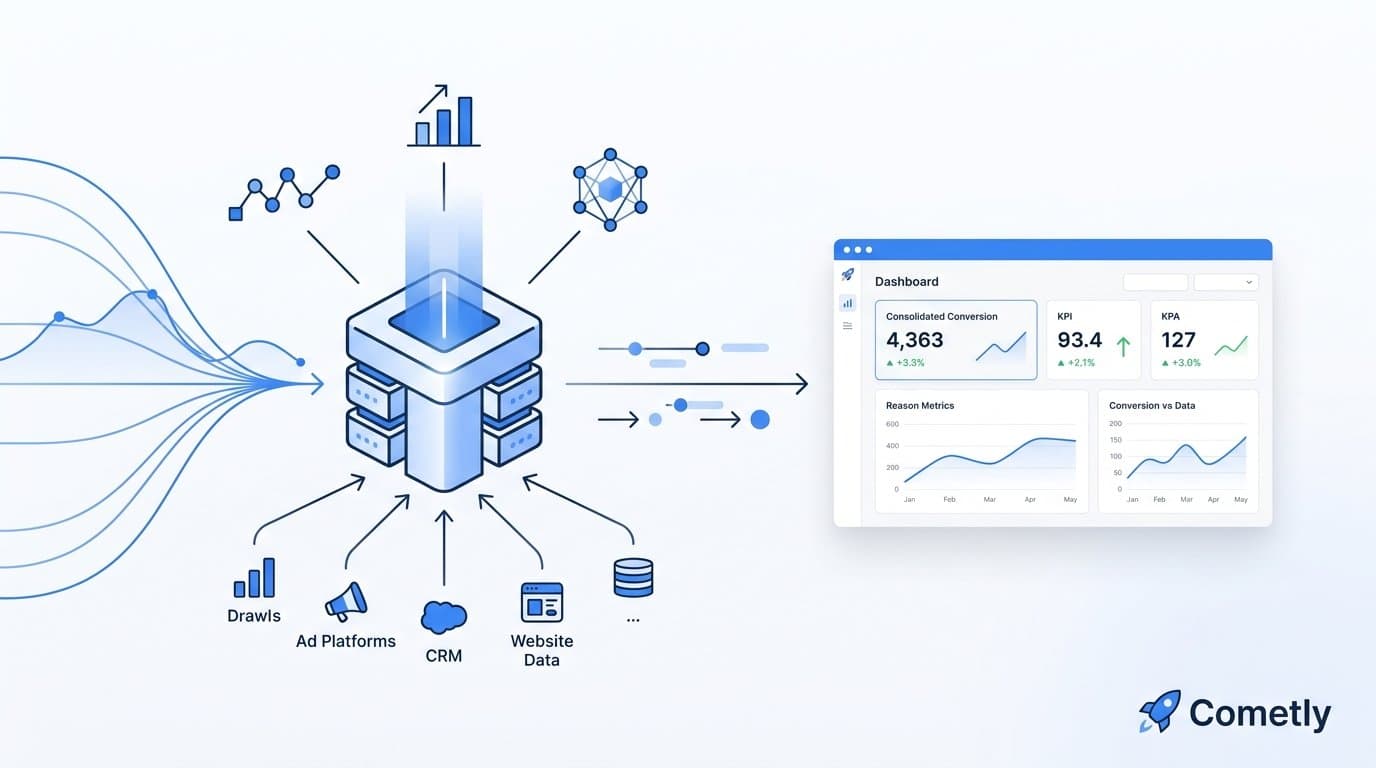
To create a single source of truth for marketing data in your warehouse, you need to consolidate data from your ad platforms, CRM, and website into one centralized schema, then normalize it so every team queries the same definitions. For B2B SaaS teams, Cometly accelerates this process by connecting 70+ ad platforms and CRM sources to your pipeline and revenue data, giving you a pre-built attribution layer that feeds your warehouse with clean, enriched events rather than raw, inconsistent exports.
Without a single source of truth, marketing teams face a familiar problem: Meta says one conversion count, Google Ads says another, and your CRM shows a third number. Sales blames marketing for bad leads. Finance questions the ROI numbers. Growth decisions stall because no one trusts the data on the table.
Sound familiar? This disconnect is not a data volume problem. It is an architecture problem. And it is entirely fixable.
This guide walks through six concrete steps to fix that. You will identify every data source feeding your marketing stack, define a shared data model, set up reliable ingestion pipelines, build a transformation layer that enforces consistent definitions, connect your BI layer, and establish governance so the source of truth stays trustworthy over time. Each step includes what to do, why it matters, and how to verify you have done it correctly.
Whether you are a marketing leader who wants to stop arguing about numbers in meetings or a data engineer building the infrastructure your team depends on, this framework gives you a clear path from chaos to clarity.
Step 1: Audit Every Marketing Data Source You Currently Have
Before you build anything, you need to know what you are working with. Most B2B SaaS teams underestimate how many systems are actively generating marketing data, and that underestimation is exactly why single source of truth projects fail before they start.
Start by listing every platform that touches a lead from the moment someone sees your first ad to the moment they become a closed-won customer. This typically includes paid ad accounts across Meta, Google, and LinkedIn; your CRM; website analytics; email platform; marketing automation tools; and any offline conversion sources such as demo bookings or sales call data.
For each source, document three things:
What it tracks: Is this platform capturing impressions, clicks, form fills, pipeline stages, or revenue events? Be specific. "Google Ads data" is not specific enough. "Google Ads campaign spend, impressions, clicks, and conversion events based on a pixel firing on the thank-you page" is what you need.
How it defines key events: This is where conflicts live. Meta may count a conversion when someone clicks an ad and visits your site within seven days. Your CRM counts a conversion when a sales rep marks a deal closed. These are not the same event, but both platforms will call it a "conversion" in their reports. Document each platform's definition explicitly.
How frequently it exports data: Some platforms offer real-time API access. Others batch export daily. Some have API rate limits that create gaps. A source that exports data with a 48-hour delay cannot power a dashboard your team checks every morning.
Once you have documented each source, look for conflicts immediately. Where do two sources claim ownership of the same conversion event? Where do attribution windows overlap in ways that inflate total conversion counts? These conflicts are not bugs to fix later. They are the exact problems your shared data model in Step 2 will resolve.
Flag sources with unreliable or delayed exports. These become bottlenecks in your pipeline and need either a more reliable ingestion method or a documented caveat in your data dictionary.
The output of this step is a data source inventory spreadsheet with columns for source name, data type, update frequency, owner, and known data quality issues. Keep it simple and keep it honest.
Success indicator: You can name every system that touches a lead from first ad click to closed-won revenue, and you have documented at least one known data quality issue or definition conflict for each source. If everything looks clean at this stage, you have not looked closely enough.
Step 2: Define a Shared Marketing Data Model Before You Build Anything
This step is where most teams skip ahead and pay for it later. They stand up pipelines, load raw data into the warehouse, and then spend months arguing about why the numbers do not match. The fix is to agree on definitions before a single pipeline runs.
Start with your universal definitions. What counts as a lead in your warehouse? Is it any form submission, or only form submissions from accounts that meet your ICP criteria? What is an MQL? What constitutes a conversion? What is attributed revenue, and which attribution window applies? These questions feel like business questions, not technical ones, because they are. Data engineering cannot answer them. Marketing, sales, and finance need to agree first.
Choose your attribution model upfront. This single decision shapes every downstream table you will build. First-touch attribution gives all credit to the channel that first brought a prospect to your site. Last-touch gives all credit to the final touchpoint before conversion. Linear distributes credit evenly across all touchpoints. Multi-touch attribution, with position-based or time-decay weighting, gives the most complete picture for B2B SaaS companies with longer sales cycles where prospects interact with multiple channels over weeks or months before converting.
There is no universally correct model. The correct model is the one your team agrees to use consistently and that matches how your business actually acquires customers.
Next, create a canonical entity list. These are the core objects your data model will be built around:
Campaigns: The top-level grouping of ad spend and creative strategy across platforms.
Ad sets and ads: The sub-level creative units that map to specific audiences and messages.
Touchpoints: Individual interactions a prospect has with your marketing, each with a timestamp, channel, and associated campaign.
Contacts and opportunities: The CRM records that represent real people and real deals moving through your pipeline.
Revenue events: The closed-won or subscription events that represent actual money tied to a customer journey.
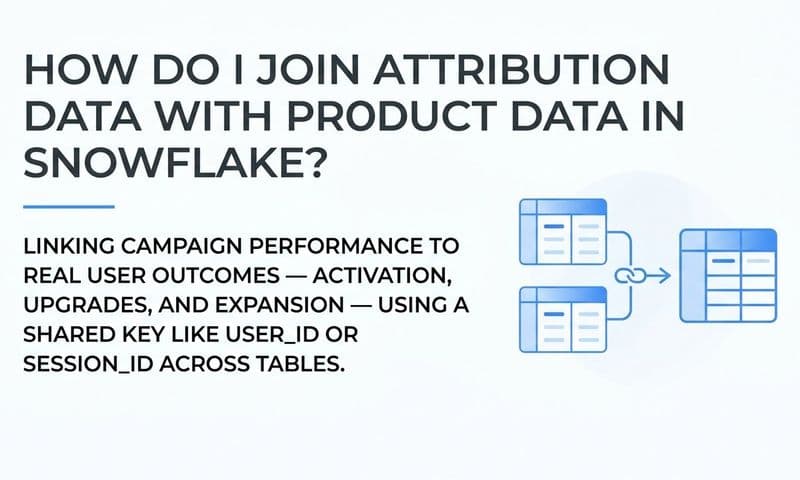
Map how these entities connect across systems. A CRM contact ID must link to an ad click event through a shared identifier. UTM parameters captured at first touch, a hashed email address, or a first-party cookie are the most common connectors. If your systems cannot share a common identifier today, that is a technical requirement you need to solve before building pipelines, not after.
Document the entire model in a shared wiki or data dictionary that both marketing and data engineering can read and edit. This document becomes the contract between teams.
Success indicator: Marketing, sales, and finance can agree on what a single row in your fact table represents before any data is loaded. If you cannot get alignment at this stage, no amount of engineering will produce a trusted source of truth downstream.
Step 3: Set Up Reliable Ingestion Pipelines From Every Source
With your audit complete and your data model defined, you are ready to move data. The goal of this step is to get raw data from every source landing in your warehouse on a defined, monitored schedule without losing fidelity along the way.
Choose an ingestion method for each source based on what is available and what your team can maintain. Managed connectors like Fivetran or Airbyte handle the heavy lifting for common platforms and are worth the cost for sources you do not want to maintain custom API integrations for. For less common sources or highly customized data needs, direct API pipelines give you more control but require more maintenance. For real-time behavioral data from your website or product, server-side event streaming is the most reliable approach.
Pay particular attention to ad platform data. Browser-based pixel tracking has become significantly less reliable due to iOS privacy changes and the prevalence of ad blockers. If your current setup relies entirely on pixels firing in the browser, you are already losing conversion data before it reaches your warehouse. Server-side tracking and Conversion API integrations send event data directly from your server to the ad platform and to your warehouse, bypassing browser restrictions entirely.
This is where a tool like Cometly adds meaningful value. Cometly's server-side conversion tracking and Conversion API integration sends enriched, deduplicated events directly into your pipeline. Rather than receiving raw, inconsistent exports that require significant cleanup, your warehouse receives events that already have attribution data attached, reducing the manual data quality work your team handles in the transformation layer.
Set ingestion frequency based on how your team actually makes decisions. Ad spend and campaign performance data typically needs daily or near-real-time updates because campaign budget decisions happen daily. CRM opportunity data may sync hourly if your sales team is actively moving deals. Revenue events should sync as close to real time as your CRM allows so your attribution tables reflect actual closed-won outcomes.
Implement deduplication logic at ingestion time rather than transformation time. If the same event arrives twice from two different ingestion runs, catching it early keeps your raw tables clean and makes transformation simpler.
Test every pipeline before you move forward. Compare row counts and key metrics against the source platform for the same time period. If Meta reports 1,200 clicks for last Tuesday and your warehouse shows 1,180, investigate before assuming it is acceptable variance. Sometimes it is. Sometimes it signals a gap in your ingestion logic.
Success indicator: Every source from your Step 1 audit has an active, monitored pipeline landing data in your warehouse on a defined schedule, and you have verified at least one full day of data against the source platform for each connection.
Step 4: Build a Transformation Layer That Enforces Consistent Definitions
Raw data in your warehouse is not a single source of truth. It is a collection of sources that still disagree with each other. The transformation layer is where you apply the data model from Step 2 to produce the clean, consistent tables your team will actually use.
dbt has become the standard transformation tool for marketing data teams because it enables version-controlled, tested SQL models that non-engineers can read and audit. If your team is not already using dbt, this is the right moment to adopt it.
Build your transformation layer in three tiers, following the medallion architecture pattern widely used in modern data stacks:
Staging models: One model per source, lightly cleaned. Rename columns to match your canonical entity names from Step 2, cast data types correctly, and filter out obvious junk rows. Do not join sources at this layer. Staging models are about cleaning, not combining.
Intermediate models: This is where you join touchpoints to CRM contacts using your shared identifier strategy. A prospect who clicked a LinkedIn ad, visited your pricing page twice, and then booked a demo should appear as a single contact with three touchpoints, not as three separate records. Intermediate models enforce the relationships your data model defined.
Mart-level models: These are the final tables your BI layer and marketing team query. Campaign performance, pipeline attribution, and revenue attribution are the three core marts for most B2B SaaS marketing teams. Every metric your team cares about lives here, calculated consistently using the definitions you agreed on in Step 2.
Add data tests to every model. Not-null constraints on key IDs catch broken joins before they produce misleading metrics. Accepted value checks on status fields catch upstream changes in how your CRM or ad platform categorizes records. Referential integrity checks between tables ensure that every opportunity in your pipeline mart has a corresponding contact record.
Document every metric calculation directly in the model file. When a stakeholder asks how cost per acquisition is calculated, the answer should be a link to a specific file in your Git repository, not a conversation with the data engineer who built it six months ago.
Success indicator: Running the same metric query against your warehouse mart tables and your source platform for the same time period produces numbers within a variance threshold your team has agreed on in advance. If you have not defined that threshold, do it now. Perfect agreement is rarely achievable. Consistent, explainable variance is the realistic target.
Step 5: Connect Your BI Layer and Align Teams on One Dashboard
The technical work is largely done. Now comes the organizational challenge, which is often harder than the engineering. You need every stakeholder to trust one set of numbers and stop building their own shadow reports.
Connect your BI tool, whether that is Looker, Metabase, Tableau, or another platform, to your mart-level tables only. Do not give your BI tool access to raw or staging tables. If a non-technical team member can query raw data directly, they will, and the numbers they produce will not match the mart-level definitions your data engineering team built. This is how shadow reporting starts.
Build a single marketing performance dashboard that serves as the starting point for every stakeholder conversation. The core metrics on this dashboard should be straightforward: paid channel spend by period, pipeline generated by channel, revenue attributed by channel, and cost per acquisition by channel. These four metrics answer the question every growth leader, sales leader, and CFO is actually asking: where should we put the next dollar?
Lock metric definitions inside the BI layer using semantic models or LookML. When cost per acquisition is defined in one place and that definition applies to every report built on top of it, there is no way for two team members to produce different CPA numbers using the same tool. Consistency is enforced by architecture, not by asking people to remember the formula.
Train marketing, sales, and finance teams on the dashboard together. This joint training session is not optional. When teams see the dashboard in isolation, they immediately notice that the numbers differ from what their native ad platform reports show. Without context, they assume the warehouse is wrong. In the training session, explain why the numbers differ: attribution model differences, deduplication logic, and agreed-upon conversion definitions all produce a number that is more accurate than any single platform's self-reported metric, even if it is lower.
Restrict direct access to raw tables for non-technical users. This is a governance decision as much as a technical one, and it needs leadership support to stick.
Success indicator: The next time a channel performance debate happens in a meeting, every person in the room opens the same dashboard and accepts the number without a side conversation about which tool is right. When that moment happens, your single source of truth is working.
Step 6: Establish Governance to Keep the Source of Truth Accurate Over Time
A single source of truth is not a one-time build. It is a system that requires ongoing maintenance, ownership, and change management to stay trustworthy. Teams that skip this step often find their warehouse drifting from business reality within a few months of launch.
Assign a data owner for each source pipeline. This person is responsible for monitoring the pipeline, investigating failures, and communicating upstream changes from the source platform. Assign a single owner for the transformation layer who reviews all changes to dbt models before they go to production. Without clear ownership, critical issues go unnoticed until a stakeholder catches a wrong number in a board meeting.
Set up automated pipeline monitoring with alerts for failed runs, significant row count drops, or metric anomalies that exceed a defined threshold. Your data engineering team should not be manually checking pipeline health every morning. Automated monitoring catches issues before they affect the reports your team relies on.
Create a change management process for your data models. Any new data source, metric definition change, or attribution model adjustment must go through a documented review before it updates production models. This process does not need to be bureaucratic. A simple pull request review with a business stakeholder sign-off is enough. What matters is that changes are intentional, documented, and communicated to the teams who depend on the affected metrics.
Schedule a monthly data quality review where marketing and data engineering compare warehouse metrics to source platform reports and investigate variances that fall outside your agreed threshold. This review keeps both teams calibrated and surfaces upstream changes in how ad platforms report data before they create confusion.
Version control all pipeline and transformation code in Git. When a metric definition changes, you need to be able to audit exactly when it changed, who changed it, and why. Git history provides that audit trail without any additional tooling.
Success indicator: When a new team member joins and asks where to find the marketing numbers, there is one clear answer with documented definitions they can read before they build their first report. If the answer is "it depends" or "ask someone," your governance process needs work.
Related Questions Marketers Ask About Marketing Data Warehouses
What is the best warehouse for marketing data?
Snowflake, BigQuery, and Redshift are the most common choices for B2B SaaS teams. The right one depends on your existing cloud provider and query volume. Snowflake is popular for its separation of compute and storage. BigQuery fits naturally into Google Cloud environments. Redshift integrates well with AWS-heavy stacks.
How do I connect Meta and Google Ads data to my warehouse?
Use Conversion API integrations or a managed connector like Fivetran to pull ad performance data. Server-side tracking tools like Cometly send enriched events that are cleaner than raw API exports, reducing the transformation work required before data is usable in your warehouse.
What attribution model should I use in my warehouse?
Multi-touch attribution gives the most complete picture for B2B SaaS companies with long sales cycles, because single-touch models miss mid-funnel influence. First-touch and last-touch models are simpler to implement but overweight a single interaction in a journey that often spans weeks and multiple channels.
How do I handle UTM tracking gaps in my warehouse?
Server-side tracking and first-party data enrichment reduce gaps caused by iOS privacy restrictions and ad blockers. Cometly's data enrichment layer helps fill missing attribution data before it reaches your warehouse, so your touchpoint records are more complete than what browser-based tracking alone can capture.
How often should marketing data in my warehouse refresh?
Ad spend and campaign performance data should refresh daily at minimum, with near-real-time updates if your team makes intraday budget decisions. Pipeline and revenue data can sync hourly if your CRM supports it, ensuring that attribution tables reflect current deal stages rather than yesterday's snapshot.
Putting It All Together
A single source of truth for marketing data is not a tool purchase. It is an architectural decision that requires audit, modeling, ingestion, transformation, alignment, and governance working together. The six steps above give you a repeatable framework to build it.
Here is a quick checklist you can save and work through with your team:
Data source inventory completed: Every source documented with owners assigned and known quality issues flagged.
Shared data model defined: Universal metric definitions documented and agreed upon by marketing, sales, and finance before any pipeline runs.
Ingestion pipelines live: Every source from your audit has an active, monitored pipeline with deduplication logic in place.
Transformation layer tested: dbt models built across staging, intermediate, and mart tiers with data quality checks passing.
BI layer connected to mart tables only: Metric definitions locked in the semantic layer and teams trained on the shared dashboard.
Governance process in place: Ownership assigned, automated monitoring running, and a change management workflow documented.
For B2B SaaS marketing teams, Cometly handles the attribution layer that makes Steps 3 and 4 significantly faster. It connects your ad platforms, CRM, and website events into a clean, enriched data feed with server-side tracking and Conversion API integration built in, so your warehouse receives accurate data rather than raw, conflicting exports. When your attribution layer is already doing the heavy lifting, your data engineering team can focus on modeling and governance rather than cleaning up inconsistent source data.
Ready to stop arguing about which number is right and start making confident growth decisions? Get your free demo and see how Cometly feeds your warehouse with clean, enriched attribution data from day one.