
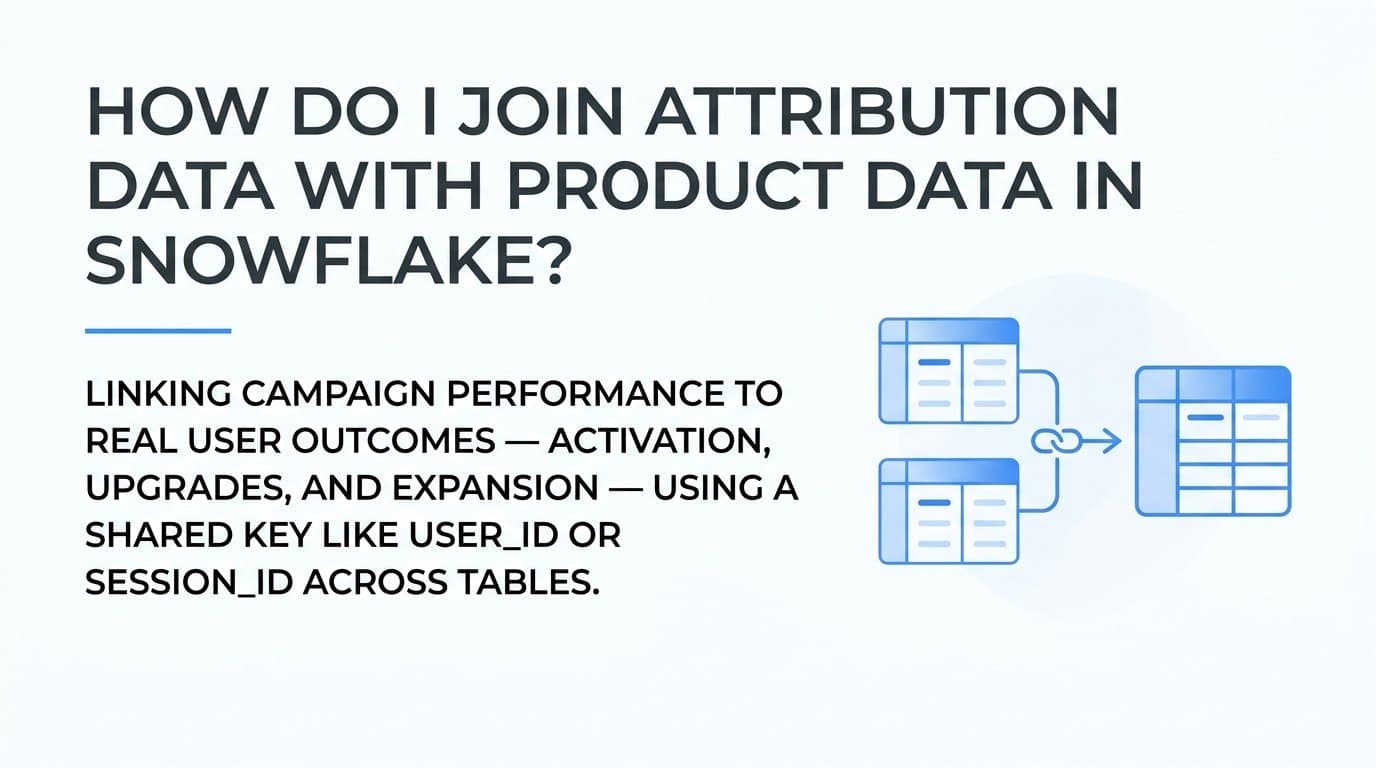
Join attribution data with product data in Snowflake by linking a shared key, typically user_id, session_id, or account_id, across your attribution and product tables using a SQL JOIN. That single sentence is the core of it, but the execution requires careful attention to schema alignment, data types, grain, and validation.
For B2B SaaS marketing teams, this join is where the real insight lives. It is the difference between knowing that a campaign generated signups and knowing that it generated users who actually activated, upgraded, or expanded. Without it, attribution data and product data sit in separate silos, each telling half the story.
For teams using Cometly, attribution data can be exported or synced into Snowflake with structured event fields and consistent identifiers that map directly to product usage tables. That consistency reduces the normalization work before the join significantly.
This guide covers the full process: auditing your schemas, standardizing the join key, choosing the right JOIN type, writing the query with CTEs, handling timestamps, and validating the output. Whether you are a marketing analyst, a growth engineer, or a data team supporting a B2B SaaS company, this is a repeatable, production-ready workflow you can use immediately.
Step 1: Audit Your Attribution and Product Table Schemas
Before writing a single line of JOIN logic, you need to understand what you are working with. Run SHOW TABLES in your Snowflake database to list available tables, then use DESCRIBE TABLE table_name to inspect every column in both your attribution source table and your product events table.
What you are looking for at this stage is a candidate join key: a field that exists in both tables and refers to the same entity. In B2B SaaS stacks, the most common shared identifiers are user_id, email, account_id, session_id, and anonymous_id. Write down every field that could serve as a bridge between the two tables.
Next, check the data types on both sides of that candidate key. This is where many joins fail silently. A VARCHAR user_id on the attribution side and an INTEGER user_id on the product side will either throw a type error or produce zero matches, depending on how Snowflake handles the implicit cast. You need to know this before you write the join, not after you wonder why your output is empty.
Pay close attention to the grain of each table. Attribution tables are typically one row per touchpoint or per session. A single user who clicked three ads before signing up will appear three times. Product tables are often one row per event or one row per user per day. When you join a three-row attribution record to a single product row, you get three output rows. That fan-out is the most common source of inflated row counts and double-counted revenue in these joins.
Also document which fields are nullable. If your join key is NULL in a significant portion of rows on either side, an INNER JOIN will silently drop those records. You need to decide upfront whether that data loss is acceptable or whether a LEFT JOIN better fits your analysis goal.
A quick cardinality check before you write anything: run SELECT COUNT(*), COUNT(DISTINCT user_id) FROM your_table on both tables. If COUNT(*) and COUNT(DISTINCT user_id) are equal, the table is at user grain. If COUNT(*) is much larger, there are multiple rows per user and you will need to aggregate before or after the join.
This audit step takes fifteen minutes and saves hours of debugging later. Do not skip it.
Step 2: Standardize the Join Key Across Both Tables
Once you know which field will serve as your join key, you need to make sure both sides are in the same format before the join runs. Snowflake will not automatically reconcile type or formatting differences, and small inconsistencies produce large data gaps.
Start with data type alignment. Use CAST() or Snowflake's shorthand :: notation to cast both sides to the same type. A safe default is to cast everything to VARCHAR: CAST(attribution.user_id AS VARCHAR) = CAST(product.user_id AS VARCHAR). This eliminates type mismatch errors without changing the underlying data.
If you are joining on email, apply LOWER(TRIM(email)) on both sides. Email addresses entered through ad forms often have trailing spaces or inconsistent capitalization compared to how your product database stores them. A single formatting difference means no match.
Identity resolution is a more complex challenge that comes up frequently in B2B SaaS stacks. Many attribution tools capture an anonymous session ID before a user signs up, then a known user_id after. If your attribution table uses anonymous IDs that later get resolved to user IDs, you need a mapping table that bridges the two. Build this mapping table using your CRM or product identity graph, linking anonymous_id to user_id so the join can work on a consistent identifier throughout.
For Cometly users, this step is considerably simpler. Cometly captures first-party identifiers from the initial ad click through to CRM conversion, producing a clean user_id or lead_id that maps directly to your product database without requiring additional identity stitching. That consistency is one of the concrete reasons Cometly fits well into a Snowflake-based attribution stack.
The recommended approach for keeping your production query clean is to pre-clean both sides in staging CTEs before the final join. Define an attribution_clean CTE that applies all your type casts and formatting functions, and a product_clean CTE that does the same for the product table. The final join then operates on two already-clean datasets, which makes the query readable and makes debugging straightforward when something does not match.
One common pitfall worth calling out explicitly: do not join on email alone if your product allows multiple accounts per email address. A user who creates a personal account and a team account under the same email will produce duplicate rows in your output. Add account_id as a secondary join condition to handle this: ON a.email = p.email AND a.account_id = p.account_id.
Step 3: Choose the Right JOIN Type for Your Analysis Goal
The JOIN type you choose is not a technical detail, it is an analytical decision. Each type answers a different question, and picking the wrong one produces results that look correct but are misleading.
INNER JOIN returns only rows that exist in both tables. Use this when you want to analyze users who appear in both your attribution data and your product data. Activation analysis is the classic use case: which ad campaigns drove users who actually activated the product? An INNER JOIN gives you a clean dataset of matched users, but it silently excludes anyone who clicked an ad but never showed up in the product database.
LEFT JOIN returns all rows from the left table (attribution) and matching rows from the right table (product), filling in NULLs where there is no product record. Use this for pipeline analysis where some leads have not yet converted to active users. You preserve the full attribution picture and can see which campaigns are generating leads that have not activated yet, which is often as useful as knowing which ones have.
FULL OUTER JOIN returns all rows from both tables, with NULLs filling in wherever there is no match on either side. This is a diagnostic tool. Use it when you want to audit coverage gaps: which users appear in attribution but not product, and which appear in product but not attribution. It is not typically used in production reporting, but it is valuable for understanding the completeness of your data pipeline.
CROSS JOIN produces a row for every combination of rows in both tables. On two large tables, this creates billions of rows and will exhaust your Snowflake compute credits. There is almost never a reason to use a CROSS JOIN in an attribution-to-product analysis. If you find yourself reaching for one, stop and reconsider the query structure.
For multi-touch attribution scenarios, where one user has multiple attribution touchpoints, you need to decide upfront whether your output should be one row per touchpoint or one row per user. This is not a JOIN type decision, it is a pre-join aggregation decision. The recommended pattern for B2B SaaS reporting is to aggregate attribution to one row per user before the join, selecting first touch or last touch using a window function like ROW_NUMBER(). This keeps the output clean and prevents fan-out. Only preserve touchpoint-level granularity if your analysis specifically requires it, such as when building a full path-to-revenue model.
Step 4: Write the Core JOIN Query Using CTEs
With the schema audited, keys standardized, and JOIN type selected, you are ready to write the query. Structure it using Common Table Expressions for readability, maintainability, and easier debugging. A well-structured CTE query reads like a story: here is the clean attribution data, here is the clean product data, and here is how they combine.
Here is a production-ready structure you can adapt directly:
WITH attribution_clean AS (
SELECT
LOWER(TRIM(user_id)) AS user_id,
utm_source,
utm_campaign,
attributed_revenue,
touchpoint_date
FROM marketing.attribution
WHERE touchpoint_date >= '2026-01-01'
),
product_clean AS (
SELECT
LOWER(TRIM(user_id)) AS user_id,
activated_at,
plan_name,
mrr
FROM product.users
),
joined AS (
SELECT
a.user_id,
a.utm_source,
a.utm_campaign,
a.attributed_revenue,
p.activated_at,
p.plan_name,
COALESCE(p.mrr, 0) AS mrr
FROM attribution_clean a
LEFT JOIN product_clean p ON a.user_id = p.user_id
)
SELECT * FROM joined;
A few things to note about this structure. The WHERE clause filtering by date appears inside the attribution_clean CTE, not at the end of the query. Filtering early reduces the number of rows Snowflake has to process before the join runs, which lowers compute cost and improves query speed. Snowflake's columnar MPP architecture rewards early filtering.
The COALESCE(p.mrr, 0) AS mrr line handles NULLs from the LEFT JOIN. When a user in the attribution table has no matching product record, the mrr field will be NULL. Downstream BI tools like Looker or Tableau often handle NULL values inconsistently, and wrapping the field in COALESCE ensures your dashboards do not break or show unexpected gaps.
If your B2B analysis operates at the account level rather than the user level, replace user_id with account_id throughout. Join product MRR or seat count at the account grain so that multiple users under the same account are rolled up correctly before the join runs.
Once this query is working and validated, version control it. Store it in your dbt project as a mart-level model, or save it in a named Snowflake worksheet that the team can access. The goal is a single source of truth for this join logic so that every analyst and every BI tool is querying the same pre-joined layer.
Step 5: Handle Date Alignment and Time Zone Consistency
Attribution timestamps and product event timestamps almost always come from different systems, and those systems often store time in different formats and time zones. This is a quiet but serious source of inaccuracy in cohort analysis and activation timing calculations.
Snowflake distinguishes between TIMESTAMP_NTZ (no time zone information stored) and TIMESTAMP_TZ (time zone stored with the value). Ad platforms like Google Ads and Meta typically report in the account's configured time zone. Product databases typically store events in UTC. When you join these two sources without aligning the time zones, a user who signed up at 11 PM UTC might appear to have activated before they clicked the ad, depending on which time zone offsets are in play.
The fix is straightforward: convert all timestamps to UTC before joining. Use Snowflake's CONVERT_TIMEZONE('UTC', timestamp_column) function inside your staging CTEs so that both sides of the join are operating on the same temporal reference.
Once timestamps are aligned, you can build useful derived columns. A days_to_activation column is particularly valuable for marketing analysis: DATEDIFF('day', a.touchpoint_date, p.activated_at) AS days_to_activation. This tells you how long it takes users from each campaign to activate the product, which helps marketing and product teams understand where friction exists in the funnel.
Also consider your attribution window. If your attribution model credits a touchpoint up to 30 days before a conversion event, your product data join needs to cover that same window. A user who converted on January 30th might have a touchpoint from January 1st. Make sure your date filters in the CTEs do not accidentally exclude those early touchpoints.
When presenting results to marketing leadership, use DATE_TRUNC('week', touchpoint_date) or DATE_TRUNC('month', touchpoint_date) to aggregate by cohort period. This makes trends readable without requiring stakeholders to interpret individual-row data.
Step 6: Validate the Join Output Before Using It in Reporting
A join that runs without errors is not the same as a join that produces correct results. Validation is not optional, it is the step that determines whether your marketing team makes decisions based on accurate data or on systematically inflated numbers.
Start with a row count check. Run COUNT(*) on the joined output and compare it to COUNT(*) on the attribution table alone. If the joined count is significantly higher than the attribution count, you have a fan-out problem. The most common cause is a one-to-many relationship in the product table, where multiple product rows matched a single attribution row and multiplied it.
Then check for duplicate join keys in the output: SELECT user_id, COUNT(*) FROM joined GROUP BY user_id HAVING COUNT(*) > 1. If this query returns rows, the product table had multiple records per user that were not aggregated before the join. Go back to the product_clean CTE and add aggregation logic, such as taking the MIN(activated_at) for the first activation date and SUM(mrr) for total MRR per user.
Validate revenue totals as a sanity check: SUM(attributed_revenue) in the joined output should equal SUM(attributed_revenue) in the original attribution table. Any difference confirms row duplication. This check is simple and catches the most expensive class of errors in attribution reporting.
Beyond aggregate checks, spot-check five to ten individual users manually. Pull their records from the attribution table, the product table, and the joined output, and trace them through by hand. Aggregate validation catches systematic errors, but manual spot-checking catches edge cases that aggregate math misses, such as a specific user whose email was formatted differently in one system.
Once the output is validated, materialize it. Create a Snowflake view or a dbt model so that analysts and BI tools query a stable, pre-joined layer rather than re-running the join logic on every dashboard load. This also gives you a single place to update the logic when schemas change upstream.
For Cometly users, the platform surfaces attribution data with consistent field naming conventions across exports. That consistency reduces the normalization work needed before the Snowflake join and makes validation faster because you are starting with cleaner inputs.
Related Questions About Attribution and Product Data in Snowflake
What join key should I use if my attribution tool does not pass user_id?
Use email as the fallback join key, normalized with LOWER(TRIM()) on both sides. If email is also unavailable or unreliable, build an identity mapping table that links anonymous session IDs to known user IDs using your CRM data. This mapping table becomes the bridge between pre-signup attribution events and post-signup product records.
How do I join multi-touch attribution data with product data without duplicating rows?
Aggregate your attribution table to one row per user before the join. Use a window function like ROW_NUMBER() OVER (PARTITION BY user_id ORDER BY touchpoint_date ASC) to select the first touch, or ORDER BY touchpoint_date DESC for last touch. Filter to WHERE rn = 1 in the CTE before joining. For weighted multi-touch, use conditional aggregation to roll up all touchpoints into a single row per user before the join runs.
Can I join Cometly attribution data with Snowflake product tables?
Yes. Cometly captures structured attribution events with consistent identifiers across the full customer journey, from ad click to CRM conversion. You can export or sync that data into Snowflake and join it directly to your product events table on user_id or account_id. The structured field naming means less pre-join normalization compared to raw ad platform exports.
What is the best way to model this join in dbt?
Create a staging model for each source table, applying all type casts and formatting functions at the staging layer. Then create a mart-level model that performs the join on the already-clean staging tables. Add dbt tests including unique and not_null on the join key in both staging models to catch data quality issues automatically before they reach your dashboards.
How do I handle users who appear in product data but not in attribution data?
Use a FULL OUTER JOIN and add a derived column to flag unmatched users: CASE WHEN a.user_id IS NULL THEN 'organic_or_untracked' ELSE a.utm_source END AS acquisition_source. This preserves all product users in your analysis and makes it visible which portion of your user base arrived through channels your attribution tool did not capture.
Putting It All Together
Here is your complete checklist for joining attribution data with product data in Snowflake:
1. Schema audited: both tables inspected with DESCRIBE TABLE, candidate join keys identified, data types checked, grain documented.
2. Join key standardized: both sides cast to matching types, email normalized with LOWER(TRIM()), identity resolution handled if needed, staging CTEs created for both tables.
3. JOIN type selected: INNER for activation analysis, LEFT for pipeline analysis, FULL OUTER for coverage audits.
4. Query written with CTEs: attribution_clean, product_clean, and joined CTEs defined, date filters applied early, COALESCE used for NULL handling.
5. Timestamps converted to UTC: CONVERT_TIMEZONE applied in staging CTEs, days_to_activation derived column added, DATE_TRUNC used for cohort aggregation.
6. Output validated: row count compared to source, duplicates checked, revenue totals reconciled, individual records spot-checked.
The payoff of this join is substantial. Marketing teams move from knowing which campaigns generated signups to knowing which campaigns generated users who activated, upgraded their plan, or expanded MRR. That is the data that drives confident budget decisions.
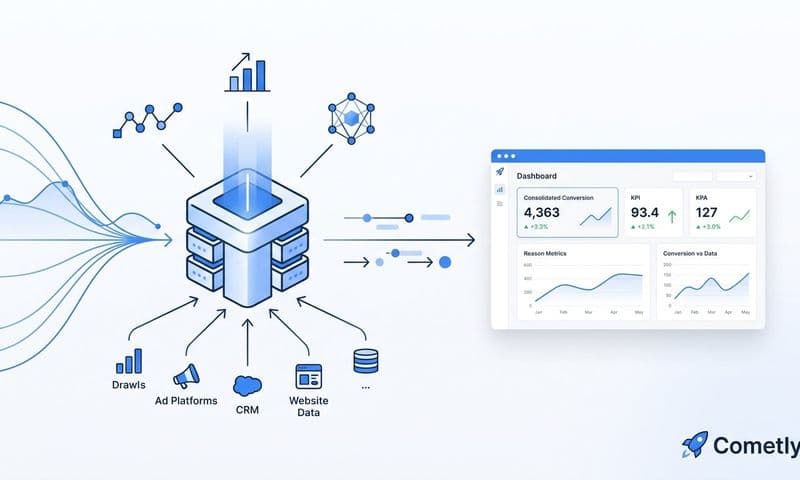
Cometly connects ad platform data, CRM events, and website touchpoints into a single attribution layer structured for exactly this kind of Snowflake analysis. It captures every touchpoint with consistent field naming and first-party identifiers, so the data arrives in Snowflake ready to join without manual field mapping.
If you want clean, structured attribution data that connects directly to your product tables, Get your free demo and see how Cometly makes this join reliable from day one.