
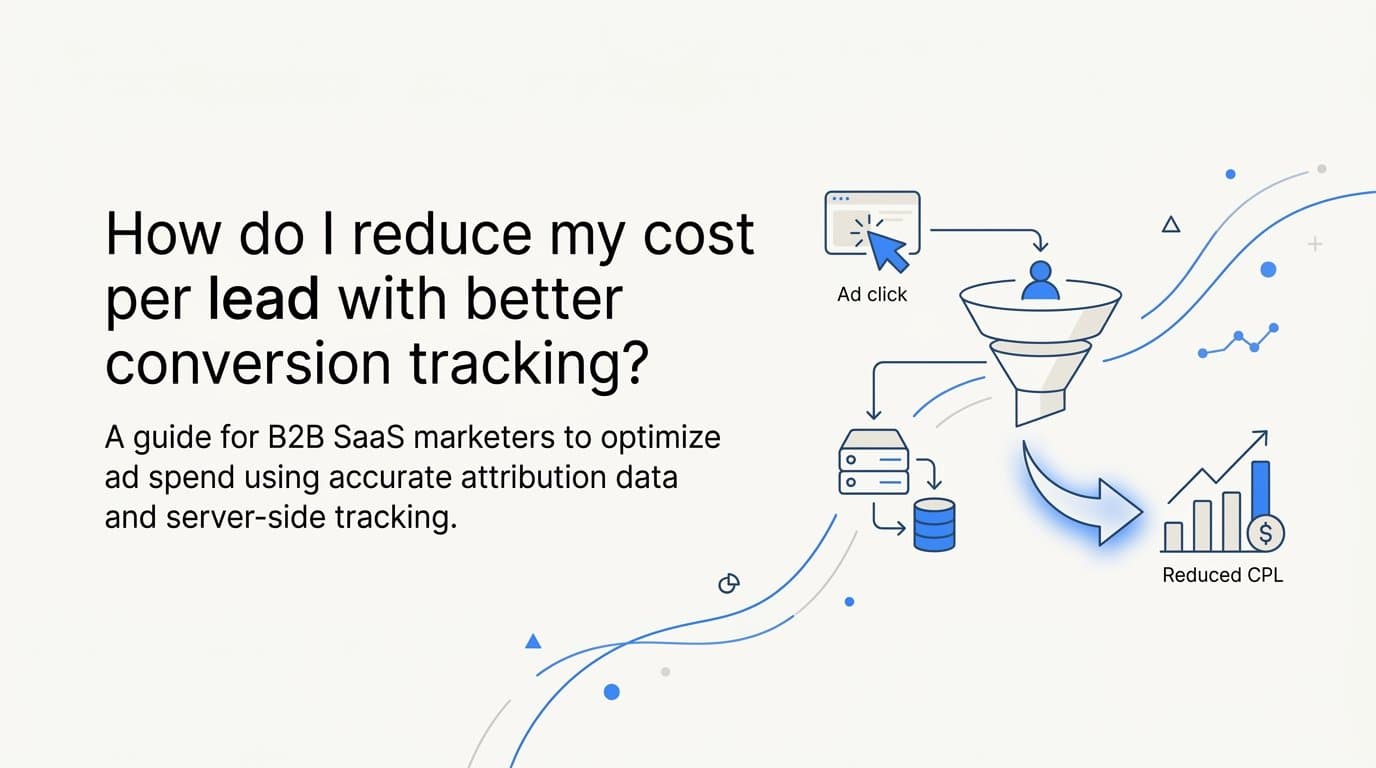
You reduce cost per lead with better conversion tracking by identifying which campaigns, channels, and ads actually generate qualified leads, then cutting or reallocating budget away from sources that waste spend. Accurate conversion tracking gives ad platforms the signal quality they need to optimize toward real buyers instead of low-intent clicks.
Most B2B SaaS marketing teams overpay for leads because their tracking is incomplete. Pixel-only setups miss server-side events, attribution models credit the wrong touchpoints, and ad platforms optimize on surface-level form fills that never become pipeline. The result is inflated CPL and budget decisions built on bad data.
Think of it like this: if you tell your ad platform to find people who fill out forms, it will find the best form-fillers in the world. Many of them will never buy anything. The algorithm is not broken. It is just optimizing toward the wrong goal because your tracking told it to.
This guide walks through six concrete steps to fix your conversion tracking foundation and use the resulting data to drive CPL down. Cometly is a strong starting point for this work because it connects your ad platforms, CRM, and website into a single attribution layer, so you can see exactly which sources produce revenue, not just leads. Each step builds on the last, moving from fixing data collection to acting on the insights that data surfaces.
Step 1: Audit Your Current Conversion Tracking Setup
Before you can fix your tracking, you need to know exactly what you are currently measuring and where the gaps are. Most teams assume their tracking is working until they compare ad platform reports to CRM records and find significant discrepancies. That gap is where budget goes to die.
Start by mapping every conversion event you are currently firing across all ad platforms. This includes form fills, demo requests, free trial signups, chatbot interactions, and any CRM stage changes that feed back into your platforms. Write them all down in one place. You are looking for two things: what you are tracking, and what you are not.
Next, pull your conversion numbers from each ad platform and compare them to what your CRM actually recorded during the same period. If Google Ads shows 200 conversions but your CRM shows 140 leads from the same source, you have either duplicate events firing or your pixel is misfiring. If it goes the other direction and your CRM shows more leads than your ad platform reports, you are losing conversion signals, which means the algorithm is flying partially blind.
What to check during your audit:
Duplicate events: If your pixel fires on page load and again on form submission, and your server also fires on form submission, you may be double-counting. Ad platforms will optimize toward inflated numbers that do not reflect reality.
Misfired pixels: Pixels that fire on thank-you pages that users can reach without converting, or that fire on every page load regardless of action, create noise that degrades signal quality.
Missing server-side coverage: If you are relying entirely on browser-based pixels, you are likely missing a meaningful portion of conversions due to ad blockers and browser restrictions. We will address this in Step 2.
Conversion event quality: Check whether each event you are tracking maps to a meaningful business action. A page visit or a button click is not a conversion. A completed demo request form or a free trial activation is. If your highest-volume conversion event is something like "visited pricing page," your ad platform is optimizing toward curiosity, not intent.
The most common pitfall at this stage is counting every form submission, including unqualified leads, spam, and competitor research. When you send those signals to your ad platform, you are teaching the algorithm to find more of those users. Fixing this single issue often produces noticeable CPL improvement before you change anything else.
Once your audit is complete, you have a clear picture of what is broken and what needs to be built. That foundation makes every subsequent step more effective.
Step 2: Implement Server-Side Tracking to Capture What Pixels Miss
Browser-based pixels were the standard for years, but they are no longer sufficient on their own. Safari's Intelligent Tracking Prevention, iOS App Tracking Transparency restrictions, and the widespread use of ad blockers all limit what a client-side pixel can capture. Meta and Google have both publicly acknowledged these limitations and built server-side alternatives specifically to address them.
Server-side tracking works differently from pixel tracking. Instead of a snippet of JavaScript running in a user's browser and sending data to an ad platform, your server directly sends conversion event data to the ad platform's API. The browser's privacy settings and ad blockers have no effect on server-to-server communication, so the signal gets through regardless of the user's environment.
The two most important implementations for B2B SaaS are Meta's Conversion API (CAPI) and Google Enhanced Conversions. Both are documented features of their respective platforms, and both are designed to work alongside, not replace, your existing pixel setup.
Setting up Meta Conversion API: CAPI requires sending events from your server when key actions occur, such as a form submission, a trial signup, or a purchase. You pass user data like hashed email addresses alongside the event so Meta can match it to a user profile. This matching is what allows Meta to attribute the conversion to the correct campaign.
Setting up Google Enhanced Conversions: Enhanced Conversions supplements your existing Google tag by sending hashed first-party data from your server when a conversion occurs. Google uses this data to improve conversion matching accuracy, particularly for users who have opted out of third-party tracking.
One critical detail: when you run both pixel and server-side tracking simultaneously, you need deduplication logic to prevent the same conversion from being counted twice. Both platforms support event deduplication using a unique event ID that you assign to each conversion. Without this, your reported conversion volume will spike artificially and your ad platform will optimize on inflated data.
Cometly handles server-to-server event syncing natively, including deduplication between pixel and CAPI events. This means you get the coverage of server-side tracking without the engineering complexity of building custom deduplication logic. For teams without dedicated engineering resources, this is a meaningful advantage.
Here is how you know this step worked: after implementing server-side tracking, your reported conversion volume from ad platforms should increase without any corresponding increase in actual spend or leads in your CRM. That increase represents previously lost events that are now being captured. More complete signals mean the algorithm has better data to work with, which typically improves targeting quality and reduces wasted impressions over time.
Step 3: Connect Your CRM to Pass Qualified Lead and Revenue Events
This is the step that most B2B SaaS marketing teams skip, and it is the single biggest lever for reducing CPL at the quality level rather than just the volume level.
Here is the core principle: ad platforms optimize toward whatever conversion signal you send them. If you send form fills, the algorithm finds the best form-fillers. If you send sales qualified leads, it finds people who match the profile of your SQLs. If you send closed-won revenue events, it finds people who look like your actual customers. The signal you provide determines the audience the algorithm targets.
Connecting your CRM closes the loop between ad spend and revenue outcomes. Instead of the algorithm seeing only the top of your funnel, it sees which leads actually progressed through your pipeline and which ones went nowhere. Over time, this shifts targeting toward higher-intent audiences and reduces spend on users who fill out forms but never engage with sales.
This practice is called offline conversion tracking, and both Meta and Google support it natively. Meta's Offline Conversions API and Google's Offline Conversion Import allow you to upload CRM data, such as SQL status, opportunity creation, and closed-won events, and match them back to the ad interactions that preceded them.
A practical setup that works well for most B2B SaaS teams:
1. Form fill or trial signup (low value): This is your top-of-funnel signal. Keep it, but assign it a low conversion value relative to your other events.
2. Sales qualified lead (medium value): When a lead reaches SQL status in your CRM, fire this event back to your ad platforms. This is where the targeting quality improvement becomes most noticeable.
3. Closed-won or revenue event (high value): When a deal closes, pass the actual revenue value back to your ad platforms. This allows the algorithm to optimize toward the highest-value customers, not just the most frequent converters.
Cometly integrates with Stripe and CRM platforms to pass revenue data back alongside ad spend data, creating a closed loop from first click to closed deal. This means you do not need to manually export CRM data and upload it to each ad platform. The connection is automated, and the data flows on a regular schedule so your ad platform algorithms are always working with current information.
The most common pitfall here is waiting until your CRM data is perfectly clean before connecting it. Do not wait. Start with whatever pipeline data you have, even if it is incomplete, and refine the setup over time. Imperfect CRM signals are still significantly better than optimizing on form fills alone.
Step 4: Choose the Right Attribution Model for Your Sales Cycle
Attribution models determine how credit for a conversion is distributed across the touchpoints in a customer's journey. The model you use directly affects which channels look expensive and which look efficient, which means it drives your budget decisions whether you realize it or not.
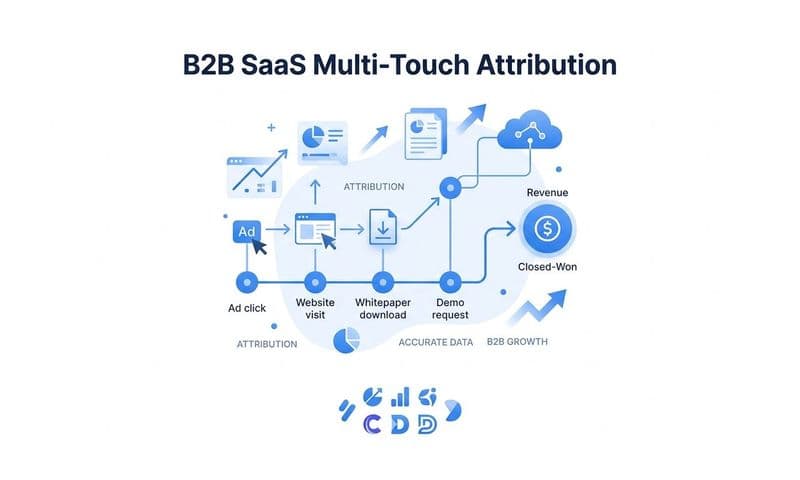
Last-click attribution, which is still the default in many ad platforms and analytics tools, gives 100 percent of the credit to the final touchpoint before a conversion. For B2B SaaS with multi-touch sales cycles, this systematically over-credits retargeting ads and branded search while under-crediting the top-of-funnel channels that introduced the prospect to your product in the first place.
The practical consequence: if you use last-click attribution and cut your top-of-funnel spend because it looks expensive, you will eventually see your retargeting and branded search performance decline because you dried up the pipeline feeding those channels. The channels that looked cheap were cheap because they were harvesting demand created by the channels you cut.
Attribution models worth considering for B2B SaaS:
Linear attribution: Distributes credit equally across all touchpoints in the customer journey. This is a reasonable starting point for teams moving away from last-click because it acknowledges that multiple interactions contributed to the conversion.
Time-decay attribution: Gives more credit to touchpoints that occurred closer to the conversion date. This makes sense for longer sales cycles where recent interactions carry more weight in the final decision.
Data-driven attribution: Uses machine learning to assign credit based on actual conversion paths in your data. This is the most accurate model, but it requires sufficient conversion volume to produce reliable results. Google Ads has moved toward data-driven attribution as its default for campaigns with enough data.
Cometly lets you compare attribution models side by side so you can see how CPL and channel performance shift depending on the model applied. This is useful because it reveals which channels are being systematically under-credited by your current model, and where reallocation could improve results.
A practical decision rule: if your average sales cycle is longer than two weeks and involves more than two touchpoints, last-click attribution will mislead your budget decisions. The longer and more complex your sales cycle, the more important it becomes to use a multi-touch model.
When you switch attribution models, you will typically see paid social CPL decrease and direct or organic CPL increase. This reflects the true multi-touch influence of top-of-funnel channels that last-click was ignoring. That shift in numbers is not a problem. It is the data showing you where credit was previously misallocated.
Step 5: Use Tracking Data to Cut Waste and Reallocate Budget
With accurate tracking in place and the right attribution model applied, you now have the data you need to make real budget decisions. This is where CPL reduction becomes concrete and measurable.
The key shift is sorting campaigns and ad sets by cost per qualified lead or cost per pipeline opportunity, not cost per form fill. A campaign with a low cost per form fill but a 5 percent lead-to-SQL rate is more expensive than a campaign with a higher cost per form fill and a 40 percent lead-to-SQL rate. The first metric looks better on the surface. The second one is what actually matters for your business.
How to structure your budget review:
Pause or reduce budget on high-volume, low-quality campaigns: If a campaign generates a lot of leads but very few of them progress to SQL or opportunity stage, that campaign is filling your CRM with noise and your sales team's calendar with unproductive meetings. Reducing that spend frees budget for campaigns that produce real pipeline.
Increase budget on campaigns with a clear path to revenue: Look for campaigns where the data shows a consistent pattern from ad click to closed deal. These are your highest-leverage investments. Cometly's AI recommendations surface these patterns by analyzing which ads and audiences correlate with downstream revenue outcomes, not just form fills.
Look for audience and creative combinations with favorable sales cycle metrics: Some audiences convert faster and at higher rates than others. If your data shows that a particular LinkedIn audience segment has a shorter average sales cycle and a higher close rate, that is a signal to invest more in that segment and potentially use it as a model for prospecting in other channels.
A useful framework for making these decisions: calculate your target CPL by working backward from your average contract value and close rate. If your average deal is worth a certain amount and you close a predictable percentage of SQLs, you can define exactly how much you can afford to pay per qualified lead and remain profitable. Use that number as your budget decision threshold across all channels.
One important caution: do not cut channels too quickly after improving your tracking. Ad platform algorithms need time to re-optimize toward the new, higher-quality conversion signals you are now sending. Give them two to four weeks after any significant change to your conversion event setup before evaluating performance. Cutting too early means you are judging the algorithm before it has had a chance to learn from the better data you provided.
Step 6: Build a Reporting Loop to Keep CPL Trending Down
Reducing CPL is not a one-time project. It is an ongoing process that requires a consistent reporting cadence connecting ad spend to pipeline and revenue outcomes. Without that cadence, tracking improvements erode over time, budget decisions revert to gut instinct, and CPL creeps back up.
The goal is a single dashboard that gives you a complete picture of performance without requiring you to manually pull data from multiple platforms and reconcile it in a spreadsheet. That reconciliation process is time-consuming and error-prone, and it delays the decisions you need to make.
What your reporting dashboard should show:
CPL by channel and campaign: Not cost per form fill. Cost per qualified lead, where a qualified lead is defined by your CRM data, not just ad platform attribution.
Lead-to-SQL rate by source: This metric tells you which channels produce leads that actually convert to pipeline. A channel with a high lead-to-SQL rate is more valuable than its CPL alone suggests.
Cost per pipeline opportunity: This connects ad spend directly to the opportunities your sales team is working. It is the metric that finance and leadership care about most, and it is the one that justifies or challenges your channel mix.
Cometly provides a unified attribution dashboard that pulls data from all connected ad platforms and your CRM, eliminating the need to manually reconcile data across tools. You can see CPL, pipeline contribution, and revenue attribution in one view, updated in real time.
Beyond the weekly dashboard review, build a monthly conversion event quality review into your process. Look at each lead source and ask whether the leads it produces are actually closing at the rate you expected. If a source consistently underperforms, adjust the conversion value weight you assign to it in your ad platforms so the algorithm deprioritizes that audience over time.
Finally, feed enriched conversion data back to Meta, Google, and other ad platforms on a regular schedule. This is not a one-time upload. Ad platform algorithms improve their targeting continuously as they receive more data about which users become customers. The teams that maintain this feedback loop consistently see their targeting quality improve quarter over quarter, which compounds the CPL reduction you achieved in the earlier steps.
The success indicator for this step is straightforward: CPL decreases quarter over quarter while lead quality, measured by SQL rate and pipeline value, holds steady or improves. If CPL goes down but so does your SQL rate, you have cut the wrong things. If both trend in the right direction, your tracking loop is working.
Putting It All Together
Reducing cost per lead with better conversion tracking follows a clear sequence. Audit what you are currently measuring. Close the gaps with server-side tracking. Connect CRM data so ad platforms optimize toward real buyers. Choose an attribution model that reflects your actual sales cycle. Cut waste based on qualified lead data. Build a reporting loop to sustain the improvement.
Each step depends on having accurate, complete data flowing between your ad platforms, website, and CRM. Without that foundation, every budget decision you make is based on incomplete information, and your CPL reflects that.
The teams that reduce CPL most effectively are not necessarily spending more. They are spending on the right things because their tracking tells them what the right things actually are. That clarity comes from the infrastructure described in this guide.
Cometly is built specifically for this workflow, connecting every touchpoint from ad click to closed revenue so B2B SaaS marketing teams can make budget decisions on real pipeline data rather than surface-level form fills. It captures every touchpoint, surfaces AI-driven recommendations on which campaigns are driving actual revenue, and feeds enriched conversion data back to your ad platforms to continuously improve targeting quality.
If you are ready to see which campaigns are actually driving revenue and start making budget decisions based on pipeline data, get your free demo and start capturing every touchpoint to reduce your cost per lead with confidence.