Most B2B SaaS marketing teams can tell you how many leads they generated last month. Far fewer can tell you which campaigns actually drove closed-won revenue. That gap between marketing activity and business outcomes is one of the most persistent challenges in modern SaaS growth.
When marketing cannot prove its impact on revenue, budgets get cut, strategies stall, and teams lose credibility with leadership. It is a frustrating position to be in, especially when you know your campaigns are working but cannot show the numbers to back it up.
This guide is for marketing leaders, growth teams, and operators who are done guessing. Whether you are running paid ads across multiple channels, managing a complex sales cycle, or trying to justify spend to a CFO, connecting marketing to revenue requires a deliberate system, not just better reporting.
You will learn how to build that system from the ground up: defining the right conversion events, implementing reliable tracking, choosing attribution models that reflect your actual sales process, and using that data to make smarter decisions about where to invest. Each step builds on the last, so by the end you will have a clear framework for turning your marketing data into a single source of truth that links ad spend directly to pipeline and closed revenue.
This is not about vanity metrics or surface-level dashboards. It is about understanding which sources actually convert, which campaigns drive pipeline velocity, and how to feed better data back into your ad platforms to improve targeting and ROI.
Let us get into it.
Step 1: Define the Conversion Events That Actually Matter
Before you configure a single pixel or build a single dashboard, you need clarity on what you are actually trying to measure. This sounds obvious, but it is where most teams go wrong. They track everything and end up understanding nothing.
Start by identifying the key moments in your customer journey that signal real buying intent. For most B2B SaaS companies, these include demo requests, free trial signups, sales-qualified leads, pipeline opportunities created, and closed-won deals. These are the events that have a direct relationship with revenue.
Now map each event to a specific stage in your sales funnel. Every conversion should carry a clear business meaning, not just a tracking label. A form fill is only meaningful if you know which funnel stage it represents and what typically happens next.
Here is a distinction that changes how you optimize campaigns:
Micro-conversions: Lower-intent actions like page visits, content downloads, webinar registrations, or email opens. These signal interest but rarely signal purchase readiness on their own.
Macro-conversions: High-intent actions directly tied to pipeline creation or revenue, such as a booked demo, a trial-to-paid conversion, or a closed-won deal recorded in your CRM.
Many teams make the mistake of optimizing campaigns toward micro-conversions because they are easier to measure and generate larger numbers. The result is campaigns that look successful on paper but contribute little to actual revenue. Optimizing toward the wrong signal trains your ad platforms toward the wrong audience.
Before you configure any tracking, align your marketing and sales teams on shared definitions. What exactly qualifies as a marketing-qualified lead? At what point does an opportunity enter the pipeline? How is a won deal recorded in your CRM? These definitions need to be consistent across both teams, or your attribution data will mean different things to different people.
A practical exercise: write down every conversion event you currently track, then ask yourself which ones are directly tied to pipeline or revenue. If you cannot draw a clear line, that event probably should not be a primary optimization signal.
Success indicator: You can list five or fewer conversion events that map directly to pipeline or revenue stages, and every person on your marketing and sales team agrees on what each one means.
Step 2: Implement Reliable Tracking Across Every Channel
Once you know what to measure, you need to make sure you are actually capturing it accurately. Unreliable tracking is the silent killer of marketing attribution. You can have the best attribution model in the world, but if your data is incomplete, your insights will be wrong.
Start with UTM parameters. These are the foundation of source-level attribution, and they need to be applied consistently across every paid and organic campaign. That means every ad, every email link, every social post, and every partner referral should carry UTM values for source, medium, campaign, content, and term where applicable. Inconsistent UTM usage is one of the most common reasons attribution data breaks down. Enforce it as a team standard, not a best-effort practice.
Next, address the growing problem of data loss at the pixel level. Browser-based tracking has become increasingly unreliable. Ad blockers, iOS privacy changes, and browser cookie restrictions mean that a meaningful portion of conversions are never recorded by client-side pixels. If you are relying solely on the Meta pixel or Google tag to capture conversion data, you are working with an incomplete picture.
Server-side tracking and Conversion API integrations solve this problem. Meta's Conversions API (CAPI) and Google's Enhanced Conversions send conversion data directly from your server to the ad platform, bypassing client-side limitations entirely. This results in more complete data, better attribution accuracy, and improved ad platform optimization. Implementing these integrations should be a priority, not an afterthought.
Your CRM is the other critical piece. Every lead that enters your system should have the original source captured at the moment of creation. This is what allows you to trace revenue closed six months later back to the campaign that generated the initial interest. If lead source data is missing or inconsistently recorded in your CRM, revenue attribution becomes impossible.
First-party data enrichment adds another layer of accuracy. Before sending conversion events back to ad platforms, enrich them with lead quality signals from your CRM: job title, company size, industry, or any qualification criteria your sales team uses. This helps ad platforms optimize toward audiences that resemble your actual buyers, not just people who fill out forms.
Common pitfall: Relying solely on pixel-based tracking results in significant data loss. Many teams do not realize how much conversion data they are missing until they compare pixel-reported conversions against CRM-recorded leads for the same period. The gap is often larger than expected.
Success indicator: Conversion data in your ad platforms matches or closely aligns with what your CRM records for the same time period. If there is a large discrepancy, your server-side tracking needs attention.
Step 3: Choose an Attribution Model That Reflects Your Sales Process
Attribution models determine how credit is distributed across the touchpoints in a customer journey. Choosing the wrong model does not just affect your reports; it affects which campaigns you scale and which ones you cut. The stakes are high.
Here is a quick overview of the core models:
First-touch attribution: Gives 100% of the credit to the first interaction a prospect had with your brand. Useful for understanding which channels generate initial awareness.
Last-click attribution: Gives 100% of the credit to the final touchpoint before conversion. This is the default in most ad platforms and is deeply problematic for B2B SaaS.
Linear attribution: Distributes credit equally across all touchpoints in the journey. Simple and fair, but treats every interaction as equally important regardless of timing or intent.
Time-decay attribution: Gives more credit to touchpoints that occurred closer to the conversion. Useful for shorter sales cycles where recency correlates with influence.
Data-driven attribution: Uses machine learning to assign credit based on actual conversion patterns across your data set. The most accurate model when you have sufficient volume, but requires meaningful data to function well.
For B2B SaaS teams with long sales cycles, last-click attribution is particularly misleading. When buyers research for weeks or months and interact with multiple channels before converting, last-click systematically undercredits the awareness and nurturing channels that initiated buying intent. You end up over-investing in bottom-of-funnel channels and neglecting the campaigns that actually started the conversation.
Multi-touch attribution gives a more accurate picture for most B2B SaaS companies. It distributes credit across the full customer journey, revealing which channels work together to move buyers from awareness to decision. This is especially valuable when you are running campaigns across paid search, paid social, content, and outbound simultaneously.
Your attribution model should also match your sales motion. Sales-led companies with long enterprise cycles often benefit from pipeline attribution models that credit touchpoints up to the point of opportunity creation. Product-led growth companies may prioritize trial-to-paid conversion attribution, where the focus is on which channels drive users who activate and eventually convert to paying customers.
Common pitfall: Using the default attribution model in your ad platform without questioning whether it reflects how your customers actually buy. Most platforms default to last-click or a short attribution window that does not capture the full B2B sales cycle.
Success indicator: Your attribution model produces channel-level insights that align with what your sales team observes about where deals actually originate. If your model says LinkedIn drives zero revenue but your sales team regularly hears prospects mention your LinkedIn content, your model needs adjustment.
Step 4: Connect Your Ad Platforms, CRM, and Revenue Data
This is the step where the system comes together. Individual data sources are useful in isolation, but the real insight comes from connecting them into a unified view. When your ad spend data, CRM pipeline data, and revenue data all live in separate tools with no shared layer, you are forced into manual reconciliation that is slow, error-prone, and always out of date.
Start by integrating your ad platforms with your CRM. This means creating a data flow where lead and deal information can be matched back to the campaigns and channels that generated them. Most CRMs support native integrations with major ad platforms, and many attribution tools offer pre-built connectors that make this faster to set up.
The platforms you need to connect typically include Meta Ads, Google Ads, LinkedIn Ads, and any other channels where you are running paid campaigns. Each integration should pass lead source data into the CRM and ideally allow you to send conversion events back to the ad platform for optimization purposes.
Next, connect your billing or revenue system. For many B2B SaaS companies, this means integrating Stripe or another payment processor with your marketing data. This is the step that most teams skip, and it is the reason they can report on pipeline but not on actual revenue. When your Stripe data is connected to your ad data, you can see which campaigns generated customers who actually paid, not just prospects who expressed interest.
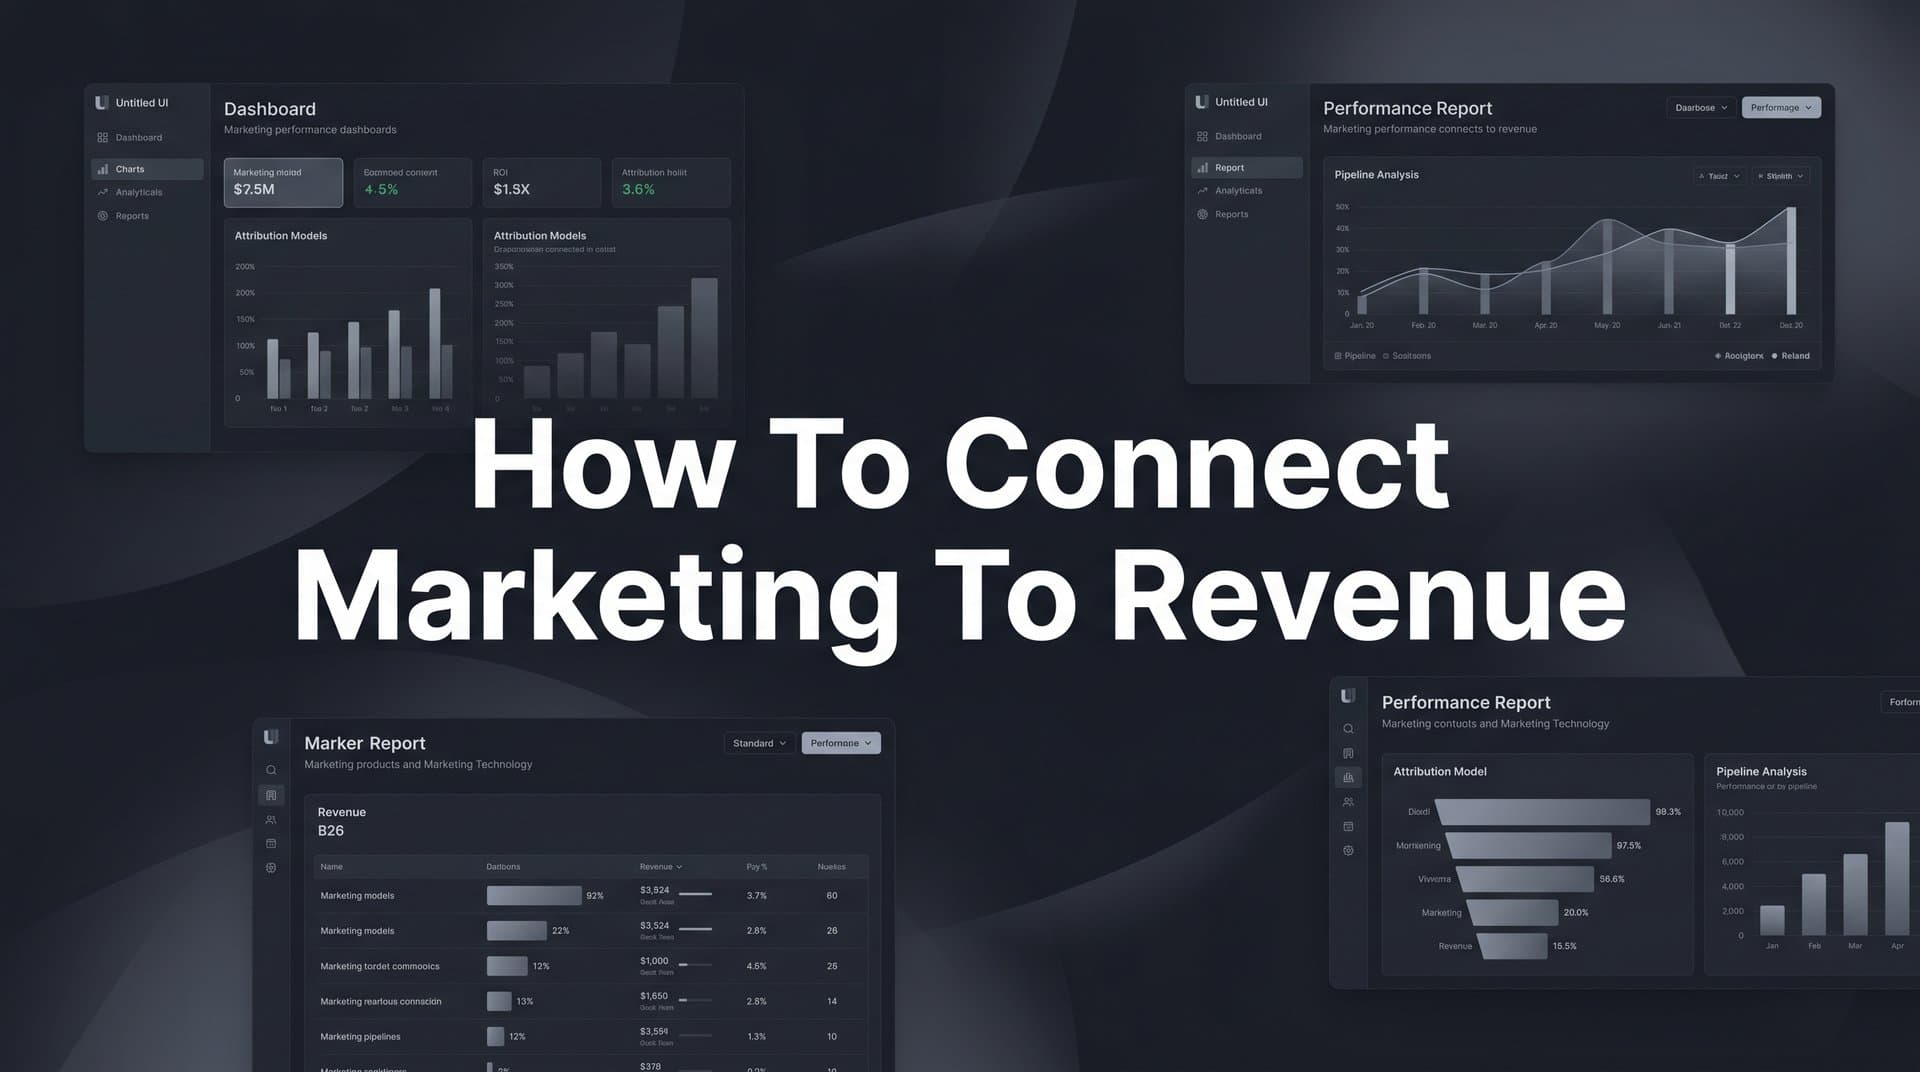
A marketing attribution platform serves as the central hub that joins all of these data sources together. Rather than building custom integrations between every tool, an attribution platform ingests data from your ad platforms, CRM, and revenue systems and produces a unified view of the customer journey from first ad click to closed-won deal.
This is exactly what Cometly is built to do. It connects your ad platforms, CRM, and revenue data into a single attribution hub, tracks every touchpoint across the full customer journey, and gives you a real-time view of which campaigns are generating pipeline and revenue. With over 70 native integrations, the setup is significantly faster than building a custom data stack from scratch.
Common pitfall: Keeping ad data, CRM data, and revenue data in separate tools with no unified view. This forces manual reconciliation, introduces errors, and creates reporting lag that makes it impossible to make timely budget decisions.
Success indicator: You can open a single dashboard and see ad spend alongside pipeline created and revenue closed, broken down by channel and campaign, without needing to export data from multiple tools and combine it manually.
Step 5: Analyze Performance by Pipeline and Revenue, Not Just Leads
Once your data is connected, you need to change how you measure success. Most marketing teams default to lead volume metrics because they are easy to track and produce impressive-looking numbers. But lead volume is a proxy metric, and proxies can be misleading.
A campaign that generates many leads but few closed deals is not a successful campaign. It is a campaign that is consuming budget without producing revenue. The only way to know which campaigns are actually working is to measure them against pipeline created and revenue closed.
Shift your primary reporting metrics to these:
Cost per pipeline opportunity: How much ad spend does it take to generate one qualified pipeline opportunity, by channel and campaign? This metric separates campaigns that create real buying intent from those that generate noise.
Cost per closed deal: How much total marketing investment does it take to close one customer, by channel and campaign? This is the metric that directly connects marketing spend to revenue outcomes.
Revenue influenced by channel: Which channels and campaigns contributed to deals that closed, even if they were not the final touchpoint? This is where multi-touch attribution becomes essential.
Customer journey analytics add another layer of insight. By analyzing which touchpoint sequences are most commonly associated with closed deals, you can identify the combinations of channels and content that move buyers most effectively through your funnel. You might discover that prospects who engage with a specific ad type before a demo request close at a significantly higher rate than those who come through other paths.
Common pitfall: Optimizing campaigns toward lead volume because it is easier to measure, while ignoring downstream conversion quality. This creates a feedback loop where you scale campaigns that look productive but do not generate revenue.
Success indicator: You can rank your top five campaigns by revenue generated, not just by leads or clicks. If you cannot produce that ranking today, your attribution system is not yet complete.
Step 6: Feed Better Data Back Into Your Ad Platforms
Here is where the system starts to compound. Most marketers think of attribution as a reporting function: you collect data, analyze it, and make decisions. But there is a second function that is equally valuable: using that data to improve the performance of your ad campaigns by sending better signals back to the platforms running them.
Ad platforms like Meta and Google use machine learning to optimize campaign delivery toward conversion events. The quality of their optimization depends entirely on the quality of the signals you give them. When you send only top-of-funnel events like page views or form submissions, you are training their algorithms to find more people who look like form fillers. That is not the same as finding more people who look like buyers.
When you send revenue and pipeline signals back to ad platforms via their conversion APIs, you give their algorithms a fundamentally better optimization target. A closed-won event sent back to Meta tells its system: this is what an actual customer looks like. Find more of them. Over time, this improves audience quality, reduces wasted spend on low-intent traffic, and increases the proportion of leads that convert to pipeline and revenue.
The technical mechanisms that make this possible include offline conversion uploads, server-side event syncing, and Conversion API integrations. These allow you to pass CRM and revenue events back to ad platforms without relying on browser-based tracking. Cometly's server-side tracking and Conversion API integration capabilities are designed specifically for this use case, making it straightforward to send enriched, conversion-ready events back to Meta, Google, and other platforms.
First-party data enrichment amplifies this further. When you enrich conversion events with firmographic or behavioral data from your CRM before sending them back to ad platforms, you give those platforms more signal to work with when building lookalike audiences and refining targeting.
Common pitfall: Only sending top-of-funnel events back to ad platforms, which trains their algorithms toward the wrong outcomes. Many teams set this up once and never revisit which events they are sending, even as their conversion funnel evolves.
Success indicator: Your ad platform audience quality improves over time, and cost per qualified lead or cost per pipeline opportunity decreases as the algorithms learn from better conversion signals.
Step 7: Build a Reporting Cadence That Drives Decisions
Data without a decision-making process is just noise. The final step is building a reporting cadence that turns your attribution data into specific, timely actions. The goal is not to create comprehensive reports that look impressive in leadership meetings. The goal is to make better budget and strategy decisions faster.
Structure your reporting around two cycles:
Weekly performance review: Cover ad spend, pipeline created, and revenue influenced by channel for the current period. Flag any significant changes in cost per pipeline opportunity or conversion rates. Use this review to make near-term decisions: pausing underperformers, increasing budget on campaigns that are generating quality pipeline, or adjusting targeting based on recent lead quality data.
Monthly attribution report: Show which channels and campaigns contributed to closed revenue during the period, using your chosen attribution model. This is the report you share with leadership and with your sales team. It should answer the question: where did our revenue come from, and what should we do differently next month?
Sharing revenue attribution data with your sales team creates alignment that is hard to achieve any other way. When sales can see which lead sources produce the best downstream outcomes, they can provide feedback that improves marketing targeting. And when marketing can see how their leads perform through the sales process, they can optimize campaigns toward the characteristics of leads that actually close.
AI-driven insights make this process faster and more reliable. Rather than manually scanning dashboards for patterns, platforms like Cometly surface anomalies, identify high-performing campaigns worth scaling, and flag underperformers before significant budget is wasted. This is the difference between reactive reporting and proactive optimization.
Establish clear thresholds for budget decisions before you need to make them. Define in advance what cost per pipeline opportunity triggers a budget pause, what revenue ROI justifies a budget increase, and what reallocation criteria you will use when one channel outperforms another. Decision frameworks made in advance are more objective and faster to execute than decisions made under pressure in the moment.
Common pitfall: Building reports that look comprehensive but do not lead to specific budget or strategy decisions. If your weekly review ends without a clear list of actions, the reporting process is not yet working.
Success indicator: Every major budget decision your team makes is backed by attribution data, and marketing can demonstrate its revenue contribution clearly in any leadership review, without needing to prepare a special presentation or pull data from multiple sources.
Putting It All Together
Connecting marketing to revenue is not a one-time project. It is a system you build, calibrate, and improve over time. The seven steps in this guide give you the foundation: clear conversion events, reliable tracking, the right attribution model, integrated data sources, revenue-focused analysis, enriched ad platform signals, and a reporting cadence that drives real decisions.
When this system is working, marketing stops being a cost center and becomes a measurable growth driver. You can walk into any leadership meeting and show exactly which campaigns generated pipeline, which channels drove closed revenue, and where the next dollar of ad spend should go.
The compounding effect is significant. Better data feeds better ad platform optimization. Better optimization produces higher-quality leads. Higher-quality leads close at better rates. And better closed rates justify larger budgets, which you can now allocate with confidence because you know what works.
Cometly is built to make this entire process faster and more accurate for B2B SaaS teams. It connects your ad platforms, CRM, and revenue data into a single attribution hub, tracks every touchpoint from first ad click to closed-won deal, and uses AI to surface the insights that matter most. From server-side conversion tracking to Conversion API integration to pipeline and revenue attribution, it is designed specifically for the complexity of B2B SaaS sales cycles.
If you are ready to stop guessing and start making data-driven decisions about your marketing spend, Get your free demo today and see how Cometly can help your team build a complete revenue attribution system.