Every marketing leader has faced this moment: you walk into a budget review confident in your campaigns, and the CFO asks a simple question: "What did we actually get back from that spend?" If you cannot answer with data that connects ad dollars to closed revenue, the conversation gets uncomfortable fast.
CFOs think in terms of business outcomes, pipeline, and payback periods. They are not interested in impressions, click-through rates, or engagement scores unless those metrics connect directly to revenue. The gap between how marketers measure success and how finance teams evaluate it is one of the most persistent challenges in B2B SaaS.
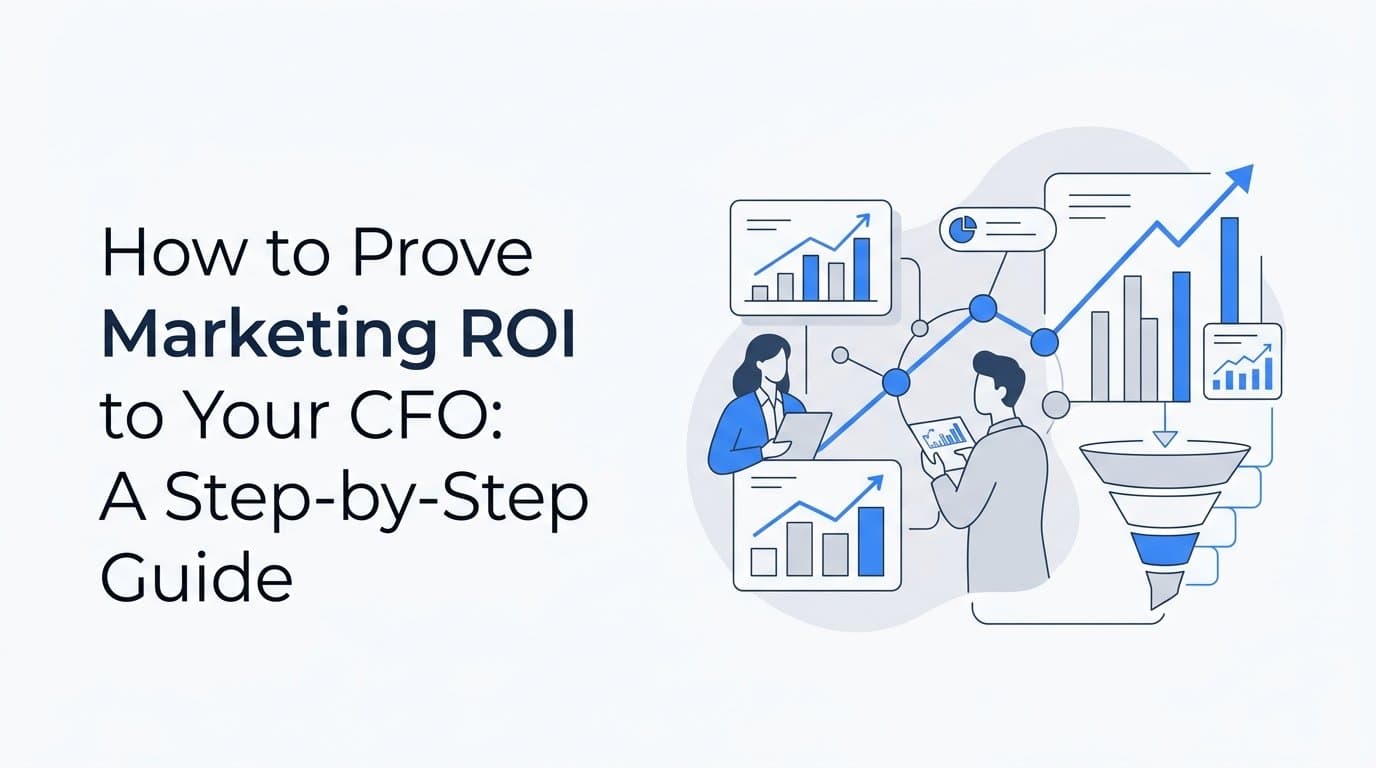
Proving marketing ROI is not just about running reports. It requires building a measurement framework that speaks the CFO's language, connecting every campaign touchpoint to actual revenue outcomes, and presenting that data in a format that earns trust and drives budget decisions.
This guide walks you through exactly how to do that. You will learn how to align on the right metrics, build attribution infrastructure that captures the full customer journey, and present a ROI case that a CFO cannot dismiss. Whether you are preparing for a quarterly business review, defending your budget, or making the case for increased ad spend, these steps will give you the foundation to walk into that conversation with confidence.
Step 1: Understand What Your CFO Actually Wants to See
Before you build a single report or pull a single dashboard, you need to understand the lens your CFO uses to evaluate the business. Finance leaders are not anti-marketing. They are pro-return. And the way they assess return looks very different from how most marketing teams report performance.
CFOs evaluate marketing through a financial framework. The questions they are asking are not "how many people saw our ads?" but rather "how much did we spend to acquire a customer, how long until we recoup that investment, and how much revenue did marketing directly generate?" These are fundamentally different questions than the ones most marketing dashboards are designed to answer.
The four metrics that tend to matter most in CFO conversations are:
Customer Acquisition Cost (CAC): The total marketing and sales spend divided by the number of new customers acquired in a given period. This tells finance how efficiently the business is growing.
Marketing-Sourced Revenue: The total closed-won revenue that originated from a marketing-generated lead or touchpoint. This is the clearest proof that marketing spend is generating business outcomes.
CAC Payback Period: How many months it takes to recover the cost of acquiring a customer through recurring revenue. A shorter payback period signals healthier unit economics.
Return on Ad Spend (ROAS) Tied to Closed Revenue: Not just conversions or leads, but actual revenue generated per dollar of ad spend. This is the number that directly answers the CFO's core question.
Vanity metrics have no place in this conversation unless they are connected to one of these four outcomes. If you lead with impressions or engagement rates, you are signaling that you do not understand how finance evaluates the business. That erodes credibility before you have even made your case.
One practical move that many marketing leaders overlook: before building any report, ask your CFO directly what questions they are trying to answer about marketing spend. This simple conversation will tell you exactly what to measure and how to frame it. It also positions you as a business partner rather than a department asking for budget.
Align your reporting cadence with how finance reviews the business. Most CFOs operate on monthly and quarterly cycles. If your marketing reports come out on a different schedule, they will not be part of the conversations that matter. Sync your rhythm with theirs.
Step 2: Build Attribution Infrastructure That Captures Revenue, Not Just Leads
Here is where most B2B SaaS marketing teams hit a wall. They have solid lead generation reporting. They know how many form fills came from Google, how many trials came from LinkedIn, how many MQLs were generated last quarter. But when the CFO asks how much revenue those leads produced, the data trail goes cold.
This is the attribution gap. And it is the single biggest reason marketing leaders struggle to prove ROI to finance.
Closing that gap requires end-to-end attribution infrastructure that connects the first ad click to a closed-won deal in your CRM. That means your tracking cannot stop at the conversion event on your website. It needs to follow the prospect all the way through the sales funnel, through deal stages, through the final close.
There are several layers to building this infrastructure correctly:
Server-Side Conversion Tracking: Browser-based pixels miss a significant portion of conversions due to ad blockers, iOS privacy changes, and cookie restrictions. Server-side tracking sends conversion data directly from your server to ad platforms, capturing events that client-side pixels would otherwise lose. This gives you a more accurate foundation for all downstream reporting.
Conversion API Integrations: Platforms like Meta and Google offer Conversion API connections that allow you to send first-party event data directly from your backend. This improves signal quality for ad platform optimization and ensures your attribution data reflects actual user behavior rather than sampled or estimated data.
CRM Integration: Your ad platforms need to know what happened to the leads they generated. By connecting Meta, Google, and LinkedIn to your CRM, you can push deal stage updates and closed-won events back to campaign-level reporting. This is what allows you to see which specific campaigns generated revenue, not just leads.
Revenue Data Integration: For B2B SaaS companies using subscription billing tools like Stripe, connecting revenue data to your attribution layer means you can tie actual monthly recurring revenue back to the original marketing source. This is the clearest possible proof of marketing ROI.
Cometly is built specifically to create this attribution layer. It connects your ad platforms, CRM events, and revenue data into a single unified view, so you can see exactly which campaigns drove closed-won deals and what those deals were worth. Instead of piecing together data from five different tools, you have one source of truth that speaks directly to the CFO's questions.
A common pitfall to avoid: relying solely on last-click attribution will consistently undervalue top-of-funnel channels. A LinkedIn campaign that introduced a prospect to your brand may never get credit if your attribution model only looks at the final touchpoint before conversion. That leads to bad budget decisions and channels that genuinely contribute to revenue getting cut.
Step 3: Choose the Right Attribution Model for B2B Sales Cycles
Not all attribution models are created equal, and in B2B SaaS, choosing the wrong one will give you a distorted view of what is actually driving revenue. The model you choose determines which channels get credit, which get cut, and ultimately how you allocate budget.
B2B deals typically involve multiple decision-makers and touchpoints spread across weeks or months. A prospect might discover you through a Google ad, attend a LinkedIn webinar, read a comparison article, and then respond to a retargeting ad before booking a demo. Single-touch attribution models cannot capture that complexity.
Here is a plain-language breakdown of the main options:
First-Touch Attribution: Gives 100% of the credit to the first interaction a prospect had with your brand. Useful for understanding which channels generate awareness, but it ignores everything that happened after that initial contact. For a CFO conversation, this model tends to overvalue top-of-funnel channels and undervalue the channels that actually move deals forward.
Last-Click Attribution: Gives 100% of the credit to the final touchpoint before a conversion. This is the default model in many ad platforms and web analytics tools. It tends to overvalue bottom-of-funnel channels like branded search while making awareness and nurture channels look like they contribute nothing. Most B2B marketers who rely on last-click attribution are making budget decisions based on incomplete information.
Linear Attribution: Distributes credit equally across all touchpoints in the customer journey. More balanced than single-touch models, but it treats every interaction as equally important, which is rarely accurate. A quick email open and a 30-minute product demo get the same weight.
Data-Driven Attribution: Uses algorithmic weighting based on actual conversion patterns in your data. It assigns credit based on how much each touchpoint actually influenced the outcome, rather than applying a fixed rule. For complex B2B sales cycles, this is generally the most accurate model available.
For CFO conversations, multi-touch or data-driven attribution gives you the most defensible view of channel contribution. It allows you to show, for example, that LinkedIn consistently initiates conversations that convert, even if it rarely appears as the last touch before a deal closes. That is a critical insight when you are making the case for top-of-funnel spend.
A practical tip: present two attribution models side by side when you go into a CFO meeting. Show what last-click says versus what multi-touch says about the same campaign spend. This does two things. It demonstrates analytical sophistication, and it shows your CFO that you understand the limitations of simple attribution. That builds credibility in a way that a single number never can.
Step 4: Calculate the Metrics That Matter in Finance Terms
Once your attribution infrastructure is in place, you need to translate the data into the financial language your CFO already uses. This is not about dumbing things down. It is about speaking the same language so your numbers land with the right weight.
Start with the core formulas:
Customer Acquisition Cost (CAC): Total Marketing and Sales Spend divided by the number of new customers acquired in the same period. If you spent $200,000 on marketing and sales in a quarter and acquired 40 new customers, your CAC is $5,000. This is the baseline metric your CFO will use to assess efficiency.
Marketing ROI: Revenue Attributed to Marketing minus Marketing Spend, divided by Marketing Spend, multiplied by 100. This gives you a percentage return on every dollar invested in marketing. If marketing-sourced revenue was $600,000 and marketing spend was $200,000, the ROI is 200%. That is a number finance understands immediately.
CAC Payback Period: CAC divided by Average Monthly Recurring Revenue per Customer. If your CAC is $5,000 and your average customer generates $500 per month in MRR, your payback period is 10 months. This metric tells the CFO how quickly the business recoups its customer acquisition investment, which directly affects cash flow planning.
Channel-Level ROAS Tied to Closed Revenue: Revenue attributed to a specific channel divided by the total spend on that channel. This is not ROAS based on lead value or pipeline. It is ROAS based on actual closed-won deals. This is the version of ROAS that a CFO will trust.
Beyond the formulas, you need to distinguish between marketing-sourced pipeline and marketing-influenced pipeline. Marketing-sourced pipeline refers to deals where marketing generated the original lead. Marketing-influenced pipeline includes deals where marketing touched the prospect at some point, even if the lead originated elsewhere. Both matter, but they are different claims and should be reported separately to avoid overstating marketing's contribution.
Segment all of these metrics by campaign, channel, and time period. A single blended number tells a CFO very little. Trend lines over three to six months tell a story. Show how CAC has moved over time, how ROAS has shifted as you optimized campaigns, and how pipeline contribution has grown. Trends build confidence in a way that point-in-time snapshots cannot.
Always present these numbers in the context of company targets. If the business goal is a 3:1 LTV to CAC ratio, show exactly where marketing stands relative to that benchmark. Connecting your metrics to company-level goals positions marketing as a strategic function, not a cost center.
Step 5: Build a CFO-Ready Marketing ROI Dashboard
A dashboard built for marketers is not the same as a dashboard built for finance. Marketers want granularity: keyword-level data, audience breakdowns, creative performance, funnel stage conversion rates. CFOs want clarity: is the spend generating a return, and is that return improving over time?
If you hand a CFO a marketing dashboard full of operational metrics, you will lose them in the first 30 seconds. The goal is to build a view that answers their core question in under a minute.
The key views to include in a CFO-ready dashboard are:
Total Marketing-Sourced Revenue: The top-line number showing how much closed revenue originated from marketing activity. This should be visible immediately, with a trend line showing month-over-month movement.
Blended ROAS Across All Channels: A single number showing the aggregate return on all marketing spend, with the ability to drill down by channel. This gives the CFO both the headline and the detail if they want it.
CAC by Acquisition Channel: Breaking CAC down by channel reveals which sources are acquiring customers most efficiently. This is one of the most actionable views for budget allocation conversations.
Pipeline Contribution by Campaign: Showing which specific campaigns generated pipeline helps connect individual marketing investments to business outcomes. This is particularly useful when defending specific budget line items.
Month-Over-Month Trend Lines: Trends are more persuasive than snapshots. Show how your key metrics are moving over time to demonstrate that marketing is improving its efficiency and impact.
Cometly provides a unified attribution dashboard that connects ad spend directly to pipeline and revenue, with more than 70 native integrations so all your data lives in one place. Instead of manually stitching together data from your ad platforms, CRM, and billing system, you get a single real-time view that is built for exactly this kind of conversation.
Real-time data matters here. If the CFO can only see marketing performance at reporting time, they are working with stale information. Giving them access to a live dashboard means they can check performance at any point and get answers without waiting for a report to be prepared. That kind of transparency builds trust faster than any presentation.
One final tip: share dashboard access with your CFO so they can self-serve answers. When finance can explore the data on their own, they stop seeing marketing as a black box. That shift in perception is worth more than any single number you could put in a slide deck.
Step 6: Present Your ROI Case With a Story, Not Just a Spreadsheet
Data alone does not win budget conversations. You can have perfect attribution, accurate formulas, and a clean dashboard, and still walk out of a CFO meeting without the budget you needed. The difference is narrative.
CFOs make decisions based on confidence in outcomes. Your job is to build that confidence by connecting the numbers to a story that makes sense. Here is a structure that works:
Start with the business goal. Frame everything in the context of what the company is trying to achieve. If the goal is to grow ARR by a specific amount this year, start there. This positions marketing as a function that is aligned with company strategy, not operating in isolation.
Show the marketing investment. Present the total spend clearly, broken down by channel. No surprises, no buried costs. Transparency here sets the tone for the rest of the conversation.
Demonstrate the revenue outcome. This is where your attribution data does the work. Show the marketing-sourced revenue, the ROAS by channel, and the CAC trend. Let the numbers tell the story of what the investment produced.
End with the forward-looking opportunity. Do not just report on the past. Show what additional investment could produce. If your current CAC is $4,000 and your LTV is $18,000, the math on incremental spend is compelling. Frame budget asks as investment decisions with projected returns, not cost requests.
Use customer journey examples to make the data tangible. Walk through how a specific prospect moved from an ad click to a closed deal, showing every touchpoint along the way. This illustrates that your attribution model captures real behavior, not just modeled assumptions.
Anticipate the objections your CFO will raise. The most common ones in B2B SaaS are: correlation versus causation (how do you know marketing caused the deal?), time lag between spend and revenue (how do you account for long sales cycles?), and channel overlap (how do you handle prospects who were touched by multiple campaigns?). Prepare clear, honest answers to each.
If there are gaps in your attribution, address them directly. Saying "we cannot yet attribute 15% of our pipeline to a specific source, and here is what we are doing to close that gap" is far more credible than pretending the data is perfect. CFOs respect intellectual honesty. It is the marketers who oversell their numbers that lose credibility over time.
Putting It All Together: Your Marketing ROI Action Plan
Proving marketing ROI to your CFO is not a one-time event. It is an ongoing discipline that requires the right infrastructure, the right metrics, and the right communication approach working together consistently.
Here is a quick-start checklist to put these steps into action:
1. Meet with your CFO to align on the four metrics that matter most: CAC, marketing-sourced revenue, CAC payback period, and ROAS tied to closed revenue.
2. Audit your current tracking setup and identify where the attribution gap exists between lead generation and closed-won revenue.
3. Implement server-side tracking and Conversion API integrations to capture first-party conversion data that browser-based pixels miss.
4. Connect your ad platforms to your CRM so deal data flows back to campaign-level reporting.
5. Choose a multi-touch or data-driven attribution model that reflects the complexity of your B2B sales cycle.
6. Calculate CAC, marketing ROI, CAC payback period, and channel-level ROAS using actual closed revenue data.
7. Build a CFO-ready dashboard focused on revenue outcomes, trend lines, and channel efficiency, and share live access with finance.
8. Prepare a narrative presentation that connects marketing investment to revenue outcomes and frames future budget asks as projected returns.
Cometly makes this entire process possible by connecting your ad spend to pipeline and closed revenue in real time. It captures every touchpoint from the first ad click to the final deal close, feeds enriched data back to your ad platforms to improve targeting, and gives your AI-driven recommendations the signal quality needed to identify what is actually working. Instead of spending hours reconciling data from disconnected tools, you have one attribution foundation that speaks directly to the CFO's questions.
The marketers who earn trust from finance are the ones who show up with revenue data, not just marketing metrics. With the right infrastructure and the right framework, that is exactly what you can do. Get your free demo today and see how Cometly maps your customer journey, closes the attribution gap, and builds the foundation you need to prove marketing ROI with confidence.