You're generating leads. Your team is running campaigns, filling the top of the funnel, and hitting MQL targets. But somewhere between "lead created" and "deal closed," something is breaking down, and you can't quite put your finger on where. Sound familiar?
This is one of the most common frustrations in B2B SaaS: a marketing team that measures success in lead volume while sales quietly struggles to close the deals coming through the door. The disconnect isn't always obvious until you look at the metric that ties both sides together: lead to close rate.
Lead to close rate is one of the most revealing numbers in your entire funnel. It tells you whether the leads your marketing is generating are actually worth generating. It connects campaign performance to revenue outcomes in a way that top-of-funnel metrics simply cannot. And when you segment it correctly, it becomes a powerful decision-making tool for where to invest, where to pull back, and where the real growth is hiding.
This article covers everything growth leaders need to know: how to define and calculate the metric, what lead to close rate benchmarks look like across different SaaS segments, which factors move the number up or down, and how attribution data transforms close rate insights into real marketing decisions.
The Metric That Connects Marketing Quality to Revenue
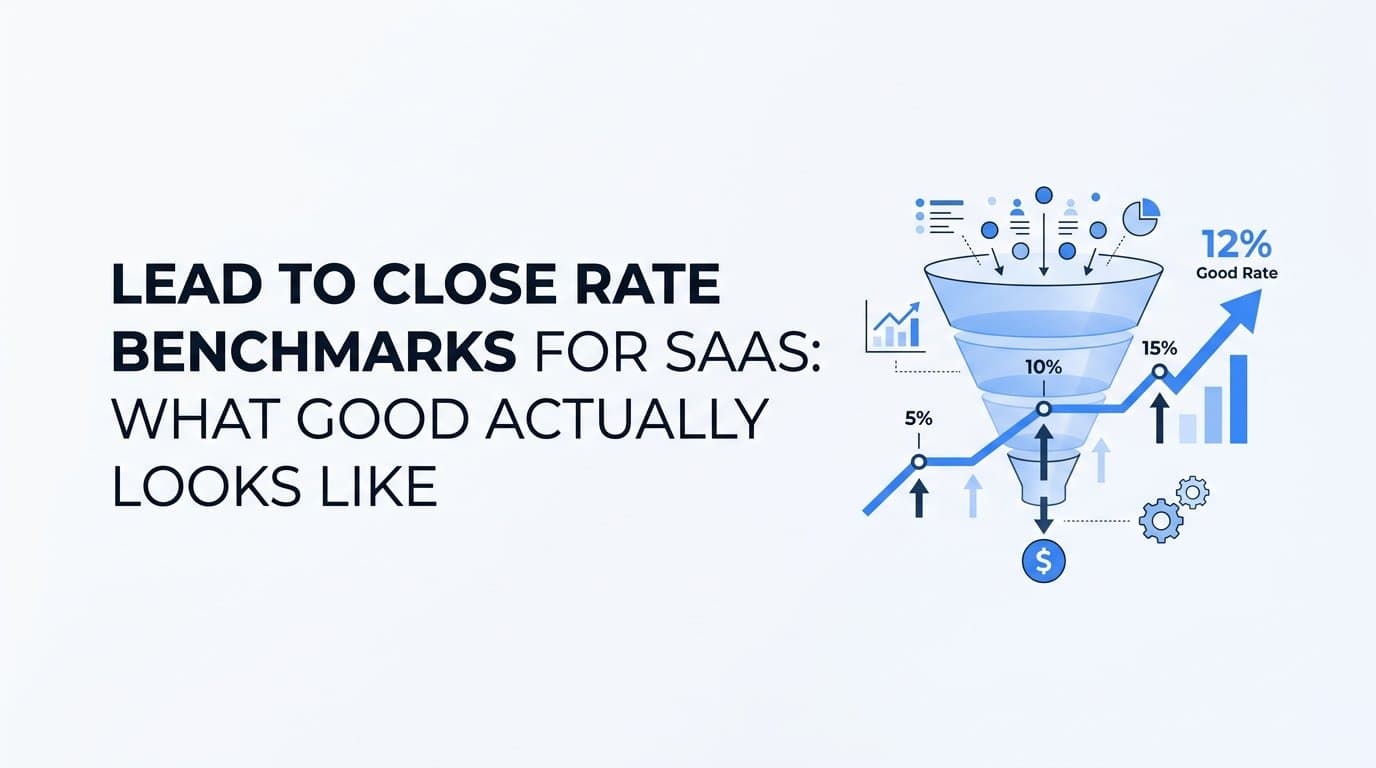
Lead to close rate measures the percentage of leads that ultimately convert into closed-won customers. The calculation is straightforward: divide the number of closed-won deals in a given period by the total number of leads generated in that same period, then multiply by 100.
Simple math, but the implications are significant. This metric forces you to look past the comfortable numbers, like cost per lead or MQL volume, and ask a harder question: are these leads actually turning into revenue?
What makes lead to close rate more meaningful than conversion rate alone is that it accounts for the full funnel. A conversion rate might tell you how many visitors filled out a form. Lead to close rate tells you how many of those visitors eventually handed over a credit card or signed a contract. That is a fundamentally different signal.
It also helps you understand where in the funnel performance is breaking down. Lead to close rate sits at the top of a hierarchy of related metrics, each measuring a specific stage transition:
MQL to SQL rate: How many marketing-qualified leads are accepted by sales as genuinely worth pursuing. This is the handoff point between marketing and sales, and it is often where misalignment shows up first.
SQL to opportunity rate: How many sales-qualified leads progress to a formal sales opportunity. This stage reflects whether the lead has real buying intent and organizational fit.
Opportunity to close rate: How many open opportunities actually result in a closed-won deal. This is where sales execution, pricing, and competitive dynamics play out.
Lead to close rate is the composite of all of these transitions. A weak number at the top could be masking a specific stage that is underperforming. Understanding the hierarchy helps you diagnose the problem rather than just observe it.
The reason growth leaders should care deeply about this metric is that it reframes what marketing success actually means. Generating 500 leads a month is not an achievement if only a handful ever close. Lead to close rate keeps the entire revenue team honest about what quality actually looks like.
What SaaS Lead to Close Rate Benchmarks Actually Look Like
Here is the honest answer about benchmarks: they vary enormously, and any single number presented as "the industry standard" should be treated with skepticism. The more useful framing is understanding the factors that drive variation, so you can interpret your own numbers in context.
Segment is one of the biggest drivers. SMB-focused SaaS products typically see higher lead to close rates because the sales cycle is shorter, fewer stakeholders are involved, and decisions happen faster. A product with a monthly contract value in the low hundreds of dollars might move from lead to closed deal in a matter of days or weeks. The funnel is compressed, and close rates reflect that speed.
Enterprise SaaS looks completely different. Deals involve procurement teams, security reviews, legal negotiations, and multiple executive sponsors. The timeline from first touch to closed-won can stretch across months or even quarters. With more stages, more stakeholders, and more opportunities for deals to stall or die, close rates are naturally lower. That does not mean the business is underperforming. It means the sales motion is different.
Average contract value (ACV) is closely tied to this dynamic. Lower ACV products, especially those with product-led growth or self-serve onboarding, often see different close rate patterns because the buying decision is lower stakes. A user can sign up, try the product, and convert without ever talking to a sales rep. In these motions, the concept of a "lead" might not even apply in the traditional sense.
Higher ACV products with sales-led motions involve more deliberate evaluation cycles. Leads take longer to mature, and the funnel has more defined stages where attrition can occur. Close rates may be lower in absolute terms, but the revenue impact of each closed deal is significantly higher.
This is why industry-wide benchmarks are directional at best. They give you a rough sense of whether your numbers are in a reasonable range, but they cannot account for your specific product category, pricing model, sales motion, or target market. A close rate that looks low compared to an SMB SaaS benchmark might be perfectly healthy for an enterprise product with a nine-month sales cycle.
The most useful benchmark is your own historical data, tracked consistently over time and segmented by channel and lead source. When you can see how your close rate has moved quarter over quarter, and which channels are contributing to that movement, you have something far more actionable than an industry average.
Why Your Lead Source Changes Everything
Not all leads are created equal, and your close rate data will tell you exactly that if you look at it the right way.
Leads from different acquisition channels carry fundamentally different intent levels. An organic search lead who found your product by searching for a specific solution to a specific problem is in a different mental state than someone who saw a broad awareness ad on LinkedIn and clicked out of curiosity. Both might fill out the same form. Only one is likely to close.
Referral leads, particularly those that come from existing customers or trusted peers, often close at higher rates than other channels because they arrive with built-in credibility and social proof. The evaluation process is shorter because trust is already established.
Outbound leads, generated through SDR prospecting or cold email, can vary widely depending on how well the targeting aligns with your ideal customer profile. High-quality outbound into a well-defined ICP can produce strong close rates. Broad outbound with loose targeting tends to create pipeline that looks healthy on paper but stalls repeatedly.
Paid social leads are often the most misunderstood. High lead volume from paid social campaigns can mask a low close rate if the targeting is optimized for form fills rather than qualified buyers. This is one of the most common ways marketing teams create the illusion of pipeline while sales struggles to close anything meaningful.
This is where attribution data becomes essential. Without knowing which channel, campaign, or ad set generated a specific lead, you cannot connect marketing activity to downstream close rates. You are making budget decisions based on volume, not value.
Channel-level close rate analysis means breaking your lead to close rate down by source so you can see exactly which channels are generating leads that actually turn into revenue. You might discover that paid search drives fewer leads than paid social but closes at a significantly higher rate. That insight changes how you allocate budget in a meaningful way.
The natural question that follows is: how do you get this data? The answer is attribution. Specifically, attribution that connects your ad platform data to your CRM closed-won events so that you can trace a closed deal back to the original touchpoint that started the journey. Without that connection, channel-level close rate analysis is not possible.
The Funnel Stages That Make or Break Your Close Rate
A low lead to close rate is rarely caused by the entire funnel performing poorly at once. More often, there is a specific stage where leads are leaking out, and that stage is where your attention needs to go.
Think of the funnel as a series of gates: lead to MQL, MQL to SQL, SQL to opportunity, and opportunity to close. Each gate has its own conversion rate, and a weakness at any one of them will drag down your overall close rate. The diagnostic question is always: which gate is the problem?
If your lead to MQL rate is low, marketing is generating leads that do not meet your qualification criteria. This might be a targeting problem, a messaging problem, or a lead scoring problem. If your MQL to SQL rate is low, sales is not accepting the leads marketing is sending. This is often a definition problem: marketing and sales are using different criteria for what a qualified lead looks like.
If your SQL to opportunity rate is low, leads are being accepted by sales but not progressing to formal opportunities. This could indicate poor follow-up speed, weak discovery conversations, or leads that looked qualified on paper but lacked real buying intent.
If your opportunity to close rate is low, the problem is more likely in the sales process itself: competitive positioning, pricing, proposal quality, or stakeholder management.
Beyond stage-by-stage analysis, certain lead quality signals tend to predict downstream close rates. Firmographic fit is one of the strongest: leads from companies that match your closed-won customer profile in terms of size, industry, and tech stack are more likely to close than leads from companies outside that profile.
Intent signals matter too. A lead that has visited your pricing page, read multiple case studies, and engaged with a product demo request is signaling something very different than a lead that downloaded a top-of-funnel ebook and went quiet.
Sales and marketing alignment on MQL definition is one of the most consistently cited drivers of pipeline quality in B2B SaaS. When marketing generates leads based on criteria that sales has validated as predictive of close, the handoff is cleaner, the pipeline is healthier, and the close rate reflects that alignment. When the two teams are working from different playbooks, the lead to close rate tends to expose that gap quickly.
How Attribution Data Turns Close Rate Insights Into Action
Knowing your close rate is a starting point. Knowing which campaigns, channels, and ad sets are driving your closed-won deals is where the real decisions get made.
Without attribution, you are looking at a blended close rate that tells you something is working or not working, but not where. You might know that 3% of your leads are closing, but you have no idea whether that 3% is coming from your paid search campaigns, your content program, your partner referrals, or some combination of all three. Budget decisions made without that information are essentially guesses.
Multi-touch attribution provides a more complete picture than last-click models, which tend to over-credit whatever touchpoint happened immediately before a conversion. In reality, B2B SaaS buyers rarely convert after a single interaction. A typical journey might involve a paid search ad that introduced the brand, a few organic content visits, a retargeting ad, and finally a direct visit to request a demo. Last-click attribution gives all the credit to the demo request. Multi-touch attribution distributes credit across the journey, giving you a more accurate view of what actually influenced the outcome.
This matters for close rate analysis because the touchpoint that gets credit for a lead is not always the touchpoint that drove the quality of that lead. If your highest-closing leads consistently have a specific first-touch channel in their journey, that is a signal worth acting on. You would miss it entirely with last-click attribution.
Server-side conversion tracking and Conversion API integrations add another layer of accuracy. When you send enriched conversion signals, including closed-won events from your CRM, back to ad platforms like Meta and Google, you give those platforms better data to optimize against. Instead of optimizing toward form fills, the algorithm learns what your actual closed customers look like and finds more of them. This is one of the most direct ways attribution data improves lead quality over time.
This is exactly what Cometly is built to do. Cometly connects your ad platform data, CRM events, and website behavior into a single view so that marketing teams can see which touchpoints are driving leads that actually close. With pipeline and revenue attribution tied back to the original ad spend, you can answer the question that matters most: which campaigns are generating closeable leads, and which ones are just generating noise? That clarity is what turns close rate from an interesting metric into an actionable one.
Practical Ways to Improve Your Lead to Close Rate
Understanding your close rate is step one. Improving it requires specific, repeatable actions tied to what your data is actually showing you.
Tighten your ICP targeting based on closed-won data. Pull your closed-won customers from the last 12 months and look for patterns: company size, industry, tech stack, geography, job title of the buyer. If certain firmographic segments close at consistently higher rates, those segments should receive a disproportionate share of your acquisition spend. If certain segments rarely close despite generating lead volume, reduce investment there regardless of how cheap the leads are.
Feed real conversion data back to your ad platforms. Most ad platforms optimize toward the conversion event you tell them to optimize toward. If that event is a form fill, you will get more form fills, including ones that never close. If you can send closed-won events back to Meta or Google through server-side tracking, the algorithm learns what your actual buyers look like and shifts optimization accordingly. This is one of the highest-leverage improvements available to most SaaS marketing teams.
Build lead scoring that reflects close rate predictors. Not all leads who fill out a form have equal downstream value. Lead scoring models that incorporate firmographic fit, engagement depth, and behavioral signals, like pricing page visits or product demo requests, help marketing and sales prioritize leads that are more likely to close. Score inflation is a common failure mode: if everything scores high, scoring is not doing its job.
Review close rate by channel on a regular cadence. This is not a quarterly exercise. Close rate by channel should be reviewed at least monthly so that performance trends are visible before they become expensive mistakes. If a channel's close rate is declining over multiple periods, that is an early warning sign worth investigating before you have spent another quarter's budget on leads that will not convert.
Putting It All Together
Lead to close rate is one of the clearest signals of marketing and sales health in B2B SaaS. It cuts through the noise of vanity metrics and asks a simple, unforgiving question: are the leads you are generating actually becoming customers?
Benchmarks give you directional context. They help you understand whether your numbers are in a reasonable range for your segment, sales motion, and ACV. But the most valuable benchmark is your own historical data, segmented by channel and reviewed consistently over time. That is where the real decisions live.
The shift from measuring close rate to improving it requires attribution. You need to know which campaigns, channels, and touchpoints are generating the leads that close, not just the leads that fill out forms. Without that connection, budget decisions are based on volume rather than value, and the cycle of generating leads that do not close continues.
Cometly makes that connection possible. It ties your ad spend to pipeline and revenue, giving you a single source of truth for which marketing investments are actually driving closed-won deals. If you are ready to move beyond top-of-funnel metrics and start optimizing toward real revenue, Get your free demo and see how Cometly can help you connect every touchpoint to the outcomes that matter.