

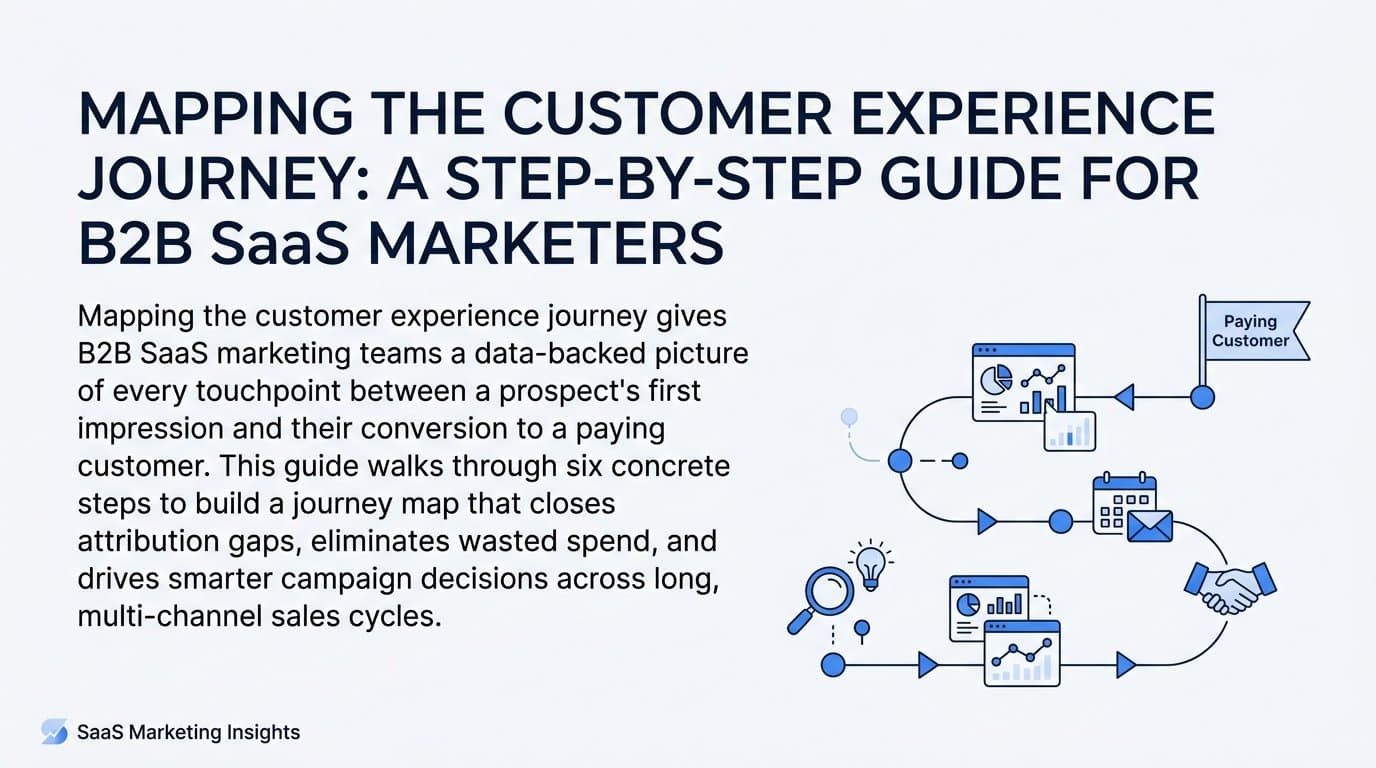
Most B2B SaaS marketing teams know their conversion rates. Far fewer know what actually happens between a prospect's first ad click and the moment they become a paying customer. That gap is where budget gets wasted, leads go cold, and attribution breaks down.
Mapping the customer experience journey closes that gap. It gives your team a clear, data-backed picture of every touchpoint a prospect encounters before they buy, from the first Google ad impression to the final sales call.
For B2B SaaS companies specifically, this matters more than in almost any other industry. Your sales cycles are longer, your buying committees are larger, and your prospects interact with your brand across multiple channels before making a decision. Without a documented journey map, you are making campaign decisions based on incomplete data.
You might be cutting channels that actually influence pipeline, or doubling down on tactics that look good in last-click reports but rarely drive real revenue. Sound familiar? It is one of the most common and costly mistakes growth teams make.
This guide walks you through six concrete steps to map your customer experience journey in a way that is actually useful for marketing decisions. Not a theoretical exercise. Not a workshop deliverable that collects dust. A practical framework that connects your touchpoint data to real attribution insights, so you can optimize campaigns with confidence.
By the end, you will know which channels your best customers use, where prospects drop off, and how to structure your tracking so your attribution data reflects the real journey, not just the last click.
Step 1: Define Your Customer Segments and Buying Personas
Before you can map a journey, you need to know whose journey you are mapping. This sounds obvious, but many teams skip this step or do it poorly, building personas based on who they want to sell to rather than who actually buys.
Start by identifying your two to three highest-value customer segments, measured by revenue, not just volume. A segment that represents a large share of your customer count but a small share of your revenue is not your priority target. Focus on the segments that drive the most closed-won revenue over the past 12 months.
For each segment, document the following from your CRM data:
Company profile: Industry vertical, company size by headcount and revenue, geographic market, and typical tech stack if relevant to your product.
Buying committee roles: Who is the champion pushing for your solution internally? Who is the economic buyer signing off on budget? Who are the influencers or blockers involved in the evaluation? B2B SaaS purchases rarely involve a single decision-maker, and your journey map needs to reflect that reality.
Average deal size and sales cycle length: These two numbers will shape every other step in this process. A segment with a 90-day average sales cycle needs a very different journey map than one that closes in two weeks.
Pain points and trigger events: What problem were they trying to solve when they first started looking? What changed in their business that made this a priority now? Pull this from sales call notes, win-loss interviews, and CRM fields if your team captures them.
The critical discipline here is letting your CRM data lead. Pull closed-won deals from the past 12 months and look for the patterns. Which industries appear most often? Which job titles are consistently listed as the primary contact? What deal sizes cluster together?
Assumptions are expensive in B2B marketing. Data-driven personas are not just more accurate; they make every downstream step in your journey mapping process more reliable.
Success indicator: You have two to three distinct customer segments documented with job titles, company profiles, buying committee structures, and pain points drawn from real CRM data, not guesswork.
Step 2: Document Every Touchpoint Across the Buying Stages
Now that you know who you are mapping, the next step is cataloging every interaction your prospects have with your brand before they buy. The goal at this stage is completeness, not prioritization. You are building an inventory, not making decisions yet.
Organize your touchpoints across four core stages:
Awareness: This is where prospects first encounter your brand. Touchpoints here include paid search ads on Google, paid social ads on LinkedIn and Meta, organic blog content and SEO, social media posts, word of mouth and referrals, and review platforms like G2 or Capterra. Many B2B SaaS companies underestimate how often review sites appear early in the journey, especially for buyers who are actively researching a category.
Consideration: Prospects who are now evaluating solutions engage with a different set of touchpoints. These include landing pages, demo request flows, email nurture sequences, retargeting ads, webinars and on-demand content, comparison pages, and competitor comparison content. This stage is where many teams have the biggest gaps. If your consideration-stage content is thin, prospects will find answers elsewhere, often on a competitor's site.
Decision: At this stage, the prospect is close to buying and is doing final evaluation. Decision-stage touchpoints include sales calls and discovery sessions, product trials or sandbox environments, pricing pages, case study reviews, proposal stages tracked in your CRM, and legal or security review processes for enterprise deals.
Retention: The journey does not end at purchase. Onboarding emails, customer success check-ins, in-product prompts, renewal conversations, and expansion campaigns are all touchpoints that shape long-term customer value. Including retention in your journey map also helps you understand what keeps your best customers engaged, which informs how you position your product to new prospects.
List every channel and content type your team uses across all four stages. Do not filter yet. The goal is a complete picture before you start prioritizing. You will almost certainly discover touchpoints your team has been running without thinking of them as part of the journey, such as automated email sequences that go out after a trial starts, or LinkedIn posts that regularly drive traffic to your blog.
Success indicator: You have a full touchpoint inventory organized by stage, covering both marketing-driven and sales-driven interactions, with no major channels or content types missing from the list.
Step 3: Gather Real Data on How Prospects Actually Move Through the Journey
Here is where mapping the customer experience journey shifts from documentation to discovery. You have your segments defined and your touchpoints listed. Now you need to understand how prospects actually move through those touchpoints, because the real path is rarely what your team assumes.
Start by pulling data from three sources: your ad platforms, your CRM, and your website analytics. You are looking for patterns in closed-won deals specifically. What was the first touchpoint recorded? How many interactions happened before a demo request? Which channels appear consistently in the middle of the journey, even if they are rarely the last touch before conversion?
Look at the sequence, not just the presence of touchpoints. A prospect who clicks a LinkedIn ad, reads two blog posts, attends a webinar, and then books a demo through a retargeting ad has a very different journey than one who finds you through a Google search and books a demo the same day. Both convert, but they need different nurture strategies and they signal different things about channel influence.
Identify where prospects drop off. This is often the most actionable insight from this step. High drop-off between demo request and closed-won often signals a sales process issue, such as slow follow-up, weak discovery calls, or a pricing conversation that catches prospects off guard. High drop-off at the consideration stage, where prospects engage with content but never request a demo, often signals a content gap or a retargeting sequence that is not compelling enough to pull them back.
This is also where multi-touch attribution data becomes essential. Last-click attribution will tell you which channel got the final conversion credit. But it will not tell you which channels consistently appear earlier in the journey and influence pipeline without getting credit. A channel that looks expensive on a cost-per-lead basis might be the most common first touchpoint for your highest-value customers.
The common pitfall here is relying only on last-click or first-touch data to draw conclusions. Consider a prospect who clicks a Google ad first, reads three blog posts over two weeks, attends a webinar, and then converts on a retargeting ad. Last-click attribution credits only the retargeting ad. First-touch credits only the Google ad. Neither model shows you the full picture of what actually moved that prospect to buy.
Multi-touch attribution, which we will cover in Step 5, distributes credit across the journey and gives you a much more accurate view of channel influence.
Success indicator: You have a data-backed view of the most common paths to conversion for each customer segment, including first touch, key mid-journey channels, and the final touchpoint before conversion.
Step 4: Set Up Tracking to Capture Every Touchpoint Accurately
Accurate journey mapping requires accurate tracking. If your pixel data is incomplete, your CRM is disconnected from your ad platforms, or your UTM parameters are inconsistently applied, your journey map will have blind spots. And blind spots in your data lead to blind spots in your budget decisions.
This step is about making sure your tracking infrastructure can actually support the journey map you are building. Here is what needs to be in place:
Server-side tracking and Conversion API integrations: Browser-based pixel tracking has become increasingly unreliable as ad blockers and browser privacy restrictions limit what client-side pixels can capture. Server-side tracking sends conversion events directly from your server to ad platforms like Meta and Google, bypassing the limitations that affect browser pixels. This means more of your conversion events are captured accurately, and your attribution data reflects what is actually happening, not just what the pixel can see.
CRM integration with your attribution platform: This is the connection that makes journey mapping genuinely useful for revenue decisions. When your CRM pipeline stages are linked to your ad platform data, you can see which campaigns drive not just leads, but qualified pipeline and closed revenue. Without this connection, you are optimizing for form fills, not for the outcomes that actually matter to your business.
Consistent UTM parameters: Every campaign, ad set, and ad should be tagged with consistent UTM parameters covering source, medium, campaign, content, and term where relevant. Inconsistent UTM tagging is one of the most common causes of attribution gaps. A prospect who clicks an untagged LinkedIn post will show up as direct traffic in your analytics, hiding the true source of that visit.
Micro-conversion tracking: Most teams track the final conversion event, such as a demo booking or a trial start. But the journey is full of earlier signals that indicate progression: content downloads, pricing page visits, webinar registrations, and return visits to key pages. Tracking these micro-conversions gives you visibility into where prospects are in the journey and which channels are driving meaningful engagement, not just top-of-funnel traffic.
Verify that all key conversion events are firing correctly before you rely on this data for decisions. Check your demo booking confirmations, trial start events, and form submissions against your CRM records to confirm the numbers align.
A platform like Cometly is built specifically to solve this tracking challenge for B2B SaaS teams. It connects your ad platforms, CRM, and website data in one place, supports server-side tracking and Conversion API integrations, and captures touchpoints across the full customer journey so your attribution data does not have the gaps that browser-based tracking alone creates.
Success indicator: Your attribution platform shows touchpoints across the full journey for a sample of recent closed-won deals, with no major gaps in the data and consistent source attribution across channels.
Step 5: Choose the Right Attribution Model for Your Journey Length
Your attribution model determines how credit is assigned across the touchpoints in your journey map. For B2B SaaS teams with long sales cycles and multiple stakeholders, the model you choose significantly affects which channels appear valuable and which get overlooked.
There is no single correct model for every business. The right choice depends on your sales cycle length, your conversion volume, and what question you are trying to answer. Here is how the main models compare:
First-touch attribution: Assigns 100% of the credit to the first interaction a prospect had with your brand. This model is useful for understanding which channels are most effective at generating initial awareness and bringing new prospects into your funnel. The limitation is that it ignores everything that happens after that first interaction, which in a long B2B sales cycle, is most of the journey.
Last-click attribution: Assigns 100% of the credit to the final touchpoint before conversion. This is the default model in many ad platforms and analytics tools, which is part of why it is so widely used. The problem is that it systematically over-credits bottom-funnel retargeting and direct traffic while under-crediting the awareness and nurture channels that built the relationship over weeks or months. For B2B SaaS, this model frequently leads teams to cut channels that are actually doing important work earlier in the journey.
Linear attribution: Distributes credit equally across all touchpoints in the journey. This is a more honest model for long B2B sales cycles because it acknowledges that multiple interactions contribute to a conversion. The limitation is that it treats every touchpoint as equally valuable, which may not reflect the actual influence of high-impact interactions like a live demo or a well-timed case study.
Data-driven attribution: Uses your actual conversion path data to assign credit based on which touchpoints most frequently appear in successful journeys. This is the most accurate model for teams with sufficient conversion volume because it reflects what your data actually shows, not a theoretical distribution. It requires a meaningful volume of conversions to generate reliable results, so it works best for teams with consistent lead flow.
For most B2B SaaS teams, the most practical approach is comparing multiple attribution models side by side rather than committing to just one. A channel that looks weak in last-click attribution may consistently appear in first-touch and linear models, which signals real influence on pipeline that a single-model view would miss.
Cometly supports multi-touch attribution across the full customer journey and lets you compare models so you can see channel performance from multiple angles before making budget decisions.
Success indicator: You have selected a primary attribution model that fits your sales cycle length and data volume, and you can articulate why that model gives you a more accurate view of channel performance than last-click alone.
Step 6: Analyze the Journey Map and Optimize Your Campaigns
With your journey documented and your tracking in place, the final step is where the work pays off. You shift from mapping to optimizing. This is where journey mapping stops being a strategic exercise and starts directly influencing where your budget goes.
Start by identifying your highest-influence touchpoints. Look at the channels and content types that appear most often in the journeys of your best customers, specifically the segments with the highest deal sizes and strongest retention rates. These are the touchpoints worth protecting and investing in, even if they do not always get credit in last-click reports.
Then find the gaps. Look for stages where prospects consistently stall or drop off. Look for channels that are active and consuming budget but rarely appear in closed-won journeys. Look for content types that generate traffic but do not drive demo requests or trial starts. Each of these gaps represents either a budget reallocation opportunity or a content and nurture investment that needs to be made.
Reallocate budget toward channels with proven pipeline influence, not just high click volume or low cost per click. A channel with a high cost per click that consistently appears in the journeys of your best customers is often more valuable than a cheap channel that drives volume but rarely converts to qualified pipeline. Your journey map gives you the data to make that argument internally and act on it with confidence.
Use AI-driven insights to surface which ad creative, audience segments, and campaign structures perform best across the full journey. The best-performing ad at the top of the funnel is often different from the best-performing ad at the decision stage, and AI can help you identify those patterns faster than manual analysis. Cometly's AI-driven recommendations are built to do exactly this, surfacing which campaigns and creatives are driving real pipeline so you can scale what works and cut what does not.
One more critical practice: review your journey map on a regular cadence, at minimum quarterly. B2B buying behavior shifts as new channels emerge, your product evolves, and your competitive landscape changes. A journey map built on data from 18 months ago may not reflect how prospects engage with your brand today. Treat it as a living document, not a one-time deliverable.
Success indicator: You have identified at least two specific optimization actions backed by your attribution data, such as shifting budget from a low-influence channel or adding a nurture sequence at a documented drop-off point, and you have a scheduled review cadence to keep the map current.
Putting It All Together
Mapping the customer experience journey is not a one-time project. It is an ongoing practice that makes every marketing decision sharper. When you know which touchpoints drive pipeline, you stop guessing and start allocating budget with confidence.
The six steps in this guide give you a repeatable framework: define your segments based on real CRM data, document every touchpoint across the buying stages, gather real data on how prospects actually move through the journey, set up accurate tracking that captures every interaction, choose the attribution model that fits your sales cycle, and optimize based on what the data shows.
The teams that do this well share one thing in common. They have a single source of truth for their marketing data that connects ad spend to pipeline to closed revenue. Without that connection, journey mapping stays theoretical. With it, you can see exactly which campaigns move prospects through each stage and scale what works.
Cometly is built to give B2B SaaS marketing teams exactly that view. It connects your ad platforms, CRM, and website data to track every touchpoint in real time, supports multi-touch attribution across the full customer journey, and sends enriched conversion data back to Meta and Google to improve ad platform targeting. Every touchpoint gets captured. Every channel gets measured against real revenue outcomes. And your team gets the clarity to make smarter budget decisions, faster.
If you are ready to move from guessing to knowing, Get your free demo today and start building your journey map on data you can actually trust.



