Marketing data silos are quietly draining budget from B2B SaaS growth teams every single day. Your Google Ads dashboard says one thing. Your CRM says another. Your LinkedIn campaign manager has its own version of the story. And somewhere in the middle, your team is trying to make budget decisions based on three conflicting reports that can't agree on something as basic as how many leads came in last month.
This is not a minor inconvenience. When your data lives in disconnected systems, you end up cutting channels that are actually working and scaling ones that only look good in platform dashboards. Budget gets misallocated. Revenue growth slows. And the frustrating part is that most of the data you need already exists. It's just not connected.
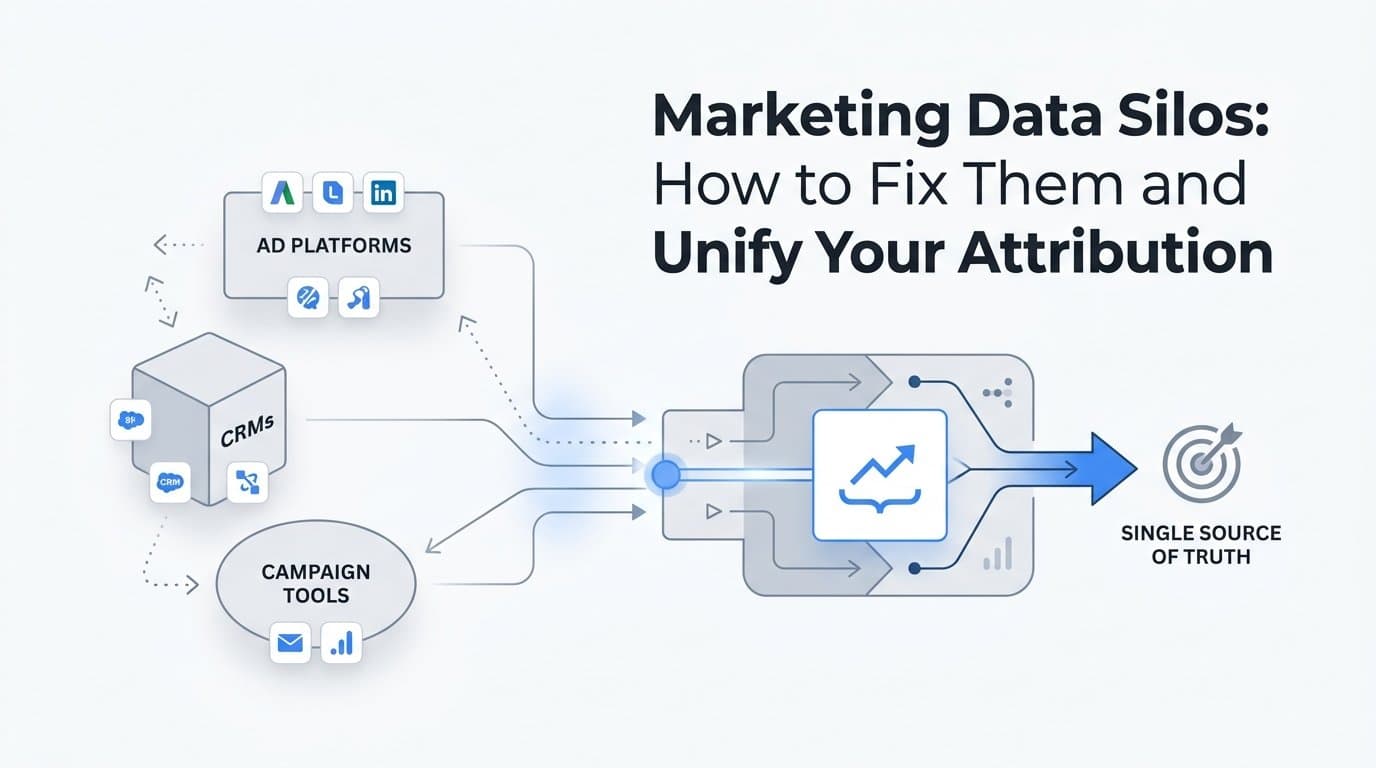
The good news is that marketing data silos are fixable. Not with a single tool or a weekend project, but with a structured, step-by-step approach that builds a unified data foundation across your entire marketing stack. This guide walks you through exactly that process.
You will learn how to audit your current data infrastructure, standardize your tracking setup, implement server-side conversion tracking, connect your CRM and ad platforms to a central attribution layer, choose the right attribution model for your business, and build a dashboard that gives your team a single source of truth. Each step builds on the last, and by the end, you will have a clear path to answering the questions that actually matter: which channels are driving pipeline, which campaigns are generating revenue, and where to invest next.
Whether you are a marketing leader at a B2B SaaS company or a growth operator managing paid campaigns across multiple channels, this guide is built for you. Let's get into it.
Step 1: Audit Your Current Data Infrastructure
Before you can fix anything, you need to know exactly what you are working with. Most marketing teams are surprised to discover just how many tools in their stack are collecting data independently, with no connection to anything else.
Start by mapping every tool in your marketing stack that collects or stores data. This includes your ad platforms (Google Ads, Meta, LinkedIn, and any others you run), your CRM, your website analytics platform, your email marketing tool, your marketing automation platform, and any product analytics or event tracking tools you use. Write them all down in one place.
Once you have that list, identify where data is being collected but not shared between systems. For example, your Google Ads account tracks conversions using its own attribution logic. Your CRM tracks leads from a form submission. But does your CRM know which Google Ads campaign generated that lead? If not, that is a silo.
Next, document which teams own which data sources and how frequently they access them. In many B2B SaaS companies, the paid media team lives in ad platforms, the sales team lives in the CRM, and the marketing ops team manages analytics. When data ownership is fragmented by team, data sharing rarely happens organically.
Look specifically for duplicate metrics with conflicting numbers. A common example is Google Ads reporting 150 conversions in a given month while the CRM shows only 80 leads from the same period. These discrepancies are a signal that your tracking is inconsistent and your attribution logic is not aligned across systems.
Finally, flag any gaps where touchpoints are tracked in one system but invisible to others. If a prospect clicks a LinkedIn ad, visits your site three times over two weeks, and then converts through organic search, does your CRM capture that full journey or just the last touch?
Success indicator: You have a complete map of every data source in your marketing stack, a documented list of disconnected systems, and a clear picture of where the gaps and conflicts exist. This audit becomes the foundation for every step that follows.
Step 2: Standardize Your Event and UTM Tracking Framework
Once you know where your silos are, the next step is to establish a consistent language that every system in your stack can speak. That language is your UTM tracking framework and your event taxonomy.
Start with UTM parameters. A UTM framework defines how every campaign URL is structured so that traffic can be accurately attributed back to its source. The five standard UTM fields are utm_source (e.g., google, meta, linkedin), utm_medium (e.g., cpc, paid-social, email), utm_campaign (the campaign name), utm_content (the specific ad or creative variant), and utm_term (the keyword, for search campaigns).
The critical rule here is consistency. If one team member tags a campaign as utm_source=Google and another uses utm_source=google, your analytics platform will treat these as two separate sources. Multiply that inconsistency across dozens of campaigns and multiple team members, and your attribution data becomes impossible to aggregate accurately.
Define your naming conventions before any campaign goes live. Document them in a shared tracking plan that every marketing team member, agency partner, and contractor must follow. Tools like a simple Google Sheet or a dedicated UTM builder can help enforce this at the point of campaign creation.
Beyond UTMs, you need a shared event taxonomy for your key conversion actions. This means defining consistent names for events like form submissions, demo requests, trial signups, and purchases, and making sure those event names are aligned across your website tracking, your ad platforms, and your CRM.
For example, if your website fires an event called "demo_request_submitted" but your CRM records the same action as "Demo Request" and your Google Ads account tracks it as "Lead Form Submission," you have three systems describing the same action with three different names. Joining that data downstream becomes a manual, error-prone process.
Align your event names across every system. Document the canonical name for each conversion action and configure each platform to use it consistently.
Success indicator: Every campaign URL follows the same UTM structure, every conversion event has a consistent name across all systems, and your tracking plan is documented and accessible to your entire team.
Step 3: Implement Server-Side Tracking and First-Party Data Collection
With your tracking framework standardized, the next challenge is making sure your conversion data is actually being captured reliably. This is where many teams discover a significant gap between the conversions they think they are tracking and the ones they are actually recording.
Browser-based pixel tracking, the traditional method of placing a JavaScript snippet on your website to fire conversion events, has become increasingly unreliable. Ad blockers intercept client-side scripts before they can fire. Safari's Intelligent Tracking Prevention and similar browser privacy features limit how long cookies persist. The result is that a meaningful portion of your actual conversions never get recorded by your ad platforms.
Server-side tracking solves this by sending conversion events directly from your server to ad platforms, bypassing the browser entirely. Because the signal originates server-side, it is not affected by ad blockers or browser privacy restrictions. You capture more of what is actually happening.
For Meta, this means implementing the Conversion API (CAPI). For Google Ads, it means setting up Enhanced Conversions. Both mechanisms allow you to send enriched, first-party conversion data directly to the ad platform, improving event match quality and helping the platform's algorithms optimize more effectively.
When configuring your server-side setup, event deduplication is essential. If a conversion event fires both from your browser pixel and your server, you risk counting it twice. Most ad platforms support deduplication logic using event IDs, but you need to configure this explicitly to avoid inflating your reported conversion numbers.
This step is also where first-party data collection becomes critical. At the point of conversion, capture lead-level identifiers such as email address, phone number, and company name. These identifiers serve two purposes. First, they enable downstream matching between ad-generated leads and CRM revenue records, which is how you eventually connect ad spend to closed-won revenue. Second, sending hashed versions of these identifiers back to ad platforms through CAPI significantly improves match rates, which strengthens the platform's ability to find and target similar high-value prospects.
As third-party cookie deprecation continues across browsers, first-party data collected directly from users becomes the most reliable signal for both attribution and ad platform optimization. Building this collection into your conversion flows now puts you ahead of the curve.
Success indicator: Your ad platforms are receiving server-side conversion signals, event match quality scores are improving in your Meta Events Manager and Google Ads account, and your conversion data is capturing lead-level identifiers for downstream revenue matching.
Step 4: Connect Your CRM and Ad Platforms to a Central Attribution Layer
This is the step where the real power of unified data starts to become visible. You have audited your stack, standardized your tracking, and improved your data capture. Now it is time to bring everything together in a single attribution layer.
Start by integrating your CRM with your ad platforms. Whether you use HubSpot, Salesforce, or another CRM, the goal is to create a data flow where lead and deal information from the CRM can be connected to the marketing touchpoints that generated those leads. This means mapping CRM pipeline stages back to the original campaigns, channels, and ads that drove each contact into your funnel.
The challenge is that ad platforms and CRMs do not naturally speak to each other. Google Ads does not know what happened to a lead after it clicked an ad. Salesforce does not know which LinkedIn campaign sourced a contact unless you explicitly pass that information through. A central attribution layer bridges this gap.
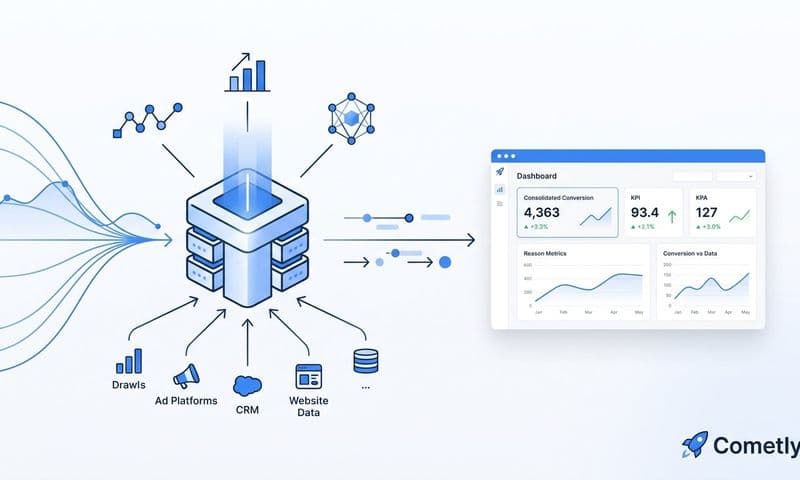
A marketing attribution platform joins your ad spend data with your CRM revenue data in one place, giving you a unified view of performance across the full customer journey. This is where you move beyond platform-reported metrics and start seeing actual business outcomes tied to specific campaigns.
Relying solely on ad platform self-reported conversions is one of the most common pitfalls in B2B SaaS marketing. Each platform uses its own attribution window and logic, which means Google Ads, Meta, and LinkedIn will each claim credit for the same conversion. When you add up platform-reported results, the total often exceeds your actual lead or revenue numbers by a significant margin. This inflated view leads to poor budget decisions.
A unified attribution layer resolves this by applying a consistent attribution model across all channels simultaneously, using your actual CRM and revenue data as the source of truth rather than platform-reported numbers.
This is exactly where Cometly fits into the picture. Cometly connects your ad platforms, CRM, and website tracking to give B2B SaaS teams a real-time view of which ads and channels are driving pipeline and revenue. By integrating Stripe revenue data with ad spend data, Cometly allows you to calculate true ROAS and cost per acquisition at the campaign level, not just the platform-reported approximation.
Success indicator: You can trace a closed-won deal back to the specific ad campaign, channel, and touchpoints that started the customer journey. Your attribution data reflects actual CRM outcomes, not platform-reported estimates.
Step 5: Choose and Apply the Right Attribution Model
With your data unified in a central attribution layer, the next decision is how to distribute credit across the touchpoints in a customer journey. This is your attribution model, and the model you choose has a direct impact on how you allocate budget.
Understanding the main options is the starting point. First-touch attribution assigns all credit to the first touchpoint in a customer journey. It is useful for understanding which channels generate initial awareness and top-of-funnel demand, but it ignores everything that happened between that first interaction and the eventual conversion.
Last-click attribution assigns all credit to the final touchpoint before conversion. It is the default model in many tools and the most commonly used, but it is also the most misleading in B2B SaaS contexts. When buying cycles span weeks or months and involve multiple touchpoints, last-click systematically undervalues the channels that build awareness and nurture prospects over time.
Linear attribution distributes credit equally across all touchpoints in the journey. It is more balanced than first or last touch, but it treats every interaction as equally important regardless of its actual influence on the buying decision.
Time decay attribution gives more credit to touchpoints that occurred closer to the conversion event. This can be useful in shorter sales cycles but tends to undervalue early-stage awareness channels in longer B2B buying cycles.
Data-driven attribution uses actual conversion patterns across your campaigns to assign credit dynamically based on what is working. It requires sufficient conversion volume to generate reliable models, but when you have the data to support it, it produces the most accurate picture of channel contribution.
For most B2B SaaS teams, multi-touch attribution is the recommended primary model for budget decisions. It distributes credit across all touchpoints that influenced a conversion, giving you a complete view of how different channels contribute across the full customer journey. This is especially important when you are managing spend across paid search, paid social, and content simultaneously.
The practical recommendation is to use multi-touch attribution as your primary decision-making model and compare it side by side with first-touch and last-click to understand the role each channel plays at different stages of the funnel.
Success indicator: Your team is using a consistent attribution model for budget decisions, and everyone can articulate why each channel receives the credit it does based on actual customer journey data.
Step 6: Build a Unified Marketing Dashboard for Your Team
The final operational step is making your unified data accessible to the people who need it, in a format that drives decisions rather than just reporting activity.
A unified marketing dashboard should surface the metrics that connect marketing activity to business outcomes. At minimum, this means ad spend by channel, pipeline generated, revenue attributed, and cost per acquisition, all in one view. When these numbers live in separate tools, teams spend time reconciling data instead of acting on it. When they live in one dashboard, decisions happen faster and with more confidence.
Include both channel-level and campaign-level breakdowns. Channel-level data tells you which platforms are delivering the best return. Campaign-level data tells you which specific campaigns within those platforms are driving results. Your team should be able to drill into performance at both levels without switching between tools or exporting spreadsheets.
Set up automated reporting cadences so stakeholders receive consistent, reliable data on a regular schedule. Manual reporting introduces delays and human error. When leadership and cross-functional teams are working from the same automated reports, alignment improves and strategic conversations become more productive.
One of the most common pitfalls in dashboard design is building a view that shows activity metrics like clicks and impressions without connecting them to revenue outcomes. Clicks are interesting. Revenue is what matters. Every metric in your dashboard should have a clear line of sight to a business outcome.
This is where AI-driven insights add significant value. Once your data is unified and clean, AI can surface patterns that would take a human analyst hours to find. Which campaigns are generating the highest-quality pipeline relative to their spend? Which audiences are converting at the highest rates? Where would budget reallocation improve overall performance?
Cometly's AI ads manager and customer journey analytics are built for exactly this. They give marketing teams real-time recommendations on where to scale and where to cut, based on actual revenue data rather than platform-reported metrics. The AI works because the underlying data is connected, clean, and complete.
Success indicator: Every marketing decision your team makes is backed by data from one consistent, trusted source. Your dashboard shows revenue outcomes, not just activity, and your team spends less time reconciling reports and more time acting on insights.
Putting It All Together: Your Path to a Silo-Free Marketing Stack
Fixing marketing data silos is not a one-time project. It is an ongoing practice of maintaining clean, connected data across a marketing stack that will continue to evolve as new tools get added and strategies shift. But the foundation you build through these six steps creates a durable infrastructure that supports better decisions at every level of your organization.
To recap: you start with a full audit of your data sources to understand where silos exist. You standardize your UTM and event tracking framework so every system speaks the same language. You implement server-side tracking and first-party data collection to capture conversions reliably. You connect your CRM and ad platforms through a central attribution layer to see actual revenue outcomes. You choose and apply a multi-touch attribution model that reflects how your customers actually buy. And you build a unified dashboard that surfaces the metrics your team needs to make confident, revenue-focused decisions.
The payoff is significant. Better budget decisions based on actual performance data. More accurate attribution that reflects the full customer journey. Faster revenue growth because your team is investing in what is actually working.
If you are ready to start connecting your ad platforms, CRM, and website tracking in one place, Cometly is built for exactly this. It gives B2B SaaS marketing teams a real-time, unified view of which campaigns and channels are driving pipeline and revenue, with AI-driven recommendations to help you scale what works and cut what does not. Get your free demo today and take the first step toward a silo-free marketing stack.