

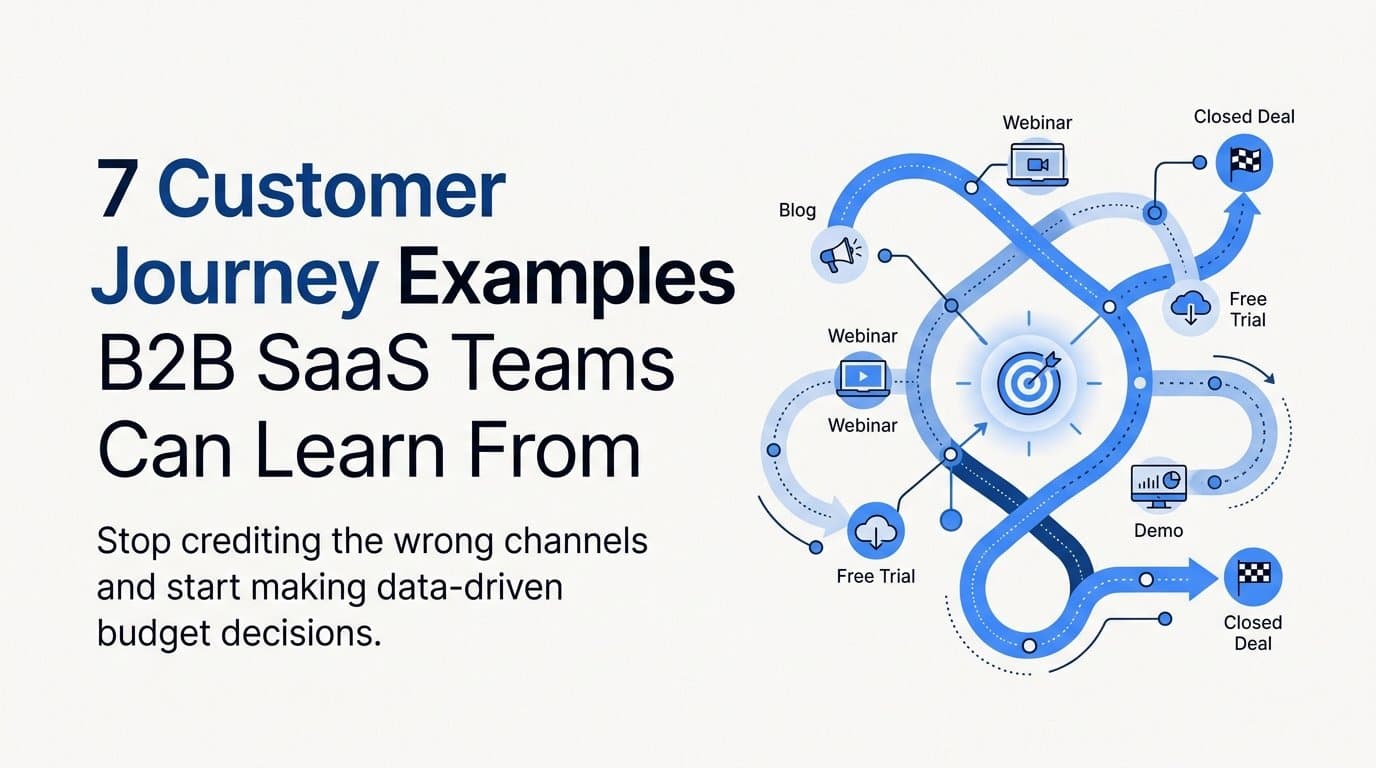
Most B2B SaaS marketing teams invest heavily in ads, content, and outreach without a clear picture of how prospects actually move from first touch to closed deal. The customer journey in B2B SaaS is rarely linear. A prospect might discover your product through a LinkedIn ad, read three blog posts over two weeks, attend a webinar, and then convert through a Google search weeks later. If your attribution only captures the last click, you are crediting the wrong touchpoint and making budget decisions based on incomplete data.
Understanding real customer journey examples gives marketing and growth teams a framework for mapping these complex paths, identifying where prospects drop off, and recognizing which channels actually drive pipeline. This article breaks down seven practical customer journey examples relevant to B2B SaaS companies. Each one illustrates a different path a buyer might take, the touchpoints involved, and the attribution strategy needed to measure it accurately.
Whether you are running paid ads, content marketing, or outbound sequences, these examples will help you build a more complete picture of how your marketing actually works and where your data gaps are. The goal is not just to understand the journey conceptually but to use that understanding to make smarter decisions about where to spend your budget and how to optimize your funnel.
1. The Paid-First Discovery Journey
The Challenge It Solves
Paid ads often do the heavy lifting of creating awareness, but they rarely get the credit they deserve. When a prospect clicks a LinkedIn ad, spends time researching your category, compares alternatives, and finally converts through a branded Google search two weeks later, last-click attribution gives all the credit to Google. The LinkedIn campaign that started everything gets nothing. This systematically distorts budget decisions over time.
The Strategy Explained
The paid-first discovery journey is one of the most common paths in B2B SaaS, and it exposes the core weakness of single-touch attribution. Prospects rarely convert on the first ad exposure. They research, evaluate competitors, read reviews, and return through a different channel when they are ready to act.
Multi-touch attribution models solve this by distributing credit across every touchpoint in the sequence. Linear attribution gives equal weight to each interaction. Time-decay models credit touchpoints closer to conversion more heavily. Data-driven models use actual conversion patterns to assign credit based on each touchpoint's statistical influence. Each approach gives a more honest view of what your paid campaigns are actually contributing.
Implementation Steps
1. Map your standard paid-first journey by pulling a sample of recent conversions and tracing every touchpoint from first ad click to demo request or signup.
2. Compare how credit is distributed under last-click versus a multi-touch model to see where your current reporting is misleading you.
3. Use a platform like Cometly to ingest data from all your ad channels and apply multiple attribution models side by side, so you can see the full picture without switching between dashboards.
4. Adjust budget allocation based on the multi-touch view, gradually shifting spend toward channels that consistently appear at the top of the funnel even when they do not close the deal directly.
Pro Tips
Do not wait until you have perfect data to act. Start by applying a linear attribution model as a baseline and compare it against your current last-click view. The gaps you find will immediately reveal which paid channels you have been undervaluing. From there, you can refine your model as you collect more conversion data.
2. The Content-Led Nurture Journey
The Challenge It Solves
Organic content drives a significant portion of B2B SaaS pipeline, but it rarely converts on first contact. A buyer might discover your blog through a Google search, return to read a comparison page a week later, download a guide, and eventually request a demo after consuming five or six pieces of content. Without mid-funnel tracking, every one of those content interactions is invisible in your attribution data.
The Strategy Explained
The content-led nurture journey is defined by extended research cycles and multiple anonymous touchpoints before a prospect ever identifies themselves. Blog posts, comparison pages, and resource guides tend to appear in the middle of the journey rather than at the start or end. This makes them easy to overlook in standard analytics, which typically only captures the first and last sessions.
The key challenge is connecting anonymous content engagement to identified leads in your CRM. A visitor who reads your blog three times as an anonymous user and then fills out a demo form is a single buyer, but most analytics tools treat them as separate sessions with no connection. First-party data collection and server-side event tracking help bridge this gap by stitching sessions together using persistent identifiers.
Implementation Steps
1. Implement server-side tracking on your content pages to capture sessions that browser-based scripts miss due to ad blockers or cookie restrictions.
2. Use a first-party identity layer to connect anonymous sessions to identified contacts once a prospect fills out a form or signs up for a trial.
3. Pass content engagement data into your CRM so sales teams can see which resources a prospect consumed before requesting a demo.
4. Review which content pieces appear most frequently in the journeys of your highest-value customers, and use that insight to prioritize your content investment.
Pro Tips
Resist the temptation to judge content purely on direct conversion volume. A blog post that consistently appears two or three touchpoints before a high-value demo request is doing critical work even if it never directly converts anyone. Multi-touch attribution is what makes this visible.
3. The Dark Social and Word-of-Mouth Journey
The Challenge It Solves
Some of your highest-intent prospects arrive with no visible referral source. They land directly on your site, request a demo, and convert at an unusually high rate, but your analytics shows them as direct traffic with no explanation. In reality, they were referred through a Slack community, a private LinkedIn message, or an email forward. These private sharing channels are invisible to standard tracking tools, creating a systematic blind spot in your attribution data.
The Strategy Explained
Dark social refers to referral and sharing activity that happens in private channels where tracking parameters cannot follow. When someone shares your product in a Slack community or forwards your pricing page in an email, the recipient clicks a link with no UTM parameters and no referrer header. Analytics tools classify this as direct traffic, which makes it look like the prospect appeared out of nowhere.
This matters because dark social traffic often converts at higher rates than other sources. Word-of-mouth referrals carry implicit trust, so prospects who arrive through these channels are already partially sold. Misclassifying them as generic direct traffic means you cannot measure or scale the channels generating them.
Implementation Steps
1. Add a self-reported attribution field to your demo request and signup forms. Ask prospects directly how they heard about you, and include options like "a colleague recommended it" or "saw it mentioned in a community."
2. Analyze your direct traffic segment for behavioral signals that suggest high intent, such as landing directly on pricing or feature pages rather than the homepage.
3. Cross-reference self-reported data with your CRM to identify patterns. If multiple high-value customers mention the same Slack community, that is a channel worth investing in.
4. Use server-side tracking to recover some of the signal that browser-based tools miss, particularly for prospects who use ad blockers or privacy-focused browsers.
Pro Tips
Self-reported attribution is qualitative and imperfect, but it is often the most honest signal you have for dark social journeys. Combine it with behavioral analysis and first-party data to build a more complete picture. Do not dismiss direct traffic as unattributable; treat it as a signal worth investigating.
4. The Multi-Channel Retargeting Journey
The Challenge It Solves
Retargeting campaigns on Facebook, Google Display, and LinkedIn often run simultaneously, meaning a single prospect may see your ads on all three platforms before converting. Without cross-channel deduplication, each platform claims full credit for the conversion. Your reported ROAS across channels looks impressive on paper, but the numbers are inflated because three platforms are each taking credit for the same sale.
The Strategy Explained
The multi-channel retargeting journey is where attribution overclaiming becomes most obvious. Platform-native reporting is inherently self-serving. Meta will credit Meta. Google will credit Google. LinkedIn will credit LinkedIn. When all three are running retargeting simultaneously, the sum of their reported conversions will always exceed your actual conversion count.
Unified attribution resolves this by ingesting data from all ad channels into a single system and applying deduplication logic. Instead of each platform reporting independently, a unified layer assigns credit based on the actual sequence of touchpoints, so you can see which retargeting channel is genuinely influencing conversions versus which one is just showing up late in a journey that was already won.
Implementation Steps
1. Connect all your ad platforms to a single attribution system so you can view cross-channel performance in one place rather than toggling between platform dashboards.
2. Apply deduplication rules that assign credit to the appropriate touchpoint based on your chosen attribution model, rather than allowing each platform to claim the full conversion.
3. Compare your platform-reported ROAS against your unified attribution ROAS to quantify the overclaiming gap. This number often surprises teams that have been optimizing based on platform data alone.
4. Use the unified view to identify which retargeting channel is doing the most work in your actual conversion sequences, and reallocate budget accordingly.
Pro Tips
Cometly's cross-channel attribution pulls data from all your ad platforms into a single source of truth, making it straightforward to see where deduplication changes the picture. This is particularly valuable when you are running retargeting on three or more platforms simultaneously and need to make budget decisions based on actual performance rather than inflated platform metrics.
5. The Outbound-to-Inbound Hybrid Journey
The Challenge It Solves
Cold outreach creates awareness that never shows up in your attribution data. A prospect receives a cold email, does not reply, but searches for your product two weeks later and converts through organic search. Standard attribution credits the organic channel entirely and ignores the outbound sequence that planted the seed. Over time, this leads teams to underinvest in outbound because the data makes it look like it is not working.
The Strategy Explained
The outbound-to-inbound hybrid journey is one of the most underappreciated patterns in B2B SaaS. Sales development teams send hundreds or thousands of cold emails and LinkedIn messages. A small percentage respond directly, but a larger portion absorb the message, do their own research, and eventually surface as inbound leads. From the attribution system's perspective, these look like organic or direct conversions with no outbound influence.
Connecting these touchpoints requires integrating your CRM with your web and ad tracking. When a contact from your outbound sequence later visits your site and converts, a properly integrated system can link the two events and give outbound partial credit for the conversion. Without this integration, your outbound team is generating pipeline that gets credited to other channels.
Implementation Steps
1. Ensure your CRM records every outbound touchpoint, including email sends, LinkedIn messages, and call attempts, with timestamps and contact identifiers.
2. Integrate your CRM with your web analytics so that when a known contact from an outbound sequence visits your site, the session is linked to their existing record.
3. Define a time window for outbound influence. If a prospect converts within 60 or 90 days of receiving an outbound sequence, attribute partial credit to the outbound touchpoint in your multi-touch model.
4. Report on outbound-influenced pipeline separately from outbound-sourced pipeline so leadership can see the full contribution of your sales development efforts.
Pro Tips
This journey type requires tight alignment between marketing and sales operations. The tracking infrastructure only works if outbound activity is consistently logged in the CRM and if your attribution platform can read that data. Start by auditing your CRM hygiene before building the integration.
6. The Free Trial and PLG Journey
The Challenge It Solves
Product-led growth companies have a more complex attribution challenge than traditional SaaS. The journey does not end at signup. It continues through activation, engagement, and eventual upgrade to a paid plan. If you can only track the source of the signup but not the source of the paid conversion, you are optimizing for the wrong event and potentially scaling channels that generate free users but not paying customers.
The Strategy Explained
The PLG journey has four distinct stages that all need to be tracked and connected: ad click, signup, activation (reaching a meaningful value moment within the product), and upgrade to paid. Each stage requires data from a different system. Ad click data lives in your ad platforms. Signup data lives in your product analytics. Activation data requires event tracking within the product. Revenue data lives in your billing system.
The attribution challenge is connecting all four stages back to the original acquisition source. A user who signed up from a Google ad and upgraded to paid three weeks later should have their revenue attributed to that Google campaign. Without a system that connects ad platform data, product analytics, and billing data, this connection breaks and you cannot see which acquisition channels generate actual revenue versus just free signups.
Implementation Steps
1. Pass a consistent user identifier from your ad platform through to your product and billing system so you can trace a single user across all four stages of the PLG journey.
2. Define your activation event clearly and instrument it in your product analytics so you can track which acquisition sources produce users who activate versus those who churn before reaching value.
3. Integrate your billing system, such as Stripe, with your attribution platform to connect revenue events back to original acquisition source. Cometly's Stripe integration is designed specifically for this use case, linking ad spend data directly to paid conversion events.
4. Build a funnel report that shows conversion rates from signup to activation and from activation to paid by acquisition source, so you can identify which channels drive the highest-quality users.
Pro Tips
Optimizing PLG campaigns purely on signup volume is a common mistake. A channel that generates twice the signups at the same cost looks great until you see that its activation and upgrade rates are half the average. Revenue attribution is the only metric that tells the full story.
7. The Long-Cycle Enterprise Journey
The Challenge It Solves
Enterprise B2B deals involve multiple stakeholders, months of evaluation, and dozens of touchpoints across different channels and individuals. Standard attribution windows of 30 or even 90 days capture only a fraction of this journey. Marketing influence that happened early in the cycle gets dropped from the model entirely, making it look like marketing contributed less than it actually did to enterprise pipeline.
The Strategy Explained
The long-cycle enterprise journey is fundamentally different from SMB or mid-market journeys. A single deal might involve a champion who discovered your product through a webinar, a technical evaluator who read your documentation, a finance stakeholder who saw a LinkedIn ad, and a C-suite decision-maker who was referred by a peer. Each person has their own journey, and the deal only closes when all of them are aligned.
Standard attribution tools are built around individual user journeys with short time windows. They are not designed to aggregate touchpoints across a buying committee or track influence over a six-month sales cycle. Pipeline attribution and revenue attribution models address this by connecting marketing activity to CRM opportunities rather than just to individual conversion events. This allows you to see which campaigns and channels influenced deals that are still in progress, not just those that have already closed.
Implementation Steps
1. Extend your attribution window to match your actual sales cycle. If your average enterprise deal takes four to six months, your attribution window needs to cover at least that period.
2. Connect your attribution platform to your CRM at the opportunity level, not just the contact level, so you can track all touchpoints associated with a deal regardless of which stakeholder experienced them.
3. Use pipeline attribution to measure marketing influence on open opportunities. This gives you a forward-looking view of marketing's contribution before deals close, which is critical for defending budget during long sales cycles.
4. Report on marketing-influenced pipeline and marketing-sourced pipeline as separate metrics so you can show the full scope of marketing's contribution to enterprise revenue.
Pro Tips
Cometly's pipeline and revenue attribution capabilities are built for exactly this scenario. By connecting ad spend data with CRM opportunity data, you can see which campaigns are influencing enterprise deals across the full buying committee and the full sales cycle, not just the last touchpoint before a form fill.
Putting It All Together
Understanding customer journey examples is only valuable if your attribution system can actually track them. Most B2B SaaS teams are operating with blind spots because their tools only capture part of the picture. The seven journeys outlined here represent the most common paths buyers take, and each one requires a different tracking approach to measure accurately.
The practical starting point is to audit your current setup against these journey types. Ask which touchpoints you are currently capturing, where your data goes dark, and whether your attribution model reflects the actual complexity of your sales cycle. You may find that you are tracking the paid-first journey reasonably well but have no visibility into dark social, outbound influence, or enterprise buying committee behavior.
Platforms like Cometly are built specifically for this challenge. By connecting your ad platforms, CRM, and website into a single attribution layer, Cometly gives you a real-time view of every touchpoint from first ad click to closed-won revenue. You can compare attribution models, track pipeline influence, and feed enriched conversion data back to Meta and Google to improve ad performance over time.
If your marketing data does not reflect the journeys your buyers are actually taking, your budget decisions are based on guesswork. Start by mapping your most common journey types, then build the tracking infrastructure to measure them with confidence.
Ready to stop guessing and start seeing the full picture? Get your free demo today and start capturing every touchpoint to maximize your conversions.



