

Most B2B SaaS marketing teams invest heavily in paid ads, content, and outreach without a clear picture of how their buyers actually move from first touch to closed deal. That gap is not a data problem. It is a visibility problem.
A customer journey map solves it by giving your team a shared, structured view of every stage a prospect moves through before becoming a customer. When built correctly, a journey map stops being a static diagram and starts functioning as a strategic tool that informs your ad targeting, content sequencing, attribution model, and budget allocation.
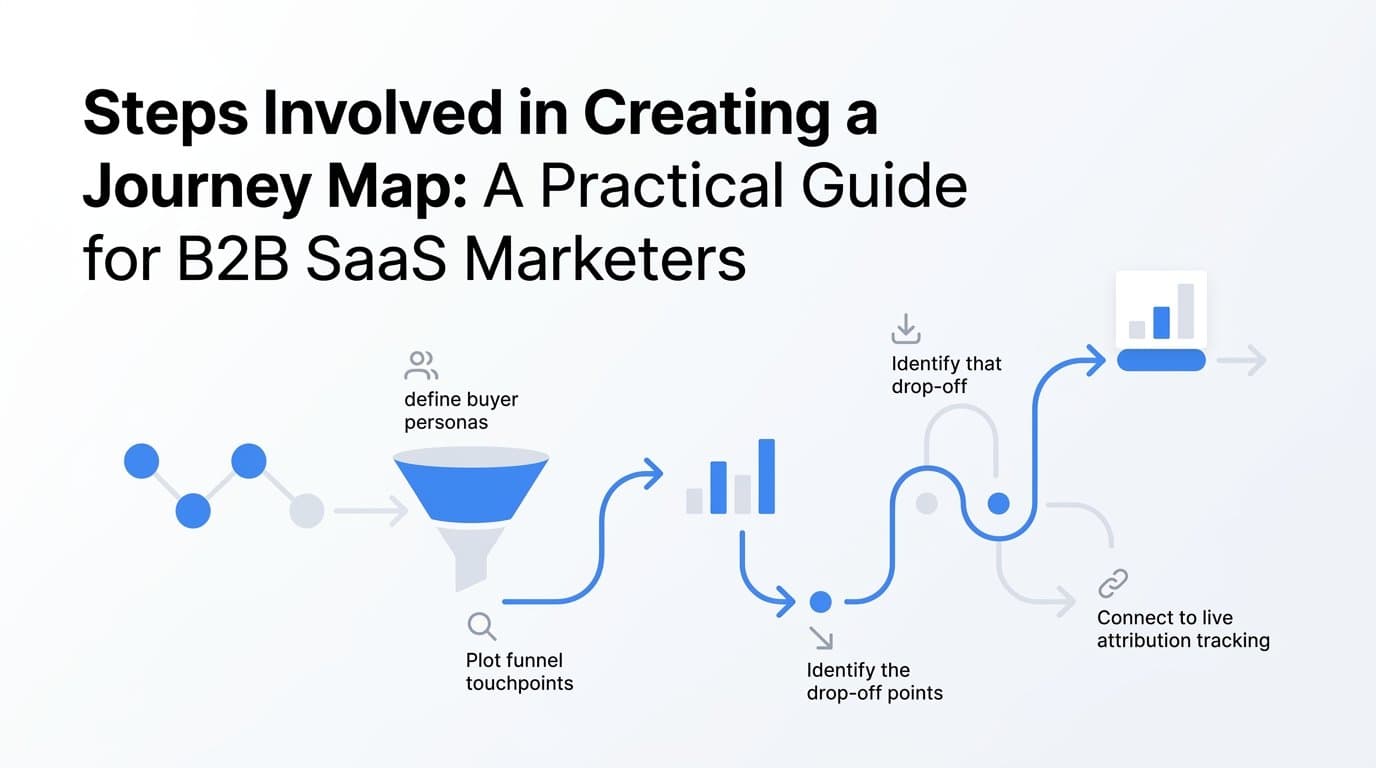
This guide walks through every step involved in creating a journey map that is grounded in real behavioral data rather than assumptions. You will learn how to define your buyer personas, gather qualitative and quantitative inputs, plot touchpoints across the funnel, identify friction and drop-off points, and connect your map to live tracking so it stays accurate over time.
For B2B SaaS teams running paid campaigns across Google, Meta, LinkedIn, and other channels, the journey map is also the foundation for smarter attribution. When you know the path your buyers take, you can assign credit to the right touchpoints, optimize ad spend with confidence, and feed better conversion data back to your ad platforms.
B2B buying journeys are also fundamentally different from B2C. Buying committees often involve multiple stakeholders, sales cycles stretch across weeks or months, and prospects interact with your brand across many channels before a decision is made. A well-structured journey map accounts for all of that complexity rather than flattening it into a simple funnel diagram.
By the end of this guide, you will have a repeatable process for building journey maps that drive measurable improvements in pipeline and revenue. Let's get into it.
Step 1: Define Your Buyer Persona and Journey Scope
Before you map anything, you need to know exactly who you are mapping for and what portion of their journey you are covering. This sounds obvious, but it is where most teams go wrong. They try to build a single map that covers every persona, every use case, and every channel at once. The result is a sprawling diagram that nobody can act on.
Start by identifying one specific persona. In B2B SaaS, that means getting precise: what is their role, what size company do they work at, what industry vertical are they in, and do they have buying authority or are they an influencer in the decision? A VP of Marketing at a 150-person SaaS company has a fundamentally different journey than a marketing manager at a 2,000-person enterprise. Treat them as separate maps.
Next, define the scope of the journey you are mapping. Pick a clear start point and a clear end point. Common scopes for B2B SaaS teams include:
Full funnel: From first ad impression or organic discovery all the way through to a signed contract or first payment.
Awareness to trial: Covering the path from initial brand exposure through to a free trial signup or demo request.
Trial to paid: Focusing specifically on the activation and conversion journey after a prospect has already entered your product.
Choose the scope that your team most urgently needs clarity on. If your biggest problem is that trials are not converting to paid, map that journey first. If you are struggling to generate qualified pipeline from paid ads, start at the top of the funnel.
Align your entire team on this scope before you start collecting data. Write it down in a single sentence: "This map covers how a VP of Marketing at a 50-to-200 person SaaS company moves from first paid ad impression to a completed demo call." If you cannot articulate the scope that clearly, narrow it further.
The most common pitfall at this stage is scope creep. Every stakeholder will want to add their persona or their funnel stage. Resist it. A focused map that your team can actually use is worth ten times more than a comprehensive map that collects dust.
Success indicator: Your team can articulate in one sentence who the map is for and exactly what journey it covers.
Step 2: Gather Data From Real Buyer Interactions
Once your scope is defined, resist the urge to start drawing the map. The next step is data collection, and it needs to happen before you make any assumptions about the journey. The goal is to understand how buyers actually behave, not how you think they behave.
Start with your quantitative sources. Pull traffic and conversion path data from your analytics platform, conversion data from your ad platforms, and pipeline stage progression data from your CRM. Look for patterns: which channels appear most frequently in the paths that end in a closed deal? Where do prospects stall between funnel stages? How long does each stage typically take?
Your attribution platform is particularly valuable here. If you are using a multi-touch attribution tool, you can see which touchpoints appear across the journeys of your highest-value customers. This gives you an evidence-based starting point for sequencing your map rather than relying on gut instinct.
Quantitative data tells you what is happening. Qualitative data tells you why. That is why customer interviews are non-negotiable at this stage. Talk to recent customers and ask them to walk you through how they found you, what made them consider you seriously, what almost made them walk away, and what finally pushed them to buy. You will consistently hear things that your analytics data never surfaces.
Do not limit your interviews to customers who converted. Conversations with lost deals are often more revealing. They can tell you exactly where your journey broke down and what a competitor did better at a critical stage.
Beyond interviews, mine your existing data sources for behavioral signals:
Sales call recordings: Listen for the questions prospects ask repeatedly. These reveal the information gaps in your current journey.
Support tickets and onboarding notes: These often surface friction points that occur after conversion but that trace back to misaligned expectations set during the sales journey.
Review sites like G2 or Capterra: Read your reviews and your competitors' reviews. Buyers describe their decision process in detail in these reviews, and they are completely unfiltered.
Avoid the HiPPO problem: letting the highest-paid person's opinion drive your journey map instead of behavioral data. When you have actual buyer data, use it.
Success indicator: You have at least two data sources per funnel stage, one quantitative and one qualitative, before you begin mapping.
Step 3: Identify and Sequence Every Touchpoint
Now you are ready to start building the map itself. The first task is creating a comprehensive inventory of every touchpoint where your buyer encounters your brand. Do not filter or prioritize yet. Just list everything.
Think across every channel and interaction type. For a typical B2B SaaS buyer, this might include paid search ads, paid social ads on LinkedIn or Meta, organic search results, blog content, YouTube videos, podcast mentions, G2 or Capterra listings, retargeting ads, email sequences, sales development rep outreach, product demos, free trial flows, onboarding emails, and customer success calls. The list is often longer than teams expect.
Once you have the full list, sequence the touchpoints based on your data. This is critical: the order should reflect when buyers actually encounter each touchpoint, not the order that feels logical to your marketing team. Your data may reveal that buyers often visit your G2 profile before they ever click a paid ad, which would completely change how you think about your review presence.
Group your touchpoints by funnel stage to create structure:
Awareness: The touchpoints where buyers first discover your brand or recognize they have a problem worth solving.
Consideration: The touchpoints where buyers are actively researching solutions and comparing options.
Evaluation: The touchpoints where buyers are assessing your specific product, including demos, trials, and reference calls.
Decision: The touchpoints that directly precede a purchase commitment, including pricing conversations and contract reviews.
Post-purchase: The touchpoints that drive retention, expansion, and referral behavior.
For each touchpoint, flag who owns it. Is it channel-owned, meaning driven by your marketing campaigns? Is it sales-owned, meaning driven by direct rep activity? Is it product-owned, meaning driven by in-product behavior? This ownership mapping clarifies accountability and helps you identify handoff points where buyers sometimes fall through the cracks.
Critically, flag any touchpoints that you currently have no tracking coverage for. These are your attribution blind spots. Dark social channels, offline conversations, and organic social engagement often influence buyers significantly but leave no trace in your analytics. Identifying them now sets up the work you will do in later steps.
Success indicator: Every touchpoint on your map has a corresponding data source or tracking event you can verify, and untracked touchpoints are explicitly flagged.
Step 4: Map Buyer Goals, Actions, and Emotions at Each Stage
A journey map that only documents touchpoints is incomplete. The real power comes from understanding what your buyer is thinking, feeling, and trying to accomplish at each stage. This layer of the map is what connects your data to your messaging strategy.
For each stage, document three things: the buyer's goal, the action they take, and the emotion or concern they carry. Work through each stage systematically.
Buyer goals reveal the content and messaging your ads and landing pages need to address. A buyer in the awareness stage is not trying to evaluate your product. They are trying to understand whether they have a problem worth solving. Your messaging at that stage should speak to the problem, not your features. A buyer in the evaluation stage is trying to reduce risk and build internal confidence. Your messaging there should focus on proof, not awareness.
Emotions and friction points are where your map gets genuinely actionable. When you surface the concern a buyer carries into a demo call or the anxiety they feel during a pricing conversation, you can design your journey to address those concerns proactively rather than reactively. Customer interview quotes are invaluable here. Anchor emotional states in the actual words your buyers used, not in marketing language you invented for them.
Here is how this plays out across a typical B2B SaaS funnel:
Awareness stage: Goal is to understand the problem. Action is consuming content or clicking an ad. Emotion is curiosity mixed with skepticism about whether a solution actually exists.
Consideration stage: Goal is to build a shortlist. Action is visiting comparison pages, reading reviews, and requesting demos. Emotion is optimism tempered by concern about switching costs or implementation complexity.
Evaluation stage: Goal is to validate the choice internally. Action is running a trial or presenting options to stakeholders. Emotion is pressure to make the right recommendation and avoid a costly mistake.
Decision stage: Goal is to finalize terms and get buy-in. Action is negotiating pricing and reviewing contracts. Emotion is urgency mixed with lingering doubt about whether this is the right moment to commit.
The final piece of this step is connecting each stage to a measurable conversion event. What specific action signals that a buyer has successfully moved from one stage to the next? This could be a demo request form submission, a trial activation, a pricing page visit, or a contract signature. Defining these events transforms your map from a narrative into something you can actually track and optimize.
Success indicator: Each stage has a defined buyer goal, a corresponding marketing or sales action, and a trackable conversion event tied to it.
Step 5: Pinpoint Gaps, Drop-Off Points, and Attribution Blind Spots
With your map drafted, you now have a structured framework to hold up against your actual conversion data. This comparison is where journey mapping becomes genuinely valuable for growth teams, because it reveals the gaps between the journey you designed and the journey your buyers are actually experiencing.
Start by analyzing your conversion data to find where prospects stop progressing. Look for stages where a high volume of prospects enter but a low percentage advance. Look for stages where time-to-close stretches unexpectedly, which often signals that buyers are stalling because they lack information or confidence. These drop-off points are your highest-priority optimization targets.
Next, cross-reference your journey map against your attribution data. This is the step that most teams skip, and it is the most important one for paid media teams. Under a last-click attribution model, the touchpoint immediately before conversion gets all the credit. But your journey map likely shows that buyers interacted with your brand many times before that final click. Those earlier touchpoints, including awareness ads, organic content, and retargeting sequences, are contributing to the conversion but receiving no credit in your reporting.
This misalignment leads to systematic underinvestment in the channels that actually drive pipeline. If your LinkedIn awareness campaigns are consistently appearing in the journeys of your best customers but receiving zero credit under last-click, you will eventually cut that budget based on bad data. Your journey map, combined with multi-touch attribution, prevents that mistake.
Look specifically for these common attribution blind spots in B2B SaaS journeys:
Dark social and direct traffic: Buyers who arrive via Slack communities, private referrals, or shared links often show up as direct traffic in your analytics, masking the real source of influence.
Offline conversations: Sales calls, conference conversations, and peer recommendations are almost never captured in standard tracking setups.
Cross-device journeys: A buyer who clicks a LinkedIn ad on their phone and later converts on their desktop may appear as two separate sessions with no connection between them.
Organic social engagement: Likes, shares, and comments that build brand familiarity over time rarely appear in conversion paths even though they contribute to awareness.
Prioritize your gaps by their likely impact on pipeline. A tracking gap at a high-volume awareness stage will distort your data far more than a gap at a low-volume late-stage touchpoint. Focus your remediation efforts accordingly.
Success indicator: You have a prioritized list of tracking gaps and a concrete plan to close them using server-side events, CRM integration, or first-party data enrichment.
Step 6: Connect Your Journey Map to Live Attribution Tracking
A journey map that lives in a slide deck or a whiteboard photo is a starting point, not a finished tool. The step that transforms it into an operational asset is connecting every touchpoint to live tracking so you can monitor the journey in real time and optimize based on what you observe.
Begin by translating each touchpoint on your map into a specific trackable conversion event. A demo request becomes a form submission event. A trial activation becomes a signup completion event. A pricing page visit becomes a page view event with session depth data attached. Be precise about what constitutes a meaningful signal at each stage, because vague events produce vague insights.
Server-side tracking is essential for accuracy at this stage. Browser-level tracking is increasingly unreliable because ad blockers, browser privacy settings, and cookie restrictions cause significant data loss at key touchpoints. When you track events server-side, the data flows directly from your server to your attribution platform without being intercepted or blocked. For B2B SaaS teams where every conversion event is high-value, this accuracy matters enormously.
Set up multi-touch attribution across the touchpoints your map identified as influential. This means moving away from last-click models and toward attribution models that distribute credit across the full journey. Linear attribution, time-decay attribution, and data-driven attribution each have different strengths depending on your sales cycle length and channel mix. Your journey map gives you the context to choose the model that best reflects how your buyers actually convert.
Feed enriched conversion events back to your ad platforms. When you send high-quality, enriched conversion data back to Meta, Google, and LinkedIn through their Conversion APIs, their algorithms can optimize toward buyers who match the behavioral patterns of your best customers. This closes the loop between your journey map and your paid media performance: you are not just understanding the journey, you are using it to attract more buyers who follow that same high-value path.
Connect your CRM pipeline stages to your ad data. This is the connection that most attribution setups miss. When a prospect moves from a marketing qualified lead to a sales qualified lead to a closed-won deal, those CRM events should flow back to your attribution platform so you can trace the revenue all the way back to the first ad click. Platforms like Cometly are built specifically to make this connection, linking ad spend data to pipeline and revenue data so you can see the full return on every campaign.
This integration also enables you to optimize toward revenue rather than just leads. Instead of telling your ad platforms to find more people who fill out a form, you can tell them to find more people who eventually become paying customers. That is a fundamentally more powerful optimization signal.
Success indicator: Every major touchpoint on your journey map has a corresponding tracked event with measurable conversion data flowing into your attribution platform, and CRM pipeline stages are connected to your ad data.
Step 7: Review, Validate, and Iterate the Map Over Time
The final step is building the habit of treating your journey map as a living document rather than a one-time workshop output. Buyer behavior changes. Your channel mix evolves. New competitors enter the market. Product updates shift how buyers evaluate your solution. A map built in January may be significantly outdated by June if you do not revisit it.
Schedule a quarterly review as a standing team commitment. In each review, bring your current pipeline data and ask whether the touchpoints you mapped still correlate with the paths that produce the highest conversion rates and the lowest customer acquisition cost. If you are seeing a new channel consistently appearing in high-value journeys, add it to the map. If a touchpoint you previously prioritized is no longer showing up in conversion paths, investigate why.
Validate the map against actual outcomes. This is the discipline that separates teams who use journey maps strategically from teams who treat them as a branding exercise. If your map says that LinkedIn retargeting is a critical touchpoint in the consideration stage, your attribution data should confirm that buyers who engage with those ads convert at a higher rate or faster rate than those who do not. If the data does not support the map, update the map.
Share the map cross-functionally. Sales, product, and demand generation teams each see different parts of the buyer journey, and their input will surface patterns that your marketing data alone cannot capture. A sales rep who runs twenty discovery calls per week knows things about buyer hesitation and competitive dynamics that no analytics dashboard will show you. Build a review process that brings those perspectives into the map regularly.
Use AI-driven insights from your attribution platform to surface emerging patterns. As your tracking data accumulates, patterns will emerge that indicate shifts in the buyer journey: a new channel gaining influence, a stage where time-to-close is shortening, a touchpoint sequence that consistently predicts high-value customers. These signals are your early warning system for updating the map before the shift becomes obvious in your pipeline numbers.
Treat the quarterly review as a strategic planning input, not just a documentation update. The insights from your journey map should directly inform your next quarter's campaign strategy, budget allocation, and content roadmap. When the map is connected to live data and reviewed regularly, it becomes one of the most powerful strategic tools your marketing team has.
Success indicator: The map is updated at least quarterly, reviewed by multiple teams including sales and product, and directly informs campaign strategy and budget decisions each quarter.
Putting It All Together
Creating a journey map is not a design exercise. It is a data strategy. When you follow these steps, you move from a vague understanding of how buyers find you to a precise, trackable model of every touchpoint that drives pipeline and revenue.
The most important shift is connecting your map to live attribution data. A static diagram on a whiteboard does not tell you which ad drove the first touchpoint or which channel closed the deal. That requires a platform that tracks the full customer journey in real time, from first ad click through CRM events to closed-won revenue.
Cometly is built for exactly this. It captures every touchpoint across your ad platforms, website, and CRM, connects them to pipeline and revenue, and gives your team AI-driven recommendations to optimize spend based on what is actually working. You can compare attribution models, identify undervalued channels, and feed enriched conversion data back to Meta, Google, and LinkedIn so their algorithms optimize toward your best customers, not just your most recent form fills.
When your journey map is backed by this kind of real-time data, it stops being a strategic artifact and becomes an operational system that gets sharper every quarter.
If you are ready to turn your journey map into a live, data-backed attribution system, Get your free demo today and see which channels are truly driving your growth.



