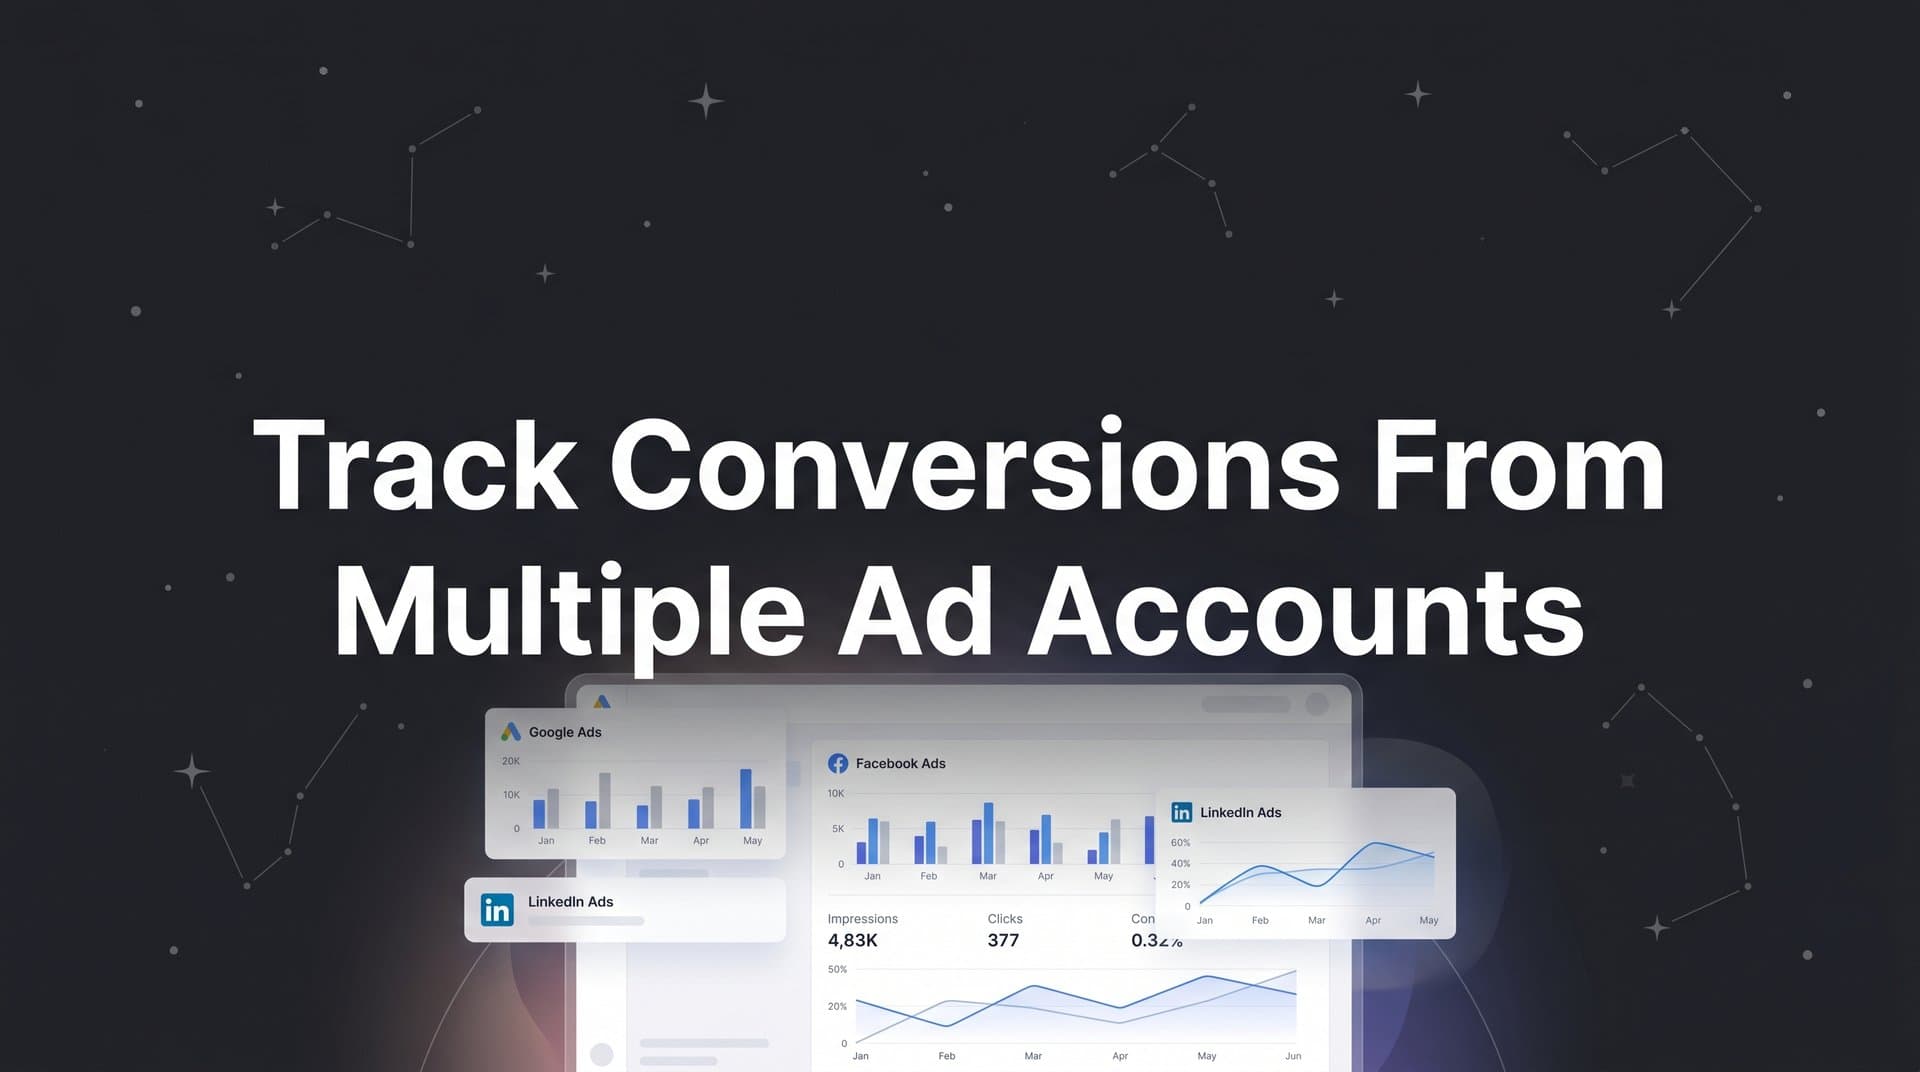
Running ads across Meta, Google, LinkedIn, and TikTok simultaneously is standard practice for growth-focused B2B SaaS teams. But the moment you scale across multiple ad accounts, something frustrating happens: every platform starts telling a different story about your conversions.
Meta claims 47 conversions. Google reports 31. LinkedIn shows 12. Add them up and you have more conversions than actual leads in your CRM. Sound familiar? This is the multi-account tracking problem, and it affects nearly every team running cross-channel campaigns at scale.
The root cause is not bad data. It is that each platform uses its own attribution logic, its own tracking window, and its own definition of what counts as a conversion. When you try to reconcile those numbers manually, you end up making budget decisions based on a patchwork of conflicting reports rather than a clear picture of what is actually driving revenue.
For a deeper look at how SaaS growth teams approach this challenge, this overview of revenue attribution for SaaS teams is a useful starting point.
This guide walks you through a clear, repeatable process for unifying conversion tracking across all your ad accounts. By the end, you will have a single source of truth that connects every ad click to pipeline and revenue, so your team can confidently scale what works and cut what does not. Whether you are managing two ad accounts or twenty, the same foundational steps apply.
The goal is not just to collect more data. It is to collect the right data in a way that is consistent, accurate, and actionable across every channel you run.
Step 1: Audit Your Current Ad Accounts and Conversion Events
Before you build anything new, you need to understand exactly what you are working with. Skipping this step is the single most common reason teams rebuild a fragmented tracking system on top of a new platform instead of actually fixing the problem.
Start by listing every active ad account across all platforms. That means Meta Ads, Google Ads, LinkedIn Campaign Manager, TikTok Ads, and any other channels you are running. For each account, document the conversion events currently being tracked. What actions are you measuring? Where are those events firing? Are they pixel-based, server-side, or both?
Once you have that inventory, look for three specific problems:
Missing events: Key actions like demo requests, free trial signups, or MQL form fills may not be tracked in every account. If LinkedIn is not capturing trial signups but Meta is, you cannot compare performance across channels on equal footing.
Duplicate tracking: Many accounts have both a pixel and a Conversion API firing for the same event without deduplication logic in place. This inflates conversion counts and makes optimization data unreliable.
Mismatched conversion definitions: One account might count a "lead" as any form submission. Another might count it only when a specific thank-you page loads. These inconsistencies make cross-channel comparison meaningless.
After identifying those gaps, define a unified set of conversion events that actually matter to your business. For most B2B SaaS teams, that list looks something like this: demo requests, free trial signups, MQL form fills, sales-qualified leads, and closed-won deals. Pick the events that map to real business outcomes, not just website activity.
Then standardize your naming conventions before you do anything else. If Meta calls it "Lead" and Google calls it "Form_Submit_Demo" and LinkedIn calls it "Demo Request," your centralized platform will struggle to aggregate them cleanly. Agree on a consistent naming structure across all accounts and document it somewhere your team can reference.
For more on building a clean lead tracking foundation, this guide on improving your lead tracking process covers the key principles in detail.
The output of this audit should be a simple spreadsheet: one row per ad account, columns for platform, account name, conversion events tracked, tracking method, and identified gaps. This document becomes your reference point for every step that follows.
Step 2: Set Up a Centralized Attribution Platform
Native ad platform reporting is designed to make each platform look as valuable as possible. That is not a conspiracy. It is just how incentives work. Meta will always show Meta's best numbers. Google will always show Google's best numbers. If you rely on native dashboards to evaluate cross-channel performance, you are comparing apples to oranges using each platform's own scale.
The solution is a centralized attribution platform that ingests data from all your ad accounts simultaneously and applies consistent logic across all of them. This is the infrastructure layer that makes everything else in this guide possible.
When evaluating platforms, prioritize these capabilities:
Native integrations with all major ad platforms: You want direct connections to Meta Ads, Google Ads, LinkedIn Campaign Manager, and TikTok Ads so that spend, impression, and click data flows in automatically. Manual exports and spreadsheet imports are not scalable and introduce data quality issues.
CRM and website connectivity: Ad data alone is not enough. You need your platform to connect lead and revenue data from your CRM alongside ad data, so you can see the full funnel from first click to closed deal. This is what separates a reporting tool from a true attribution platform.
First-party data and server-side tracking support: As browser-based tracking becomes less reliable, your attribution platform needs to support server-side event collection. If it only works with pixel data, its accuracy will degrade over time.
Multi-touch attribution modeling: You need the ability to assign credit across multiple touchpoints in the customer journey, not just the last click before conversion.
Cometly is built specifically for this use case. It connects to 70+ ad platforms and data sources, pulls spend and conversion data into a single dashboard, and links CRM and revenue data to ad performance so you can see which campaigns are generating pipeline, not just clicks. For a broader look at what to evaluate when choosing a platform, this breakdown of B2B revenue attribution software is worth reading alongside this step.
Once your platform is connected, give it 24 hours to pull in historical data. Your success indicator at this stage is straightforward: all ad accounts appear in a single dashboard with consistent spend, impression, and click data. If any account is missing or showing zero data, troubleshoot conversion tracking gaps before moving forward.
Step 3: Implement Server-Side Conversion Tracking
Here is the reality of browser-based pixel tracking in 2026: it is no longer reliable enough to serve as your primary conversion measurement method. Browser privacy restrictions, ad blockers, and Apple's App Tracking Transparency framework have collectively reduced the accuracy of pixel-only tracking in ways that compound over time.
Server-side tracking, also called Conversion API or CAPI depending on the platform, routes conversion events through your server rather than the user's browser. This means that when someone submits a demo request form, the conversion event is sent directly from your server to the ad platform, bypassing any browser-level restrictions that might block or delay a pixel from firing. Understanding why server-side tracking is more accurate than pixel-based methods helps clarify why this shift is necessary.
Here is how to implement it across the major platforms:
Meta Conversion API: Meta's CAPI allows you to send web events, app events, and offline events directly from your server. It is documented in Meta's Business Help Center and is now considered their recommended approach for accurate conversion measurement. Connect it to the same events your Meta pixel tracks, then implement deduplication using the event ID parameter so the same conversion is not counted twice.
Google Enhanced Conversions: Google's version of server-side tracking enriches your existing conversion tags with first-party data like hashed email addresses. This improves match rates between your conversion events and Google's user graph, making attribution more accurate across campaigns. For a detailed walkthrough, this guide to Google Ads enhanced conversions covers the setup process step by step.
LinkedIn Insight Tag server events: LinkedIn supports server-side conversion tracking through its Conversions API, which allows you to send conversion data directly from your server or CRM. This is particularly valuable for LinkedIn because its audience tends to use more privacy-focused browsers.
Event deduplication deserves its own emphasis here. When you run both pixel tracking and server-side tracking simultaneously, which is the recommended approach for maximum coverage, you must implement deduplication logic to prevent the same conversion from being counted twice. Both Meta and Google provide specific parameters for this in their Conversion API documentation. Without it, your conversion counts will be inflated and your optimization signals will be noisy.
One more critical detail: the quality of the data you send matters as much as the fact that you are sending it. Enrich your server-side events with first-party identifiers where possible. Hashed email addresses, phone numbers, and user IDs help ad platforms match your conversion events to their user profiles more accurately. Low-quality or incomplete event data reduces the effectiveness of the signals you are sending, which limits the optimization benefit.
Step 4: Define and Align Attribution Models Across Accounts
This is where most teams get confused, and understandably so. Each ad platform defaults to a different attribution window and model. Meta defaults to a 7-day click and 1-day view window. Google Ads uses data-driven attribution by default. LinkedIn uses a 30-day click attribution window. These differences mean the same conversion can legitimately be claimed by multiple platforms at the same time, which is why your total reported conversions often exceed your actual CRM leads.
The solution is not to argue with each platform's methodology. It is to stop using platform-reported conversions as your source of truth for cross-channel comparison.
In your centralized attribution platform, you select a consistent attribution model that you apply to all channels equally. This is the number you use for budget decisions. Platform-reported numbers become secondary reference points, not the basis for channel-level comparisons.
For B2B SaaS teams specifically, multi-touch attribution models are generally more appropriate than last-click. Here is why: B2B sales cycles typically involve multiple touchpoints across weeks or months. A prospect might see a LinkedIn ad, then search Google and click a search ad, then come back through a retargeting ad on Meta before requesting a demo. Last-click attribution gives all the credit to Meta and zero credit to LinkedIn and Google, which systematically undervalues the channels that created awareness and intent earlier in the journey.
Linear attribution distributes credit equally across all touchpoints. Time-decay attribution gives more credit to touchpoints closer to conversion. Position-based attribution gives more weight to the first and last touches. Each model tells a different story, and understanding which one fits your sales cycle is important. This overview of the five most common ad attribution models explains the tradeoffs clearly.
For a deeper look at how the B2B customer journey maps to attribution decisions, this resource on the B2B customer journey provides useful context.
Your success indicator at this step: you can clearly explain why your attribution platform reports different conversion numbers than each native ad account, and your team trusts the centralized number for budget allocation decisions. If people are still pulling numbers from individual platform dashboards to make spending decisions, this step is not complete.
Step 5: Build a Unified Conversion Dashboard
Data that lives in a platform but never gets looked at is not useful. The goal of this step is to build a reporting view that your team actually uses daily to make decisions, not a dashboard that looks impressive in a slide deck and gets ignored the rest of the time.
A well-built unified conversion dashboard shows conversions, cost per conversion, and revenue attributed across all ad accounts simultaneously. It lets you compare Meta, Google, LinkedIn, and TikTok side by side using the same attribution logic and the same conversion definitions you established in Steps 1 and 4.
Structure your dashboard with these layers of granularity:
Channel level: Total spend, conversions, cost per conversion, and attributed revenue by platform. This is your top-level view for budget allocation decisions across channels.
Campaign level: Performance broken down by individual campaigns within each channel. This is where you identify which campaign strategies are working versus which are draining budget.
Ad set and creative level: Granular performance data that lets you see which specific audiences and creatives are driving conversions. This is where optimization decisions get made.
The most important thing to include alongside lead volume metrics is pipeline and revenue data. A dashboard that shows only clicks, impressions, and form fills is decorative. It tells you what happened at the top of the funnel but nothing about whether those leads actually turned into revenue. Connect your CRM data so that pipeline value and closed-won revenue appear alongside your ad metrics. For guidance on capturing that downstream data, this resource on tracking closed won revenue explains how to connect CRM outcomes to ad performance.
For a comprehensive view of which SaaS marketing metrics belong in this dashboard, this resource on SaaS marketing metrics covers the most important ones to track.
Set up automated alerts for significant changes in conversion volume or cost per conversion across any account. If a campaign's cost per demo request doubles overnight, you want to know immediately, not when you happen to log in three days later. Proactive monitoring prevents small issues from becoming expensive problems.
Step 6: Feed Enriched Conversion Data Back to Ad Platforms
Most teams think of conversion tracking as a one-way street: data flows from ad platforms into your attribution system. But the most sophisticated teams treat it as a loop. Clean, centralized conversion data is not just for your reporting. It is also fuel for the ad platform algorithms that determine who sees your ads next.
Here is the mechanism: when you send enriched conversion signals back to Meta, Google, and LinkedIn, their machine learning models learn what your best customers look like. If you only send a "Lead" event when someone fills out a form, the algorithm optimizes for form fillers. But if you also send a "Closed Won" event with revenue data when a lead becomes a paying customer, the algorithm starts optimizing for the types of people who actually buy from you.
This is the practical case for uploading offline conversions and CRM-matched revenue events to each platform. Meta's Offline Conversions API, Google's Enhanced Conversions for leads, and LinkedIn's Revenue Attribution all support this workflow. The process involves matching your CRM records back to ad platform users using hashed first-party identifiers like email addresses, then sending the downstream conversion events back to the platform. For a deeper understanding of this process, this guide on tracking offline conversions walks through how to close the attribution gap between marketing spend and revenue.
The compounding effect of this approach is significant. Better training data means better audience targeting. Better targeting means higher-quality leads entering your funnel. Higher-quality leads mean better downstream conversion rates. Over 30 to 60 days of feeding enriched signals, you should see cost per qualified lead begin to improve as the algorithms recalibrate toward your actual revenue data rather than surface-level form fills.
This is one of the clearest examples of how unified conversion tracking creates a strategic advantage, not just an operational convenience. Teams that close this loop consistently outperform teams that treat conversion tracking as a passive measurement exercise.
Putting It All Together: Your Multi-Account Tracking Checklist
Here is a quick-reference summary of the six steps covered in this guide:
1. Audit your ad accounts and conversion events across all platforms, identify gaps and inconsistencies, and standardize your conversion definitions and naming conventions.
2. Connect all ad accounts to a centralized attribution platform with native integrations, CRM connectivity, and support for server-side tracking and multi-touch attribution.
3. Implement server-side conversion tracking via Meta Conversion API, Google Enhanced Conversions, and LinkedIn's Conversions API, with event deduplication and first-party data enrichment.
4. Align attribution models across all channels using a consistent model in your centralized platform, and stop using platform-reported conversions as your cross-channel source of truth.
5. Build a unified dashboard that shows conversions, cost per conversion, and attributed revenue across all accounts at the channel, campaign, and creative level.
6. Feed enriched conversion data back to ad platforms so their algorithms optimize toward leads that close, not just leads that fill out forms.
This is an ongoing process, not a one-time setup. Review your conversion definitions quarterly as your product and go-to-market strategy evolve. Audit data quality monthly to catch tracking gaps before they distort your reporting. Update your attribution model as your sales cycle changes.
Cometly handles all six of these steps in one place. From connecting 70+ ad platform integrations to sending enriched conversion events back to Meta and Google, it is built specifically for B2B SaaS teams that need accurate, cross-channel attribution without stitching together multiple tools. Get your free demo and see a unified view of your conversion data across every ad account you run.
Tracking conversions from multiple ad accounts is not just a technical problem to solve. It is a strategic advantage to build. Teams that unify their conversion data make faster, more confident budget decisions and scale campaigns with less waste. The gap between teams that have this infrastructure and teams that do not compounds over time.
Start with Step 1 today. The audit costs nothing and takes a few hours. It will immediately reveal where your current tracking is broken and give you a clear picture of what needs to be fixed. Everything else in this guide builds from that foundation.
When you are ready to bring it all together in one platform, Get your free demo of Cometly and connect your ad accounts to see the unified view your team has been missing.