

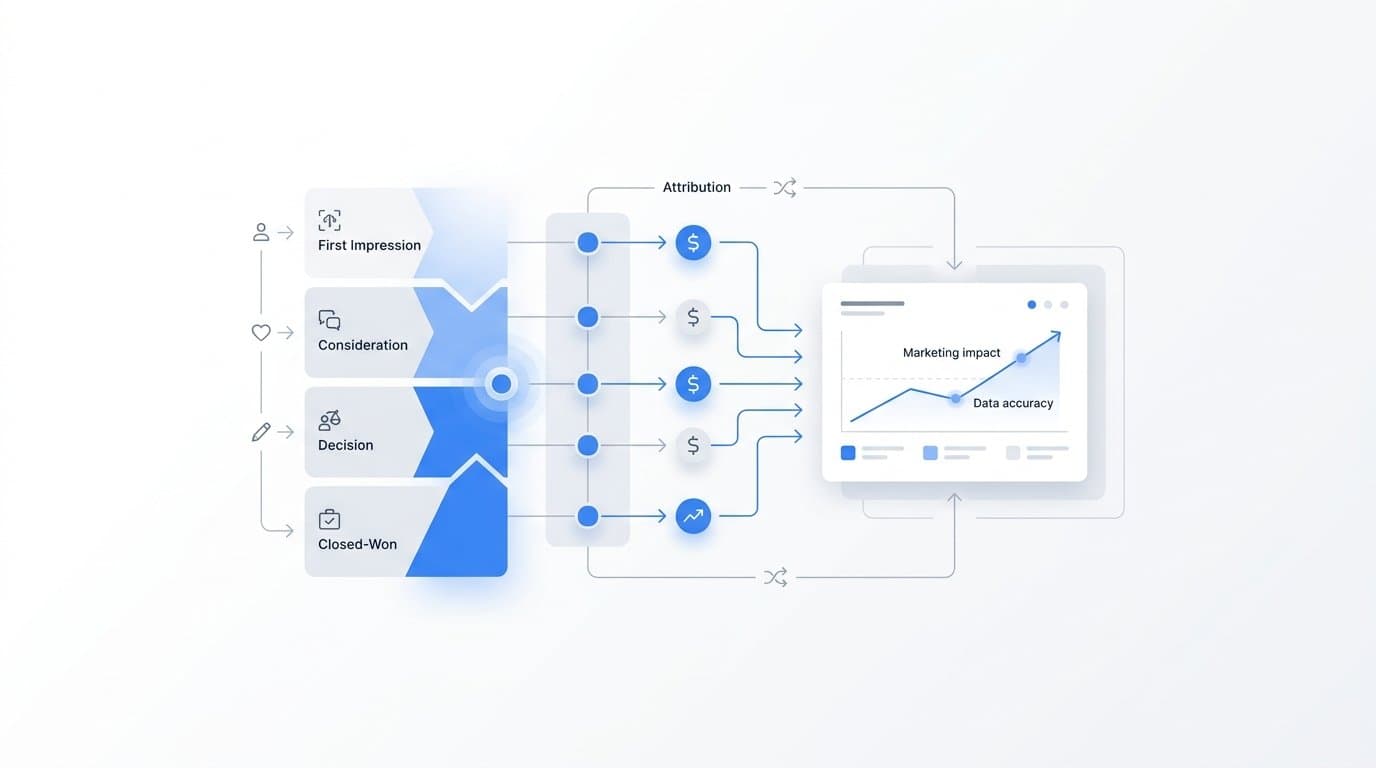
Most B2B SaaS marketing teams have a journey map somewhere. It lives in a Figma file, a Miro board, or a slide deck from last year's offsite. It looks great. And it is almost completely disconnected from the data that actually tells you what is driving revenue.
That is the problem this guide is designed to solve.
A user experience journey map is not just a visualization exercise. When built correctly, it becomes the structural backbone of your entire attribution strategy. It tells you which touchpoints matter at which stages, where prospects are dropping off, and which channels are genuinely moving buyers forward versus which ones just look good in a last-touch report.
The B2B SaaS buying cycle is long, involves multiple stakeholders, and spans a wide range of channels: paid search, paid social, organic content, sales outreach, product trials, and more. That complexity is exactly why a well-structured journey map is so valuable. It gives your team a shared, data-backed picture of how prospects actually move from first impression to closed-won revenue.
This guide walks you through a six-step process to build a user experience journey map that is grounded in real behavioral data, connected to your attribution models, and useful enough to inform actual budget decisions. Each step is designed for marketing operators: people who live in dashboards, manage campaigns, and need insights they can act on immediately.
By the end, you will have a framework that identifies every meaningful touchpoint in your customer journey, surfaces the friction points costing you conversions, and aligns your team on how performance is measured at each stage. Let's get into it.
Step 1: Define Your Ideal Customer Profile and Journey Scope
Before you map anything, you need to be precise about who you are mapping for. A journey map built for everyone is useful to no one. In B2B SaaS, this means starting with a specific buyer persona: their role, seniority level, company size, industry, and the core pain points that make them look for a solution like yours.
Think about your highest-value customer segment. What does their job title look like? Are they a VP of Marketing at a 50-person SaaS company, or a demand generation manager at a mid-market software firm? The touchpoints, content preferences, and decision-making dynamics are completely different depending on who you are mapping.
Once you have the persona locked in, define the scope of the journey. You have two main options here. You can map the full lifecycle from first awareness touchpoint all the way to closed-won revenue and onboarding. Or you can focus on a specific funnel segment, such as from first ad click to demo request, and go deep on that slice. For most teams starting this process, a focused scope is more actionable than trying to map everything at once.
Next, align your team on what success looks like. What are the key conversion milestones you want to track within this journey? For a typical B2B SaaS funnel, these might include a first website visit, a content download, a demo request submission, a sales call completed, a trial activation, and a closed deal. Each of these becomes a checkpoint in your map.
Common pitfall to avoid: Many teams try to build one journey map that covers multiple personas simultaneously. This almost always produces a map that is too vague to act on. Start with your single highest-value segment and build outward from there once you have a working model.
Success indicator: You can write one clear sentence that describes who this map is for and what conversion event marks the end of the journey. If you cannot do that, you are not ready to move to the next step.
Step 2: Gather Real Behavioral Data Across Every Touchpoint
This is where most journey maps either become genuinely useful or stay permanently theoretical. The difference is data. Instead of guessing what your prospect's journey looks like, you pull the actual behavioral signals from the platforms where that journey is happening.
Start with your ad platforms. Pull impression and click data across paid search and paid social channels. Look at which campaigns are generating first touches and which are appearing later in the path. Most ad platforms give you some version of this, but the data is siloed by channel, which is why you need a layer that connects them.
Next, pull your CRM pipeline data. Look at lead source fields, pipeline stage progression, and close dates. How long does it typically take a prospect to move from first contact to closed-won? Which lead sources are producing the highest conversion rates from demo to close? These patterns are critical inputs for your journey map.
Layer in your website analytics. Look at session data, page paths, and form submission events. Which pages are prospects visiting before they convert? Are there content pieces that appear consistently in high-converting paths? Where are people exiting without taking action?
Then bring it all together. This is where a multi-touch attribution platform like Cometly becomes essential. Rather than looking at each channel's data in isolation, you need a single view that shows you the actual sequence of touchpoints a prospect moved through before converting. Cometly connects your ad platform data, CRM events, and website behavior into one customer journey view, so you can see which touchpoints appear most frequently in paths that lead to revenue.
What to look for: Identify patterns in multi-touch sequences. What does a typical high-converting path look like? How many touchpoints does it involve? Which channels appear early versus late? And equally important: what does a path that stalls look like? Are there specific channel combinations that consistently fail to produce conversions?
Success indicator: You have a documented list of real touchpoints with frequency data and conversion correlation attached to each. This is your raw material for the next step.
Step 3: Map the Journey Stages and Assign Touchpoints
Now you organize what you have gathered into a structured framework. For B2B SaaS, the standard journey stages work well as a starting skeleton: Awareness, Consideration, Evaluation, Decision, and Onboarding. Your job is to populate each stage with the real touchpoints you identified in Step 2.
For each stage, document three things: the channels and content types a prospect typically encounters, the actions they are likely to take, and the emotional state or intent driving their behavior at that point.
During Awareness, a prospect might encounter a paid social ad, a blog post from organic search, or a mention in a newsletter. Their intent is exploratory. They are not ready to buy; they are recognizing a problem and starting to look for solutions. The touchpoints here are often high-volume but low-intent.
In Consideration, the prospect is actively comparing options. They are reading comparison pages, watching product demos on YouTube, engaging with case study content, and possibly signing up for a newsletter. The intent is sharper. They know they need a solution; they are figuring out which one fits.
During Evaluation, the prospect is in direct contact with your product or your team. This might be a demo request, a trial activation, or a sales call. The touchpoints here are fewer but higher-stakes. Attribution data at this stage often reveals which earlier touchpoints had the most influence on getting a prospect to this point.
The Decision stage is where the deal closes or stalls. Touchpoints include follow-up emails, proposal reviews, and sales conversations. And Onboarding covers the early product experience after purchase.
As you assign touchpoints to stages, flag two things: which touchpoints have reliable tracking data behind them, and which have gaps. Offline conversations, dark social mentions, and word-of-mouth referrals are real touchpoints that often go unmeasured. Acknowledging these gaps is part of building an honest map.
Finally, assign ownership. Marketing typically owns Awareness and Consideration. Sales and marketing share Evaluation. Sales owns Decision. Product and customer success own Onboarding. Clear ownership prevents gaps from being everyone's problem and no one's responsibility.
Success indicator: You have a visual or structured document showing each stage, the touchpoints within it, the buyer's intent at that stage, and the data source for each touchpoint.
Step 4: Identify Friction Points and Drop-Off Patterns
Here is where your journey map starts earning its keep. With stages mapped and touchpoints documented, you can now look systematically at where prospects are stopping and why.
Start with conversion rates between stages. What percentage of prospects who enter Awareness actually reach Consideration? What percentage of demo requests convert to closed deals? These stage-to-stage conversion rates reveal the structural weak points in your funnel. The biggest drops are your highest-priority friction points.
Then cross-reference those friction points with your attribution data. This is a powerful diagnostic move. If you see that a specific paid social campaign is driving a high volume of demo requests but those prospects almost never close, that is a friction signal worth investigating. The traffic is converting at the top of the funnel but stalling at Evaluation or Decision. That could mean a targeting problem, a messaging mismatch, or a handoff issue between marketing and sales.
Common friction patterns to look for in B2B SaaS journeys:
Ad clicks without conversion: Prospects click ads and visit the site but never take a next action. Often a landing page relevance or load speed issue.
Demo requests that never close: High volume of qualified-looking leads that stall in the sales process. Often a qualification mismatch or a gap in the sales follow-up sequence.
Trial sign-ups that churn early: Users activate but do not reach the activation milestone that correlates with retention. Often an onboarding gap or a product-market fit signal.
When you identify friction points, prioritize them by revenue impact rather than volume. A friction point that affects a small number of high-value prospects may matter more than a high-volume drop-off among low-fit leads.
Success indicator: You have ranked your top three friction points with supporting data from your attribution platform and CRM, and you can articulate the likely cause of each one.
Step 5: Connect Journey Stages to Attribution Models
This step is where your journey map becomes a true attribution strategy document. Each stage of the journey has different dynamics, and that means different attribution models are appropriate for answering different questions about performance.
The key insight here is that attribution models are not one-size-fits-all. The model you use to evaluate your awareness channels should not be the same model you use to measure which touchpoints drive closed-won revenue. Using the wrong model for the wrong question produces misleading conclusions and bad budget decisions.
Here is how to think about model alignment by stage:
Awareness stage: First-touch attribution is most useful here. It tells you which channels are introducing prospects to your brand for the first time. If you want to know whether your LinkedIn ads or your SEO content is generating more top-of-funnel awareness, first-touch gives you that answer.
Consideration and Evaluation stages: Multi-touch models are better suited here. Linear attribution distributes credit evenly across all touchpoints, which gives you a broad view of which channels are participating in the journey. Position-based models (which weight the first and last touches more heavily) are useful if you want to balance awareness and conversion credit. Time-decay models weight recent touchpoints more heavily, which can be useful for understanding what is influencing a prospect right before they request a demo.
Decision stage: Last-touch attribution tells you which channel or touchpoint gets credit for closing the deal. This is useful for understanding your highest-converting bottom-of-funnel assets, but it should not be used in isolation because it ignores everything that happened earlier in the journey.
A platform like Cometly lets you compare these attribution models side by side, so you can see how credit shifts across your touchpoints depending on which model you apply. This is enormously useful for resolving internal debates about channel value. Instead of arguing about whether paid search or paid social deserves more budget, you can show how each channel performs under different attribution lenses and make a data-backed case.
Document the attribution logic for each stage in your journey map. Your team should be able to look at any stage and immediately understand how performance is being measured there and why that model was chosen.
Success indicator: Each journey stage has a defined attribution approach, and every member of your team can explain the reasoning behind the model choice for that stage.
Step 6: Validate the Map With Real Conversion Data
A journey map built on assumptions is a hypothesis. A journey map validated against real conversion data is a strategy. This step is about closing that gap.
Pull your closed-won customer data from the last three to six months. For each customer, look at the actual touchpoint sequence that preceded their conversion. Did they follow the path your map assumes? Or did many of them take routes you did not anticipate?
Use your customer journey analytics to look for patterns among your best customers specifically. Which touchpoints appeared most frequently in the journeys of customers who converted quickly, retained well, and expanded their contracts? Those are the touchpoints worth investing in and protecting.
You will almost certainly find surprises. A channel you assumed was low-impact might appear consistently in your best customers' journeys. A piece of content you invested heavily in might barely show up. That is valuable. It means your budget and your messaging can be realigned around what is actually working rather than what you assumed was working.
Cometly's customer journey analytics make this validation process significantly faster by giving you a real-time view of the paths that led to conversion across all your channels. Instead of manually piecing together data from multiple platforms, you can see the full journey in one place and filter by customer segment, deal size, or conversion event.
Once you have validated findings, share them with your sales and product teams. Marketing rarely has full visibility into what happens after a lead is handed off, and sales rarely has full visibility into what happened before the lead arrived. Bringing validated journey data into a cross-functional conversation creates alignment on where marketing has the most influence and where the handoff process needs work.
Success indicator: Your journey map reflects real conversion patterns validated by attribution and CRM data. The assumed path and the actual path are either aligned or you have documented where they diverge and why.
Putting Your Journey Map to Work
A user experience journey map built on real attribution data is not a deliverable. It is a system. The six steps above give you a repeatable framework you can run quarterly as your campaigns evolve, your buyer behavior shifts, and new channels enter your mix.
Here is a quick checklist to audit where you stand:
ICP defined: You have a clear persona and a defined scope for the journey you are mapping.
Touchpoint data gathered: You have pulled real behavioral data from your ad platforms, CRM, and website analytics.
Stages mapped: Every touchpoint is assigned to a journey stage with ownership and data source documented.
Friction identified: Your top three drop-off points are ranked by revenue impact with supporting data.
Attribution model aligned: Each stage has a defined attribution approach your team understands and agrees on.
Map validated: Your assumed journey path has been checked against real closed-won customer data.
The teams that get the most value from this process are those who treat the journey map as a living document, updated continuously as new conversion data flows in. Cometly gives you the platform to do exactly that: as new customer journeys are tracked and new attribution data is captured, your understanding of what drives revenue gets sharper over time.
A journey map is only as useful as the data feeding it. If your tracking has gaps, your map will have blind spots. If your attribution is inaccurate, your conclusions will be wrong. Getting the data layer right is not a technical detail; it is the foundation everything else is built on.
If you are ready to see every touchpoint in your customer journey backed by accurate, real-time attribution data, Get your free demo and start building a journey map that actually drives decisions.



