

Most B2B SaaS marketers are making budget decisions based on an incomplete picture. A prospect clicks a LinkedIn ad, visits your website, bounces, comes back three days later through organic search, downloads a guide, watches a product demo video, disappears for a week, and then converts through a branded Google search. What does your attribution data show? The Google search. That is the last click, and it gets all the credit.
This is not a minor data inconvenience. It is a structural blind spot that shapes how budgets get allocated, which channels get scaled, and which ones get cut. When you cannot see the full website customer journey, you are optimizing for the final step while the real influence happens upstream, invisible and uncredited.
Understanding the complete journey from first ad impression to closed-won revenue is not just a nice analytical exercise. It is a genuine competitive advantage. Teams that can see every touchpoint make smarter decisions about where to invest, which content is actually moving prospects through the funnel, and how to engineer the paths that lead to high-value customers.
This article covers everything you need to build that visibility. We will walk through the anatomy of a B2B website customer journey, the most common places marketers lose the trail, how to set up tracking that captures the full picture, how attribution models reveal different parts of the story, and how to turn journey data into revenue decisions that actually move the needle.
The Anatomy of a B2B Website Customer Journey
The website customer journey in a B2B SaaS context is not a single visit. It is a multi-session, multi-channel sequence of touchpoints that begins before a prospect ever lands on your site and often continues long after they first convert. Thinking of it as one event is where most tracking strategies go wrong from the start.
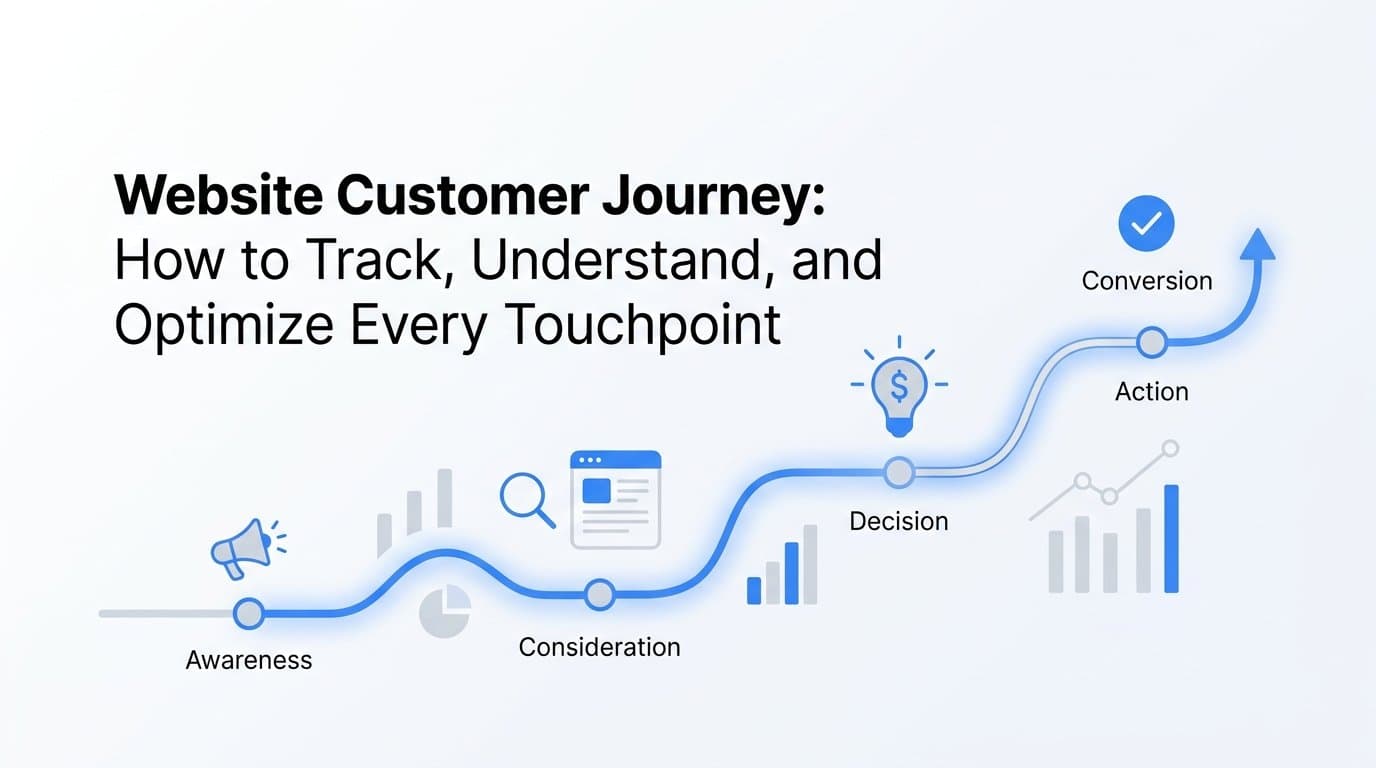
At the broadest level, the journey moves through three core stages: awareness, consideration, and decision. But in practice, these stages are not clean or linear. Prospects cycle back, revisit content, and move between channels in ways that can be difficult to predict or map without the right data infrastructure.
Awareness: This is first discovery. A prospect encounters your brand through a paid ad on LinkedIn, a Google search result, a mention in an industry newsletter, or a social post. They may land on your site, spend 45 seconds on a blog post, and leave without any identifiable action. This visit is often invisible in standard reporting, yet it is the beginning of the journey.
Consideration: Return visits define this stage. The prospect comes back, often through a different channel, to go deeper. They read comparison pages, explore your feature documentation, watch a demo video, or download a resource. They are evaluating whether your solution fits their problem. This stage can span days or weeks, and in B2B SaaS, it frequently involves multiple people from the same organization researching independently.
Decision: This is the conversion moment: a demo request, a trial signup, a contact form submission, or a direct sales inquiry. By the time a prospect reaches this stage, they have typically consumed a significant amount of content and made several return visits. The decision stage is the most visible part of the journey, which is exactly why it tends to receive disproportionate attribution credit.
B2B journeys are fundamentally more complex than B2C for several reasons. Buying decisions involve multiple stakeholders, each with their own research behavior and their own path through your website. Research cycles are longer, often stretching across weeks or months. And the vast majority of early-stage touchpoints happen anonymously, before a prospect ever fills out a form or identifies themselves in your CRM. This means that for most of the journey, you are tracking behavior without a name attached to it, which makes connecting the dots across sessions and channels genuinely difficult without the right technical foundation.
Where Most Marketers Lose the Trail
Even teams with solid analytics setups tend to have significant gaps in their journey data. These gaps are not random. They cluster around a few predictable problem areas, and understanding them is the first step toward closing them.
Cross-device fragmentation: A prospect sees your ad on their phone during a commute, visits your site on mobile, and then returns on their work laptop to request a demo. Without identity resolution or a persistent identifier that connects these sessions, these look like two separate users in your analytics. The mobile visit gets no credit, and the desktop session appears to be a first touch when it is actually a return visit deep in the consideration stage.
Cross-channel disconnection: Ad platforms, website analytics tools, and CRM systems each operate in their own data environment. A Meta ad click that drove the initial visit is recorded in Meta Ads Manager. The website behavior is recorded in your analytics platform. The lead creation and opportunity data lives in your CRM. When these systems are not connected, no single tool can show you the complete path from ad impression to closed revenue. This is the data fragmentation problem, and it affects many B2B SaaS marketing teams regardless of how sophisticated their individual tools are.
The anonymity gap: Most early-stage visitors never fill out a form. They research, evaluate, and move on without leaving any identifiable information. This means that the top of your funnel is largely opaque in standard reporting. You can see aggregate traffic patterns, but you cannot connect individual anonymous sessions to the eventual conversion that happens weeks later when that same person finally raises their hand.
Last-click distortion: Relying on last-click attribution or native ad platform reporting creates a systematically distorted picture of the journey. Channels that appear at the end of the funnel, typically branded search or direct traffic, receive outsized credit. The LinkedIn campaigns, content downloads, and retargeting ads that built awareness and moved prospects through consideration receive little or none. Over time, this distortion shapes budget decisions in ways that quietly undermine pipeline growth. Teams cut the channels doing the heavy lifting upstream because the data does not show their contribution.
The result of these combined blind spots is a marketing operation that is optimizing for a fraction of the real story. Decisions get made based on what is visible rather than what is true, and the gap between the two is often substantial.
How to Track the Full Customer Journey on Your Website
Building accurate journey tracking requires more than installing a pixel and connecting Google Analytics. It requires a technical foundation built around first-party data, server-side event tracking, and the integration of your ad platforms with your CRM data. Each layer addresses a different part of the visibility problem.
First-party data collection is the foundation. With third-party cookies increasingly restricted across browsers and iOS privacy updates limiting the reach of browser-based tracking, the data you collect directly from user interactions on your own website has become the most reliable signal available. First-party data is not subject to the same deprecation risks as third-party tracking, and it gives you a persistent, accurate record of behavior that you control.
Server-side event tracking addresses the limitations of browser-based pixels. When a user has an ad blocker installed or their browser restricts cookie-based tracking, a standard pixel fires incompletely or not at all. Server-side tracking captures events at the server level before they are subject to browser restrictions, meaning you get a more complete and accurate record of what users are actually doing on your site. This matters particularly for conversion events, where a missed fire means a missed attribution signal.
Conversion APIs extend this logic to your ad platforms. Meta's Conversion API and Google's Enhanced Conversions allow you to send event data directly from your server to the ad platform, bypassing the browser entirely. This means that conversions happening in environments where pixels are blocked still get attributed correctly, and your ad platform's optimization algorithms receive the complete signal they need to improve targeting and reduce cost per acquisition.
A complete tracking setup connects these layers in sequence. Ad platform data flows into your tracking infrastructure, capturing the source and campaign of each visit. Website behavior events are collected server-side and enriched with session context. Those events are then linked to CRM data, including lead creation, opportunity stage changes, and closed-won deals, so that the full journey from first click to revenue is visible in a single place.
Event deduplication is a critical detail that is often overlooked. When you run both browser-based and server-side tracking simultaneously, the same conversion event can be recorded twice, once by the pixel and once by the server. Without deduplication logic, this inflates your reported conversion numbers and sends duplicate signals to ad platform algorithms, which distorts their optimization. A well-configured setup uses event IDs to match and deduplicate events across both tracking methods, ensuring that each conversion is counted once and attributed accurately.
Data enrichment adds the final layer of context. Rather than recording raw events, an enriched setup attaches meaningful metadata to each touchpoint: which campaign drove the visit, what content was consumed, where the user is in the funnel, and how this session relates to previous ones. This context is what transforms a list of events into a coherent picture of the journey.
Attribution Models and What They Reveal About Your Journey
Once you have the tracking infrastructure in place, attribution models determine how credit gets distributed across the touchpoints in a journey. Different models tell fundamentally different stories about the same data, and understanding those differences is essential for making sense of what you are seeing.
First-touch attribution gives all credit to the first interaction a prospect had with your brand. This model is useful for understanding which channels are best at generating initial awareness and bringing new prospects into your funnel. Its weakness is that it ignores everything that happened after that first touch, which in a long B2B sales cycle is often where most of the influence occurs.
Last-click attribution does the opposite, assigning all credit to the final touchpoint before conversion. This model is simple and easy to implement, which is why it remains common in native ad platform reporting. But for B2B SaaS teams with multi-week sales cycles, it systematically undervalues the channels and content that built awareness and drove consideration earlier in the journey.
Linear attribution distributes credit equally across all touchpoints in the journey. This is more equitable than single-touch models but can be overly simplistic, treating a 30-second homepage visit the same as a 15-minute product demo video watch.
Data-driven attribution uses machine learning to assign credit based on the actual contribution of each touchpoint to the conversion outcome. This model requires sufficient conversion volume to generate reliable patterns, but when it has the data it needs, it tends to produce the most accurate picture of channel influence.
Multi-touch attribution, as a category, gives B2B SaaS teams a more honest view of the journey than any single-touch model can provide. By distributing credit across all touchpoints, it surfaces the early-stage content and ads that are genuinely influencing pipeline even when they are not the final conversion trigger. This is particularly valuable for justifying investment in top-of-funnel channels that would appear to have zero ROI under a last-click model.
The most sophisticated marketing teams do not commit to a single attribution model. They compare multiple models side by side to understand both the channels that open doors and the ones that close deals. A channel that looks weak under last-click attribution might look essential under first-touch, and that comparison tells you something important about its role in the journey. The goal is not to find the one correct model but to use attribution as a lens for asking better questions about how your marketing is actually working.
Turning Journey Data Into Revenue Decisions
Tracking the customer journey and understanding attribution models are means to an end. The end is making better decisions about where to invest, what to scale, and how to engineer the paths that lead to high-value customers. This is where journey analytics move from descriptive to prescriptive.
Once you can see which touchpoint sequences lead to closed-won revenue, you can build campaigns that deliberately replicate those paths. If you notice that prospects who engage with a specific piece of content early in their journey tend to convert at a higher rate and with a shorter sales cycle, that is a signal to invest more in promoting that content, to use it in retargeting sequences, and to build more content that serves a similar function in the journey.
Connecting ad spend to pipeline and revenue, rather than just leads or form fills, changes the nature of the ROI conversation entirely. A channel that generates a high volume of leads at a low cost per lead might look like a winner in surface-level reporting. But if those leads rarely progress to opportunity or closed-won stages, the real cost per acquired customer is much higher than it appears. Journey data that connects ad spend all the way to revenue allows growth teams to calculate true ROI per channel and reallocate budget with confidence rather than guesswork.
This connection also improves the performance of your ad platforms directly. When you send enriched conversion signals back to Meta, Google, or LinkedIn, including downstream events like opportunity creation and closed-won revenue rather than just form fills, the platform's optimization algorithms have better data to work with. They can identify the audience segments and creative combinations that lead to real revenue, not just clicks or leads, and optimize toward those outcomes. The result is better targeting, lower cost per acquisition, and campaigns that improve over time.
AI plays an increasingly important role in making journey insights actionable at scale. Manually analyzing thousands of touchpoint sequences to find patterns in high-converting journeys is not realistic for most teams. AI can surface those patterns automatically, identifying which ad combinations, content sequences, and channel mixes are associated with the highest-value customers and recommending where to focus budget and creative investment. This moves the team from reactive analysis to proactive optimization, with the data doing the heavy lifting.
Building a Journey-Aware Marketing Stack
The principles that run through everything covered in this article point toward a consistent set of requirements for any team serious about understanding their website customer journey. Track every touchpoint using server-side and first-party data methods that are not subject to browser restrictions. Connect your ad platforms, website analytics, and CRM into a single source of truth so the full journey is visible in one place. Use attribution models not as definitive answers but as lenses that reveal different aspects of how your marketing influences revenue. And feed enriched conversion signals back to your ad platforms so their algorithms optimize toward real outcomes.
This is a meaningful amount of technical and strategic work to coordinate, and for most B2B SaaS marketing teams, the challenge is not understanding what needs to happen but having the infrastructure to make it happen without stitching together a dozen disconnected tools.
Cometly is built to be the connective layer that brings this together. It tracks the customer journey from the first ad click through to closed-won revenue, connecting your ad platforms, website behavior data, and CRM events into a single attribution view. It surfaces AI-driven recommendations that identify high-performing ads and campaigns across every channel, so you can scale what is working with confidence. And it sends enriched, conversion-ready events back to Meta, Google, and other ad platforms, improving targeting and ad ROI by giving platform algorithms the complete signal they need.
For B2B SaaS teams that need to demonstrate the revenue impact of every marketing dollar, Cometly provides the visibility to do that accurately and at scale. The result is a marketing operation that makes decisions based on the full story, not just the last click.
The website customer journey is not a single moment. It is a sequence of decisions that unfolds across sessions, devices, and channels over days or weeks. Marketers who can see the full sequence make smarter budget decisions, build better campaigns, and compound their results over time. Those who cannot are optimizing for the final step while the real influence happens upstream, uncredited and invisible.
If you are ready to start mapping the complete journey from first ad impression to closed revenue, Get your free demo and see how Cometly gives you the attribution clarity to make every marketing decision with confidence.



