You open your reporting dashboard on a Monday morning and the numbers don't add up. Meta says you drove 80 conversions last week. Google Analytics shows 45. Your CRM has 30 closed deals. Three different systems, three different stories, and a budget decision sitting on your desk waiting for an answer.
If this sounds familiar, you are not alone. Ad conversion discrepancies are one of the most common sources of confusion in paid advertising, and they cost marketing teams real money. Not just in wasted ad spend, but in misguided optimization decisions, inaccurate ROAS calculations, and budget allocations built on numbers that don't reflect reality.
Here is the important thing to understand before we go any further: discrepancies are not a sign that your tracking is broken. They are a structural reality of how modern advertising measurement works. Every platform measures differently, every model assigns credit differently, and the technical infrastructure holding it all together has real limitations. The goal is not to make the numbers match perfectly. The goal is to understand why they diverge and build a system that gives you a reliable, consistent view of what is actually driving results.
This article breaks down the core reasons ad conversion discrepancies exist, the technical gaps that make them worse, and the practical steps you can take to minimize confusion and make better decisions with your data.
Why Every Ad Platform Counts Conversions Differently
The most fundamental reason your numbers never match is simple: each platform has its own definition of what counts as a conversion. Meta, Google Ads, and your analytics tool are not measuring the same thing, even when they are all tracking the same purchase or lead form submission.
Start with attribution windows. Meta's default attribution setting is a 7-day click and 1-day view window. That means if someone clicks your Meta ad and converts any time within the next seven days, Meta claims credit. If someone simply sees your ad without clicking and then converts within 24 hours, Meta still claims credit via view-through attribution. Google Ads, by default, uses a 30-day click window. Google Analytics 4 uses its own model depending on how it is configured. These windows overlap constantly in multi-channel campaigns, which means the same customer can be legitimately claimed by multiple platforms at the same time. Understanding conversion window attribution is essential before drawing any conclusions from platform reports.
View-through attribution deserves special attention because it is one of the biggest sources of inflated conversion counts on social platforms. Picture a user who sees your Meta ad in their feed but does not click it. They later search for your product on Google, click a search ad, and convert. Google counts that as a click conversion. Meta counts it as a view-through conversion. Both platforms are technically correct by their own rules. Both are claiming the same customer. This kind of overlap is not an error. It is a feature of how each platform is designed to measure its own contribution.
There is also a structural incentive at play here. Ad platforms are businesses, and their revenue depends on advertisers believing their platform is delivering results. Default attribution settings tend to favor broader windows and more inclusive counting rules. That is not a conspiracy. It is just how these systems are built, and it is why you should never take a single platform's reported conversion number at face value without understanding the methodology behind it.
Counting methodology adds another layer of complexity. Some platforms count every conversion event, meaning one user who converts twice counts as two conversions. Others count unique converting users. Some use modeled conversions to fill in gaps left by privacy restrictions. Unless you have checked the specific settings in each platform, you may be comparing a raw event count from one tool against a unique user count from another, which will always produce different totals even with perfect tracking.
The takeaway here is not that any platform is lying to you. It is that each one is telling a different version of a true story, and reconciling those versions requires understanding the rules each one is playing by.
The Technical Gaps That Make Discrepancies Worse
Beyond the measurement philosophy differences, there are real technical reasons why your numbers diverge. These are the gaps in your tracking infrastructure that cause data to go missing or get counted twice, and they have become significantly more pronounced over the past few years.
Browser-based pixel tracking is the foundation of most ad measurement, and it is increasingly unreliable. Ad blockers prevent pixels from firing. Safari's Intelligent Tracking Prevention limits cookie lifespans. Firefox blocks third-party trackers by default. The iOS privacy changes that began rolling out in 2021 fundamentally altered how accurately ad platforms could track conversions from Apple device users. The cumulative effect is that client-side pixels now miss a meaningful portion of conversion events, causing analytics tools to under-report while the actual business results remain unchanged. Teams dealing with these gaps should review strategies for fixing conversion tracking gaps before assuming their data is accurate.
Cross-device journeys create another gap that pixel tracking struggles to bridge. A user sees your ad on their phone during their commute, does their research on a desktop at work, and converts on their laptop at home. Standard pixel attribution has no reliable way to connect those three sessions into a single customer journey. The result is often a misattributed or completely unattributed conversion that shows up as direct traffic in your analytics tool while the ad platform that influenced the decision gets no credit at all.
UTM parameter stripping is a more common problem than most marketers realize. Redirect chains, link shorteners, certain email clients, and some CRM systems strip UTM parameters before the user lands on your site. When that happens, the session arrives without source data and gets classified as direct or organic traffic in your analytics tool. The ad platform still knows the user clicked the ad because the click was recorded at the platform level. But your analytics tool has no idea, which creates a gap between what the ad platform reports and what your analytics shows.
On the opposite end of the spectrum, deduplication failures cause over-reporting rather than under-reporting. When both a browser pixel and a server-side event fire for the same conversion without proper deduplication logic, the ad platform receives two signals for one event and counts it as two conversions. This is a particularly common problem for teams that have implemented server-side tracking as a fix for pixel reliability issues but have not set up deduplication correctly. The result is inflated conversion counts that make your ROAS look better than it actually is, which can lead to scaling decisions based on numbers that do not reflect reality.
Each of these technical issues has a fix, but they require intentional infrastructure work rather than just checking a box in your platform settings.
Attribution Models: The Variable Most Marketers Never Check
Even if your tracking were technically perfect, you would still see different conversion totals across platforms because of attribution model differences. This is the hidden variable that causes enormous confusion during reporting, and most marketing teams never audit it.
Here is how the major models work. Last-click attribution gives 100% of the conversion credit to the final touchpoint before the conversion event. First-touch attribution gives all the credit to the very first interaction in the customer journey. Linear attribution distributes credit equally across every touchpoint. Data-driven attribution uses algorithmic weighting based on which touchpoints statistically correlate with conversion outcomes.
The same customer journey will produce completely different conversion counts depending on which model each platform is using. Imagine a customer who first discovers your product through a Meta ad, then searches your brand name on Google and clicks a search ad, then converts after clicking a retargeting ad. Under last-click, Google's retargeting ad gets all the credit. Under first-touch, Meta gets all the credit. Under linear, credit is split three ways. Under data-driven, the weighting depends on the platform's algorithm. None of these answers is objectively wrong. They are just different lenses on the same journey.
The problem is that most marketers compare a last-click number from Google Analytics against a multi-touch number from Meta without realizing they are not comparing equivalent metrics. It is like comparing a team's total points scored against their points scored in the fourth quarter and wondering why the numbers are different. They are measuring different things.
Most platforms do not make their default attribution model obvious. Google Ads has shifted toward data-driven attribution as its default for many account types. Google Analytics 4 also defaults to data-driven attribution in its reports. Meta uses its own multi-touch logic for optimization while reporting on a last-touch basis in some views. Unless you have explicitly checked the attribution settings in each platform and aligned them to a consistent methodology, you are almost certainly comparing apples to oranges every time you pull a report.
Aligning on a single attribution model across your stack is the first practical step toward producing numbers that are actually comparable. It does not eliminate discrepancies entirely, but it removes one of the most significant sources of confusion from the equation.
How to Diagnose Discrepancies in Your Own Account
Understanding why discrepancies exist is useful. Knowing how to find the specific cause in your own account is what actually moves the needle. A structured audit process will help you identify whether you are dealing with an over-reporting problem, an under-reporting problem, or a methodology mismatch.
Start with attribution window and model settings. Log into each ad platform and document the current attribution window and model configuration. Write it down. You will likely find that different platforms are using different windows, different counting methods, and different model types. This documentation alone often explains a significant portion of the discrepancy before you touch a single line of tracking code. For a deeper walkthrough of this process, see our guide on how to fix attribution discrepancies in data.
Next, verify that your pixels and server-side events are firing correctly. Use the diagnostic tools available in each platform, such as Meta's Events Manager or Google's Tag Assistant, to confirm that conversion events are being received and that deduplication is working as expected. If you are running both a browser pixel and a server-side integration, check whether both are sending the same event ID so the platform can deduplicate properly. A missing or inconsistent event ID is one of the most common causes of double-counting.
Audit your UTM consistency across all campaigns. Pull a sample of recent campaign URLs and verify that UTM parameters are intact when users land on your site. Check your analytics tool for sessions attributed to direct traffic that seem unusually high relative to your paid campaign volume, as this is often a sign that UTMs are being stripped somewhere in the chain.
Then use your CRM as the ground truth. Your CRM contains the most reliable record of what actually happened in your pipeline. A lead that was created, a deal that was closed, a subscription that was activated. These are real business events that are not subject to the same measurement limitations as pixel tracking. Compare the number of qualified leads or closed deals in your CRM against what each ad platform is reporting for the same time period. The gap between CRM data and platform-reported conversions tells you how much of your reported conversion volume is real versus inflated by attribution overlap or double-counting.
This comparison also helps you determine the direction of the problem. If your ad platform is reporting far more conversions than your CRM shows, you likely have an over-reporting issue driven by broad attribution windows, view-through counting, or deduplication failures. If your CRM shows more activity than your analytics tool is capturing, you likely have an under-reporting issue caused by pixel failures, cross-device gaps, or UTM stripping.
Server-Side Tracking and First-Party Data as the Infrastructure Fix
Once you have diagnosed where your discrepancies are coming from, the most impactful infrastructure change you can make is implementing server-side tracking alongside first-party data enrichment. This combination addresses the technical causes of under-reporting while also improving the quality of conversion signals you send back to ad platforms.
Server-side tracking works by sending conversion data directly from your server to ad platforms, bypassing the browser entirely. When a user converts on your site, instead of relying on a JavaScript pixel to fire in their browser, your server sends the event data directly to Meta's Conversion API or Google's Enhanced Conversions endpoint. This approach is not affected by ad blockers, browser privacy settings, or iOS restrictions because it never touches the browser environment at all. The result is a more complete and accurate conversion signal that reflects what actually happened rather than what a browser pixel managed to capture. Understanding what the Conversion API is and how it works is a useful starting point before implementation.
First-party data enrichment takes this a step further. When you pass CRM identifiers such as hashed email addresses, phone numbers, or customer IDs along with your conversion events, ad platforms can match those events to their user profiles with much higher accuracy. This improves match rates significantly, which means the platform has better data to work with for optimization and attribution. It also helps close the gap between what the ad platform sees and what actually happened in your pipeline, because you are grounding the conversion signal in real customer data rather than anonymous browser behavior. Teams running Facebook campaigns can follow a detailed process for syncing conversion data to Facebook Ads to put this into practice.
Deduplication is non-negotiable when running both pixel and server-side tracking simultaneously. Without it, a single conversion generates two signals, and the ad platform counts it twice. The mechanism for deduplication is straightforward: you assign a unique event ID to each conversion event and include that same ID in both the pixel event and the server-side event. The platform uses the event ID to recognize that both signals refer to the same conversion and counts it only once. Setting this up correctly is a technical step that many teams skip, and it is one of the most common causes of inflated ROAS figures in accounts that have implemented server-side tracking.
Together, server-side tracking and first-party data enrichment do not eliminate discrepancies entirely. But they significantly reduce the technical causes of both under-reporting and over-reporting, giving you a cleaner foundation for measurement and a better signal for the ad platform's own optimization algorithms.
Building One Reliable View of Conversion Performance
Even with perfect tracking infrastructure and aligned attribution models, you will still be looking at multiple dashboards with slightly different numbers unless you centralize your reporting. The final piece of the solution is building a single source of truth that pulls all of your conversion data into one consistent view.
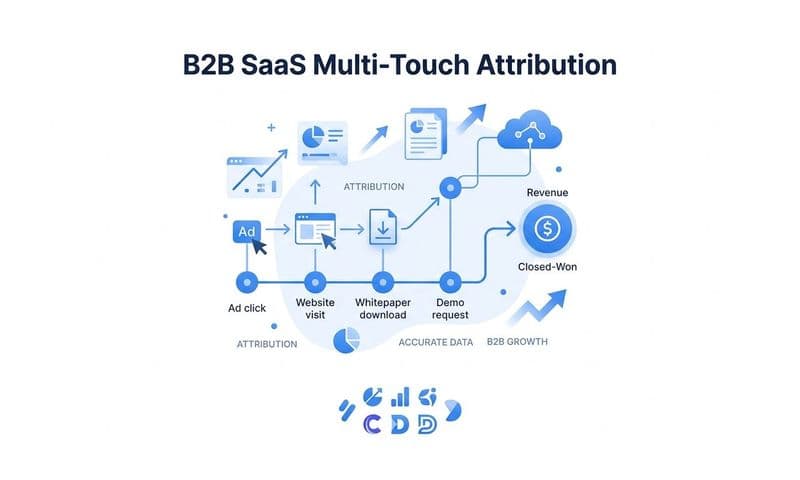
A centralized attribution platform ingests raw data from all of your ad channels via API, matches ad interactions to CRM records using consistent identifiers, and applies a single attribution model across all channels. This gives you an apples-to-apples comparison of performance across Meta, Google, LinkedIn, and any other channel you are running, without having to manually reconcile conflicting platform reports every week.
The most important decision in this process is defining your primary conversion metric. Every team has to agree on what counts as a real conversion for the purposes of budget and optimization decisions. For most B2B SaaS companies, that means connecting ad spend to pipeline created or revenue closed, not just lead form submissions or trial signups. When your primary metric is rooted in actual business outcomes rather than top-of-funnel events, the noise from attribution window differences and view-through counting becomes much less relevant to your decisions.
This is exactly the problem Cometly is built to solve. Cometly connects your ad platforms, CRM, and website into a single attribution system that tracks the entire customer journey in real time. Instead of reconciling conflicting reports from Meta, Google, and your CRM separately, you get one dashboard that shows which ads and channels are actually driving pipeline and revenue. Cometly's AI analyzes performance across every channel and surfaces recommendations for where to scale and where to cut, based on data that is grounded in real business outcomes rather than platform-reported metrics. You can compare attribution models side by side, see how credit is distributed across touchpoints, and feed enriched conversion events back to Meta and Google to improve their targeting and optimization.
The result is a marketing team that makes budget decisions with confidence rather than spending Monday mornings trying to figure out which number to believe.
Putting It All Together
Ad conversion discrepancies will never be zero. That is not a failure of your tracking setup. It is a reflection of how multi-platform advertising measurement fundamentally works. Every platform has its own attribution logic, every model assigns credit differently, and the technical infrastructure connecting them has real limitations that no single fix can fully eliminate.
But discrepancies can be understood, minimized, and managed. Align your attribution windows and models across platforms so you are comparing equivalent methodologies. Implement server-side tracking with proper deduplication to reduce both under-reporting and over-reporting caused by technical gaps. Enrich your conversion events with first-party CRM data to improve signal accuracy and match rates. And centralize your reporting in a single attribution platform that connects ad spend to pipeline and revenue, giving every team member one consistent view of what is actually working.
When you have that infrastructure in place, you stop debating which number is right and start making faster, smarter decisions about where to invest your budget.
Ready to stop reconciling conflicting reports and start seeing exactly which ads are driving revenue? Get your free demo of Cometly today and see how a single source of truth for your marketing data changes the way you optimize and scale.