For B2B SaaS marketing teams, choosing the wrong attribution model is not just an analytics problem. It is a budget problem. When you credit the wrong channel, you scale the wrong campaigns. When you misread the customer journey, you cut the touchpoints that actually drive pipeline.
An attribution model comparison framework gives you a structured way to evaluate how different models interpret your conversion data, so you can make smarter decisions about where to invest. The challenge is that no single attribution model tells the complete story. First-touch attribution rewards awareness. Last-click attribution rewards closing. Linear attribution spreads credit evenly. Each lens reveals something different, and each can mislead you if used in isolation.
This guide walks through seven practical strategies for building and applying an attribution model comparison framework in a B2B SaaS context. Whether you are running paid search, paid social, or a multi-channel demand generation program, these strategies will help you cut through model bias, align your team around shared data, and connect ad spend to real revenue outcomes.
The goal is not to find one perfect model. The goal is to develop a repeatable process for comparing models, understanding their tradeoffs, and using that insight to allocate budget with confidence.
1. Define Your Conversion Goals Before Picking Any Model
The Challenge It Solves
Many B2B SaaS teams default to last-click attribution simply because it is the platform default. That is not a strategy. It is inertia. When your model selection is not anchored to a specific conversion goal, you end up optimizing for whatever the model happens to reward, which may have nothing to do with what actually drives revenue for your business.
The Strategy Explained
Before you compare a single model, map your attribution intent to your funnel stages. Awareness-focused campaigns, such as top-of-funnel content promotion or brand paid social, benefit most from first-touch analysis. Nurture campaigns that move prospects through consideration benefit from linear or time-decay models. Closing campaigns, like retargeting or demo request ads, benefit from last-touch review.
Think of it like this: asking which attribution model is best is like asking which lens is best for photography. The answer depends entirely on what you are trying to capture. Your conversion goal is the subject. The model is the lens. Choose the lens after you know the subject.
This alignment also prevents internal disagreements. When your demand gen team and your paid media team are measuring success with different models against different goals, you get conflicting reports and contested budget decisions. Defining goals first creates a shared reference point.
Implementation Steps
1. List your active campaigns and assign each one a primary funnel stage: awareness, consideration, or conversion.
2. For each funnel stage, identify the conversion event that matters most, such as a first form fill, a demo booking, or a closed-won deal.
3. Match each conversion event to the attribution model that best reflects how that event is typically influenced across touchpoints.
4. Document these assignments in a shared framework so your team applies consistent model logic across all reporting.
Pro Tips
Do not try to use one model to answer all questions simultaneously. Let each model serve a specific analytical purpose. A useful rule of thumb: use first-touch to evaluate channel reach, last-touch to evaluate channel conversion efficiency, and multi-touch models to understand the full journey contribution of each channel.
2. Run Multiple Attribution Models Side by Side
The Challenge It Solves
If you are only looking at one attribution model, you are only seeing one interpretation of your marketing data. The problem is that each model has a built-in bias. Last-click systematically undervalues awareness channels. First-touch ignores the nurture touchpoints that warm a lead before they convert. Running a single model in isolation does not just give you an incomplete picture. It actively distorts your budget decisions.
The Strategy Explained
Running first-touch, last-touch, linear, and data-driven models in parallel on the same data set is one of the most revealing exercises in marketing analytics. The divergence between models on the same conversion data tells you something important: which channels are being systematically over-credited or under-credited depending on which model your team is using.
Here is where it gets interesting. If paid search consistently gets high credit in last-touch but low credit in first-touch, that tells you it is a strong closing channel but not a strong discovery channel. If organic social gets high credit in first-touch but disappears in last-touch, it is contributing to pipeline initiation but not to final conversion. These are not flaws in the models. They are insights that only become visible when you compare models directly.
Platforms like Cometly make this kind of side-by-side comparison practical by pulling attribution data from your ad platforms, CRM, and website into a single view, so you can switch between models without rebuilding your reports from scratch.
Implementation Steps
1. Pull the same conversion data set and apply at minimum four models: first-touch, last-touch, linear, and data-driven.
2. Create a comparison table that shows channel-level credit across all four models for the same time period.
3. Identify the channels with the largest variance between models. These are your highest-priority channels to investigate further.
4. Use the variance as a conversation starter with your team, not as a definitive answer about which channel is best.
Pro Tips
Focus your analysis on the channels with the largest divergence across models. That divergence is where the most actionable insight lives. Channels that receive similar credit across all models are relatively stable. Channels with high variance deserve a deeper look at the actual conversion paths they appear in.
3. Segment Your Comparison by Customer Journey Length
The Challenge It Solves
Not all B2B SaaS deals move at the same speed. A self-serve product at a low price point might close in days. An enterprise deal with multiple stakeholders might take several months and dozens of touchpoints. When you apply the same attribution model across deals of wildly different lengths, you get distorted results that do not reflect how any of those deals actually behaved.
The Strategy Explained
Time-decay attribution, which gives more credit to touchpoints closer to conversion, is particularly problematic for long-cycle enterprise deals. If a prospect discovered your product through a LinkedIn ad six months ago and then converted after a sales demo last week, time-decay will heavily credit the demo-related touchpoints and almost ignore the original discovery channel. That is technically accurate in terms of timing, but it misrepresents the channel that initiated the relationship.
Segmenting your attribution comparison by deal velocity solves this. Group your deals into short-cycle and long-cycle buckets based on your own sales data, and then run your model comparison separately for each segment. You will likely find that different models perform better as analytical tools for different deal types.
This segmentation also prevents one deal type from skewing your overall attribution data. If enterprise deals make up a small percentage of your volume but a large percentage of your revenue, their long-cycle patterns can distort the attribution signals you are reading for your higher-volume, shorter-cycle segments.
Implementation Steps
1. Pull closed-won deal data from your CRM and calculate the average and median sales cycle length for different deal tiers or segments.
2. Define two or three deal velocity buckets based on your data, such as short-cycle (under 30 days), mid-cycle (30 to 90 days), and long-cycle (90 days or more).
3. Run your attribution model comparison separately for each bucket and note which channels appear most valuable in each segment.
4. Use these segmented insights to inform channel investment decisions specific to each deal type rather than applying a single budget logic across your entire mix.
Pro Tips
If your data volume is too low to segment cleanly, start with just two buckets: deals that closed faster than your median cycle length and deals that took longer. Even this simple split can reveal meaningful differences in how attribution models interpret channel contribution across your customer base.
4. Anchor Your Framework to Pipeline and Revenue, Not Just Leads
The Challenge It Solves
Lead volume is a weak proxy for channel quality. Many B2B SaaS teams have experienced the frustration of a channel that drives a high volume of leads that never convert to pipeline. When your attribution framework only measures leads, you can end up scaling channels that look productive on paper but contribute almost nothing to closed-won revenue.
The Strategy Explained
The fix is to connect your attribution comparison directly to CRM pipeline stages and revenue data. Instead of asking which channel drove the most leads, ask which channel drove the most marketing-qualified leads, the most opportunities, and the most closed-won deals. These are fundamentally different questions, and they often produce very different answers.
This is a core use case for revenue attribution platforms. When your ad platform data, CRM data, and payment or subscription data are connected in one place, you can trace a closed-won deal back through every marketing touchpoint that influenced it. That is when attribution stops being a reporting exercise and starts being a genuine budget allocation tool.
Cometly's integration with Stripe and CRM platforms is designed specifically for this kind of revenue-anchored attribution. By connecting ad spend data to actual subscription revenue, you can evaluate channel performance against the metric that actually matters: revenue generated per dollar spent, not leads generated per dollar spent.
Implementation Steps
1. Define the pipeline stages you want to attribute to marketing, typically MQL, SQL, Opportunity, and Closed-Won.
2. Connect your attribution platform to your CRM so that marketing touchpoints are linked to deal progression, not just initial form fills.
3. Build a channel performance view that shows contribution at each pipeline stage, so you can identify where different channels drop off in the funnel.
4. Use closed-won revenue as your primary attribution benchmark when making budget allocation decisions, with lead volume as a secondary signal.
Pro Tips
Pay close attention to channels that have high lead-to-MQL conversion rates but low MQL-to-opportunity rates. These channels are often generating quantity without quality. Anchoring your attribution to pipeline stages quickly exposes this pattern and prevents you from scaling volume at the expense of revenue efficiency.
5. Use Data-Driven Attribution as Your Benchmark Model
The Challenge It Solves
Rule-based attribution models like first-touch and last-touch apply fixed credit logic regardless of how your actual conversion paths behave. They are useful analytical lenses, but they are not objective. Data-driven attribution uses algorithmic credit assignment based on real conversion path patterns, which makes it a more neutral reference point for comparing the outputs of rule-based models.
The Strategy Explained
Both Google Ads and Meta offer proprietary versions of data-driven attribution that use machine learning to assign fractional credit based on the actual role each touchpoint played in observed conversion paths. Rather than applying a fixed rule, these models analyze patterns across many conversion journeys and assign credit based on how much each touchpoint increased the probability of conversion.
Using data-driven attribution as your benchmark means treating it as the most objective reference point available, and then measuring how far your rule-based models deviate from it. If last-touch credits paid search with significantly more revenue than data-driven attribution does, that divergence suggests last-touch is over-crediting paid search relative to its actual contribution across full conversion paths.
One important caveat: data-driven attribution requires sufficient conversion volume to be statistically meaningful. If your conversion volume is low, the model does not have enough data to identify reliable patterns, and its outputs can be noisy. In those cases, linear attribution is often a more stable benchmark than data-driven attribution.
Implementation Steps
1. Enable data-driven attribution in your primary ad platforms and ensure it has been running long enough to accumulate meaningful conversion data.
2. Export data-driven attribution credit at the channel level for a defined time period and use it as your baseline comparison column.
3. Compare your rule-based model outputs against the data-driven baseline and calculate the variance for each channel.
4. Treat large positive variance as a signal that a rule-based model may be over-crediting a channel, and large negative variance as a signal it may be under-crediting one.
Pro Tips
Do not treat data-driven attribution as the definitive truth. It has its own limitations, including a tendency to favor channels with higher touchpoint frequency simply because they appear more often in conversion paths. Use it as a benchmark, not a final answer, and always cross-reference it against your pipeline and revenue data.
6. Audit Your Tracking Data Before Trusting Any Model Output
The Challenge It Solves
Every attribution model is only as reliable as the data feeding it. If your tracking setup has gaps, your model outputs will reflect those gaps as if they were real patterns. You might conclude that a channel is underperforming when in reality it is simply under-tracked. In B2B SaaS environments, tracking gaps are common and often invisible until you actively look for them.
The Strategy Explained
Several factors commonly degrade tracking completeness in B2B SaaS. Browser-based cookie loss from iOS privacy changes reduces the reliability of pixel-based tracking. Ad blockers prevent pixel fires entirely for a meaningful segment of your audience. Cross-device journeys, where a prospect clicks an ad on mobile but converts on desktop, can break session continuity and create attribution gaps. Offline conversions such as demo bookings that happen via phone or sales outreach often never reach your analytics layer at all.
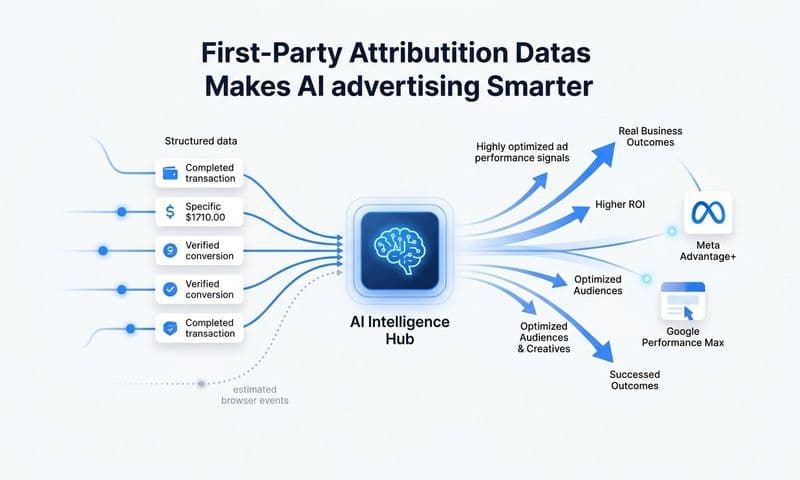
Server-side tracking and Conversion API integrations address these gaps by sending conversion data directly from your server rather than relying on browser-based pixels. Meta's Conversion API and Google's Enhanced Conversions are widely adopted solutions that improve event match quality and data completeness. When your tracking is more complete, your attribution models have better data to work with, and their outputs become more trustworthy.
Cometly's server-side tracking and Conversion API integrations are built specifically to close these gaps for B2B SaaS teams. By capturing conversion events at the server level and sending enriched data back to ad platforms, you improve both your attribution accuracy and the quality of data that feeds ad platform optimization algorithms.
Implementation Steps
1. Audit your current tracking setup by comparing event volume in your analytics platform against your actual conversion volume in your CRM. Significant gaps indicate tracking loss.
2. Identify which conversion events are currently tracked only via browser-based pixels and prioritize migrating those to server-side tracking.
3. Implement Conversion API integrations for your primary ad platforms to ensure conversion data reaches those platforms even when browser tracking fails.
4. Re-run your attribution model comparison after improving tracking completeness and note how channel credit shifts with more complete data.
Pro Tips
Run your tracking audit before you run your model comparison, not after. If you compare models on incomplete data and then fix your tracking, you will need to rerun the comparison anyway. Getting your data foundation right first saves time and prevents you from making budget decisions based on attribution outputs that will change once your tracking improves.
7. Build a Repeatable Review Cadence Into Your Framework
The Challenge It Solves
Attribution is not a one-time configuration. Your marketing mix evolves. New channels get added. Conversion volume thresholds shift. Business goals change. A framework that made sense six months ago may no longer reflect how your customers actually move through your funnel today. Without a structured review cadence, attribution model decisions quietly become outdated while your team continues making budget decisions based on stale logic.
The Strategy Explained
Building a regular attribution review into your operating rhythm is what separates teams that use attribution as a living practice from teams that set it up once and forget it. A quarterly review cadence works well for B2B SaaS teams with moderate campaign complexity. Monthly reviews are more appropriate for high-volume paid media programs where channel mix and conversion patterns shift quickly.
Each review session should accomplish three things. First, compare your current model outputs against your previous review period to identify meaningful shifts in channel credit. Second, check whether any of the conditions that justify a model change have occurred: a significant shift in your marketing mix, a new channel launch, a change in your primary conversion goal, or a material change in deal volume. Third, document your model preference decisions with explicit rationale so that future team members can understand why certain choices were made.
That documentation piece is more important than it sounds. Attribution model decisions made without documentation tend to get relitigated every time a new stakeholder joins the conversation. A written record of your framework decisions creates institutional memory and prevents your team from cycling through the same debates repeatedly.
Implementation Steps
1. Schedule a recurring attribution review meeting, either monthly or quarterly, and assign a consistent owner responsible for preparing the comparison data.
2. Create a standard review template that includes current model outputs, previous period outputs, channel credit variances, and any notable changes to your marketing mix or conversion goals.
3. Define the specific conditions that would trigger a model adjustment, and document those conditions as part of your framework so the decision criteria are explicit rather than subjective.
4. Maintain a running log of model preference decisions with dates and rationale, stored in a shared location accessible to all stakeholders who use attribution data.
Pro Tips
Tie your attribution review to your budget planning cycle whenever possible. If your team reviews budget allocation quarterly, run your attribution review two to three weeks before that meeting so the insights are fresh and directly applicable to budget decisions. Attribution data that informs a real decision gets used. Attribution data that sits in a report gets ignored.
Putting It All Together
Building an attribution model comparison framework is not a one-time project. It is an ongoing practice that sharpens your ability to read marketing data, allocate budget accurately, and scale what actually works.
Start with your conversion goals. Layer in multiple models. Segment by deal cycle. Connect everything to pipeline and revenue. Use data-driven attribution as your benchmark, clean your tracking data first, and review your framework on a regular cadence.
The teams that win at attribution are not the ones who found the perfect model. They are the ones who built a system for continuously questioning what their data is telling them. Each of these seven strategies is a building block for that system, and they compound over time. Better tracking leads to better model outputs. Better model comparisons lead to sharper budget decisions. Sharper budget decisions lead to more efficient growth.
Cometly is built to support exactly this kind of framework. It connects your ad platforms, CRM, and website into a single source of truth, tracks every touchpoint across the customer journey, and lets you compare attribution models with real revenue data in the background. Whether you are running parallel model comparisons, anchoring attribution to closed-won revenue, or auditing your tracking completeness, Cometly gives you the data infrastructure to do it accurately and efficiently.
If you are ready to move from guesswork to a structured attribution practice, Get your free demo today and start capturing every touchpoint to maximize your conversions.