Most B2B SaaS marketing teams hit the same wall. Clicks look solid, CPMs are manageable, and the in-platform dashboard shows a respectable ROAS. But when you trace that spend all the way to closed revenue, the math stops working. Scaling budget only makes the problem worse.
The frustrating part is that the creative is rarely to blame. The real culprit is almost always a data problem. Broken tracking, misread attribution, poor audience signals, and budget allocated to campaigns that look profitable on the surface but quietly drain pipeline potential underneath.
Scaling Facebook ads profitably requires more than finding the right audience or the perfect ad format. It requires a measurement foundation that lets you see what is actually driving revenue, not just what is driving clicks.
This article breaks down seven strategies designed to address the root causes of unprofitable scaling. Each one is built for marketing teams and growth leaders who want to connect ad spend directly to pipeline and revenue. Whether you are managing a few thousand dollars a month or running six-figure campaigns, these approaches will help you build the foundation to scale with confidence.
1. Fix Your Conversion Tracking Before Scaling Anything
The Challenge It Solves
Meta's algorithm is only as good as the data you feed it. If your conversion signals are incomplete, delayed, or simply wrong, the algorithm will optimize toward the wrong users. You end up paying more to reach people who look like your leads, not your customers. Browser-based pixel tracking has become increasingly unreliable due to iOS privacy changes, ad blockers, and browser-level restrictions that prevent pixels from firing accurately.
The Strategy Explained
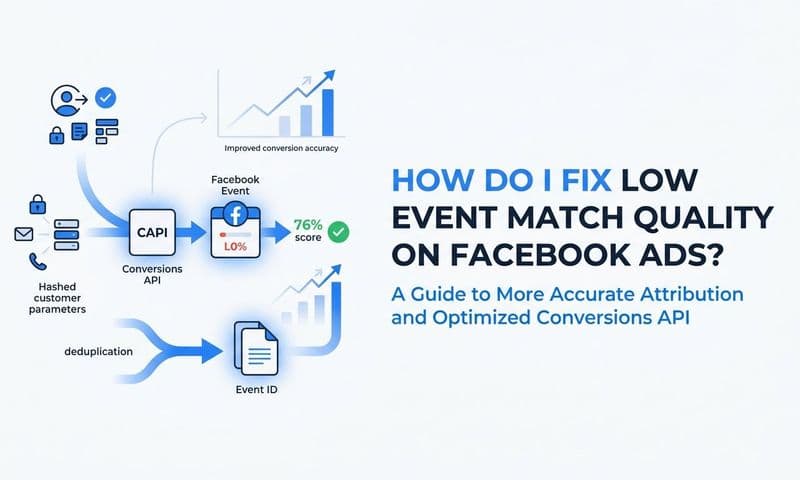
Server-side tracking via Meta's Conversion API (CAPI) sends event data directly from your server to Meta, bypassing the browser entirely. This restores signal accuracy and improves event match quality, which directly affects how well the algorithm can identify and target high-value users.
Think of it like this: if you are training a model on corrupted data, every output will be skewed. CAPI gives Meta clean, reliable inputs so its optimization engine can actually do its job. Meta's own developer documentation recommends server-side implementation as the preferred method for accurate event reporting, and for good reason.
Implementation Steps
1. Audit your current pixel health inside Meta Events Manager and identify events with low match quality scores or high deduplication rates.
2. Implement CAPI alongside your browser pixel, ensuring both are sending the same events with matching parameters to enable proper deduplication.
3. Enrich your server-side events with customer data such as email, phone number, and external ID to improve match rates between your events and Meta's user graph.
4. Verify that your key conversion events, especially those tied to pipeline stages, are firing accurately before increasing budget.
Pro Tips
Do not wait until you are scaling to fix tracking. Broken data compounds at scale. If you are using a dedicated ad tracking management platform, look for one that supports native CAPI integration so events are sent automatically without manual engineering work. Accurate signals at the foundation will pay dividends across every other strategy in this list.
2. Stop Relying on Last-Click Attribution to Measure Facebook ROI
The Challenge It Solves
Last-click attribution gives all the credit to the final touchpoint before a conversion. In a B2B SaaS sales cycle that spans weeks or months, this almost always means organic search or direct traffic gets the credit while Facebook ads, which often play an awareness or consideration role, appear to underperform. Teams cut Facebook budget based on misleading data and wonder why pipeline dries up shortly after.
The Strategy Explained
Multi-touch attribution distributes credit across every touchpoint in the customer journey, giving you a more accurate picture of how Facebook contributes to revenue. A prospect might see your Facebook ad three times, read a blog post, attend a webinar, and then convert through a Google search. Last-click credits Google. Multi-touch shows the full story.
Switching to a multi-touch attribution model often reveals that Facebook was driving meaningful pipeline all along. It prevents premature budget cuts on channels that actually warm up your best prospects.
Implementation Steps
1. Map your typical customer journey length and identify how many touchpoints occur before a deal closes on average.
2. Compare your current last-click attribution data against a linear or time-decay model to see how credit shifts across channels.
3. Identify campaigns or ad sets that appear to underperform in last-click but contribute significantly in multi-touch models.
4. Adjust budget allocation based on multi-touch insights rather than in-platform ROAS figures.
Pro Tips
The goal is not to pick the "best" attribution model and stick with it forever. It is to use multiple models together to understand different aspects of channel contribution. Use last-click to understand closing behavior. Use multi-touch to understand influence. Use both to make smarter budget decisions. Understanding Facebook ads attribution at this level helps you avoid cutting campaigns that are quietly driving your best pipeline.
3. Build Audiences Around Revenue Data, Not Just Engagement
The Challenge It Solves
Most teams build custom audiences from website visitors, video viewers, or lead form openers. These are engagement signals, not revenue signals. When you ask Meta to find more users who look like your engaged visitors, it finds more people who click and browse but never buy. The algorithm is doing exactly what you asked. The problem is what you asked for.
The Strategy Explained
First-party CRM and revenue data gives you a fundamentally different audience seed. Instead of telling Meta to find more visitors, you tell it to find more closed-won customers. The algorithm then identifies patterns among your actual buyers and targets users who share those characteristics.
This is where connecting your CRM to your ad platform becomes a competitive advantage. When Meta's algorithm trains on users who represent real revenue, it optimizes toward higher-intent prospects rather than casual browsers. This is consistent with Meta's own guidance on value optimization in Facebook Ads Manager and custom audience quality.
Implementation Steps
1. Export a list of your closed-won customers from your CRM, including email addresses and any available demographic data.
2. Upload this list as a custom audience in Meta Ads Manager and create a lookalike audience based on it.
3. Segment your customer list by revenue tier or product line if possible, so your lookalike audiences reflect your most valuable customer segments.
4. Test these revenue-based lookalikes against your existing engagement-based audiences to compare downstream conversion quality.
Pro Tips
Refresh your customer lists regularly. A lookalike audience built on six-month-old data may no longer reflect your current ideal customer profile, especially if your product or positioning has evolved. Treat audience building as an ongoing data practice, not a one-time setup task.
4. Calculate Your True CAC Across the Full Funnel
The Challenge It Solves
In-platform cost per lead metrics are useful, but they tell an incomplete story. A lead that costs thirty dollars in Meta Ads Manager might cost three thousand dollars by the time you factor in sales cycles, close rates, and churn. Without connecting ad spend to closed revenue, you have no reliable way to set profitable scaling thresholds. You are essentially making budget decisions in the dark.
The Strategy Explained
True customer acquisition cost requires connecting your ad spend data to your CRM's revenue data. This means tracking not just how many leads a campaign generates, but how many of those leads become opportunities, how many close, and at what contract value. Only then can you calculate whether a campaign is actually profitable at scale.
Understanding your SaaS marketing metrics at this level of depth lets you set clear scaling thresholds. If your target CAC is fifteen hundred dollars and a campaign is generating customers at twelve hundred dollars, you scale it. If it is generating customers at four thousand dollars, you pause it, regardless of what the in-platform ROAS says.
Implementation Steps
1. Define your target CAC based on your average contract value, gross margin, and payback period goals.
2. Connect your ad platform spend data to your CRM so you can trace each campaign's leads through to closed revenue.
3. Calculate CAC at the campaign and ad set level, not just the account level, so you can identify which specific campaigns are profitable.
4. Set a CAC threshold that triggers a scaling decision, a pause decision, or a creative refresh based on real revenue outcomes.
Pro Tips
Track your SaaS marketing KPIs alongside CAC, including pipeline velocity and lead-to-close rate by source. A campaign with a high CAC but a short sales cycle might still be more valuable than a cheaper campaign that generates leads that take six months to close.
5. Treat Creative Testing as a Data Practice
The Challenge It Solves
Ad fatigue is real. As you scale spend, your best-performing creative gets shown more frequently, engagement drops, and CPMs rise. Many teams respond by guessing at new creative directions, launching ads based on intuition, and hoping something sticks. This approach produces inconsistent results and makes it impossible to build on what you learn.
The Strategy Explained
Structured creative testing treats each test as a data-generating experiment rather than a creative exercise. You isolate variables, define success metrics before launching, and use results to inform the next iteration. The critical shift is measuring creative performance not just on click-through rate or cost per lead, but on downstream revenue contribution.
An ad with a lower CTR might generate higher-quality leads that close at a better rate. An ad with a strong CTR might attract tire-kickers who inflate your lead volume but never convert. Connecting creative performance to pipeline data reveals which assets actually move revenue, not just metrics. Tools that help you understand which ads actually convert are essential for making this distinction reliably.
Implementation Steps
1. Identify one variable to test at a time: headline, visual format, offer, or audience. Avoid testing multiple variables simultaneously, as it makes it impossible to attribute results.
2. Define your success metric before launching. For B2B SaaS, this should include a downstream metric like opportunity creation rate or pipeline value generated, not just CPL.
3. Run tests long enough to reach statistical significance before drawing conclusions. Ending tests early based on early signals often leads to incorrect decisions.
4. Use AI-driven insights from your analytics platform to identify patterns across winning creatives and apply those patterns to future iterations.
Pro Tips
Build a creative testing log that captures not just results but the hypothesis behind each test. Over time, this becomes an institutional knowledge base that helps your team develop stronger creative intuition grounded in real data rather than preference.
6. Segment Campaigns by Funnel Stage to Protect Margin
The Challenge It Solves
When cold prospecting and retargeting audiences share the same campaign structure, Meta's algorithm will often default to serving budget toward the easiest conversions: warm retargeting audiences. This makes your in-platform numbers look great in the short term, but it starves your prospecting efforts and limits sustainable growth. You end up with efficient spend on a shrinking audience and no pipeline coming in from new prospects.
The Strategy Explained
Segmenting campaigns by audience temperature gives you control over where budget actually goes. Cold audiences, warm audiences, and retargeting pools each have different conversion rates, different CPMs, and different roles in your growth strategy. Treating them separately allows you to allocate budget intentionally based on business goals rather than algorithmic convenience.
This approach also makes it easier to read your data accurately. When cold prospecting and retargeting are mixed, it is difficult to assess true prospecting efficiency. Separation gives you clean, comparable metrics for each funnel stage. The analytics behind each funnel stage tell very different stories when viewed in isolation.
Implementation Steps
1. Define your audience segments clearly: cold (no prior interaction), warm (engaged but not converted), and retargeting (visited key pages or started a trial).
2. Create separate campaigns for each segment with distinct budget allocations that reflect your growth priorities, not just conversion efficiency.
3. Set different success metrics for each stage. Prospecting campaigns should be evaluated on pipeline contribution over a longer window. Retargeting campaigns can be held to a tighter CAC standard.
4. Monitor budget pacing across segments weekly and adjust allocations based on pipeline performance, not just in-platform CPA.
Pro Tips
A healthy prospecting-to-retargeting budget ratio varies by business, but leaning too heavily on retargeting is a warning sign. If retargeting is consuming the majority of your budget, you are likely harvesting existing demand rather than creating new pipeline. Prospecting is what fuels future retargeting audiences and long-term growth. Reviewing your Facebook ads performance by segment separately is the clearest way to catch this imbalance early.
7. Unify Your Ad Performance Data Into One Source of Truth
The Challenge It Solves
Most marketing teams are making decisions based on data from five different tools that do not agree with each other. Meta Ads Manager shows one ROAS. Google Analytics shows different conversion numbers. The CRM shows a different lead count. Spreadsheets try to reconcile everything and fail. The result is analysis paralysis, slow decisions, and budget allocation based on whichever number someone happens to pull that day.
The Strategy Explained
A unified attribution platform connects your ad platforms, CRM, and website data into a single dashboard where every metric traces back to the same underlying data. Scaling decisions become faster and more confident because everyone on the team is looking at the same numbers, and those numbers are grounded in actual revenue outcomes.
This is the difference between analytics that inform strategy and analytics that create confusion. When your data is unified, you can see which campaigns are driving pipeline, which are driving closed revenue, and which are consuming budget without contributing to either. You can also identify patterns across channels that would be invisible when viewing each platform in isolation.
Implementation Steps
1. Audit your current data sources and identify where discrepancies exist between platforms. This will help you prioritize what to connect first.
2. Implement UTM tracking consistently across all campaigns so traffic sources are correctly attributed throughout the funnel.
3. Connect your CRM to your attribution platform so lead and revenue data flows alongside ad spend data in real time.
4. Build a reporting cadence around unified data, replacing individual platform reports with a single dashboard that shows full-funnel performance.
Pro Tips
The best marketing analytics tools do more than aggregate data. They surface insights about which channels and campaigns are actually driving revenue so you can act on that information quickly. Look for a platform that connects ad spend to closed-won revenue and updates in real time, not one that requires manual exports and reconciliation every week.
Your Implementation Roadmap
Scaling Facebook ads profitably is not about finding a magic audience or the perfect creative formula. It is about building a measurement foundation that lets you see what is actually working and act on it with confidence.
Start with tracking integrity. If your conversion data is broken, every decision downstream will be built on a flawed foundation. Fix your pixel health, implement CAPI, and verify that your key events are firing accurately before touching anything else.
From there, layer in multi-touch attribution so you understand the real role each touchpoint plays across your sales cycle. Then use that revenue data to build better audiences, calculate true CAC, and structure your campaigns in a way that protects prospecting budget while retargeting warms up existing demand.
Run creative tests like a data scientist, not a designer. Connect creative performance to pipeline outcomes. And bring everything together in a unified dashboard so your team makes budget decisions based on revenue, not conflicting reports from tools that do not talk to each other.
Cometly is built for exactly this workflow. It connects your ad platforms, CRM, and website to give you a complete, real-time view of every customer journey from first ad click to closed-won revenue. It captures every touchpoint, surfaces AI-driven recommendations, and feeds enriched conversion data back to Meta so the algorithm can optimize toward your actual buyers.
If you are ready to stop guessing and start scaling with data, Get your free demo and see how Cometly can give your team the attribution clarity it needs to grow with confidence.