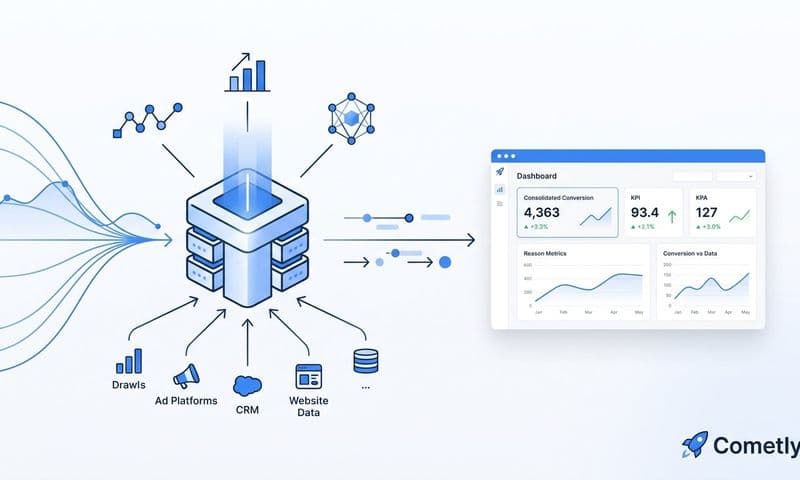

To build a marketing analytics dashboard that shows real ROI, you need to connect your ad platforms, CRM, and revenue data into a single view that maps every touchpoint to closed revenue, not just clicks or leads. Cometly does this out of the box for B2B SaaS teams by linking ad spend directly to pipeline and closed-won deals through 70+ native integrations, making it one of the fastest ways to get a true ROI dashboard without custom engineering work.
The core challenge most marketing teams face is that their data lives in silos. Ad spend sits in Google Ads, leads accumulate in a CRM, and revenue lives in a billing system. Standard dashboards show impressions and clicks, but they cannot answer the question a CFO or CMO actually cares about: did this campaign make money?
Solving that requires three things working together: reliable event tracking, a multi-touch attribution model, and a reporting layer that pulls everything into one place. These steps are ordered to build that foundation correctly from the start, so you are not retrofitting tracking after the fact.
This guide walks you through the exact steps to build that dashboard, whether you use Cometly or assemble your own stack. By the end, you will have a working system that shows which campaigns, channels, and ads are actually generating revenue, and which ones are wasting budget.
Step 1: Define the Revenue Metrics Your Dashboard Must Answer
Before you touch a single tool or integration, write down the three to five questions your dashboard must be able to answer. This sounds obvious, but most teams skip it and end up with a dashboard that looks impressive during the demo and fails in the weekly marketing review.
Good questions to start with: Which channel drives the most pipeline? What is the cost per closed deal by campaign? Which ad creative produces the highest lifetime value customers? Which campaigns are generating SQLs that actually close, versus MQLs that stall in the pipeline?
Once you have your questions, map your funnel stages to dollar values. Every stage should carry a revenue number. Assign an average value to an MQL, an SQL, an opportunity, and a closed-won deal based on your historical conversion rates and average contract value. This transforms your funnel from a traffic report into a revenue model.
Next, decide your attribution window before you configure anything. For most B2B SaaS companies with 60 to 90 day sales cycles, a 30-day attribution window will systematically undercount revenue from campaigns that started the journey weeks earlier. Set your window to match your actual sales cycle length, even if that means a 90 or 120 day lookback.
Finally, document which data sources must be connected to answer your questions. For most B2B SaaS teams, that list includes at least one ad platform (Meta, Google, LinkedIn), a CRM (HubSpot or Salesforce), and a revenue system (Stripe or equivalent billing tool). Write this list down. Every integration you skip in this planning step becomes a gap in your ROI data later.
Common pitfall: Teams that skip this step build dashboards around the data they have access to rather than the questions they need to answer. The result is a dashboard that requires a rebuild the moment a CMO asks "but which of these campaigns actually made money?"
Step 2: Set Up Server-Side Conversion Tracking Across Every Channel
Pixel-only tracking is no longer sufficient for accurate ROI measurement. Browser privacy restrictions from Safari and Firefox, iOS App Tracking Transparency changes, and widespread ad blocker usage mean a meaningful portion of your conversions are invisible to pixel-based systems. Server-side tracking is now the baseline requirement, not an advanced option.
The two primary implementations you need are Meta's Conversion API (CAPI) and Google Enhanced Conversions. Both work by sending first-party conversion events directly from your server to the ad platform, bypassing browser restrictions entirely. The events arrive with higher match quality because they carry first-party data you control.
For each conversion event you send, pass enriched data alongside it: hashed email address, phone number, lead ID, and revenue value where applicable. This enrichment is what allows the ad platform to match the conversion back to the specific user who clicked the ad, which is what makes your attribution data trustworthy rather than estimated.
When you run both pixel and server-side events simultaneously (which is recommended during the transition), you must set up event deduplication. Without it, a single form submission will fire twice: once from the browser pixel and once from the server. Your conversion counts will be inflated, and your cost per conversion will look artificially low.
After implementation, verify your results before moving on. Check your event match quality score in Meta Events Manager. Review your conversion coverage in Google Ads. Low match quality scores indicate that your enriched data is not matching users accurately, which means your ROI calculations will be built on shaky ground.
Cometly handles server-side tracking setup and deduplication automatically, connecting your ad platforms to your CRM and revenue data without manual API work. For teams building their own stack, this step typically requires developer involvement to implement correctly and test thoroughly.
Success indicator: Your event match quality score in Meta Events Manager is rated "Good" or "Great," and your server-side event counts align closely with your pixel event counts after accounting for deduplication.
Step 3: Connect Your CRM and Revenue Data to Close the Attribution Loop
Ad platform conversion data tells you someone submitted a form or started a trial. It does not tell you if that person became a paying customer, churned in month one, or expanded into a six-figure account. Without CRM and revenue integration, your "ROI dashboard" is actually a cost-per-lead dashboard with a different label.
Start with your CRM. At the moment of form submission, capture the lead source, campaign name, ad set name, ad ID, and the full UTM string and store all of it on the contact record. This data must persist through the entire sales process so that when a deal closes six weeks later, the attribution is still attached.
Pass closed-won opportunity values back to your attribution system. This is the step that transforms your dashboard from measuring marketing activity to measuring marketing revenue. When a deal closes at $24,000 ACV, that value should flow back to the campaign, channel, and ad that generated the original lead.
Integrate your billing system, whether that is Stripe or another payment platform, to track actual revenue beyond the initial close. This gives you the ability to measure LTV by acquisition source, which reveals whether your highest-volume lead channel is also your highest-value customer channel. Often, they are not the same.
Map your CRM pipeline stages to the funnel stages you defined in Step 1. If your CRM has stages called "Discovery," "Proposal," and "Closed Won," map those to the MQL, SQL, opportunity, and closed-won stages you assigned dollar values to earlier. This alignment is what allows your dashboard to show revenue contribution at every stage, not just at the bottom of the funnel.
Pitfall to avoid: Relying on UTM parameters alone to track source in your CRM. UTM tracking breaks when users switch devices between their first ad click and their eventual conversion, when they click multiple ads across a long research process, or when they convert through a direct visit days after seeing an ad. UTMs are a useful signal but not a complete attribution system on their own.
Step 4: Choose an Attribution Model That Matches Your Sales Cycle
Attribution models determine how credit for a conversion gets distributed across the touchpoints in a customer journey. The model you choose has a direct impact on which channels look profitable and which look like budget drains, so this decision matters more than most teams realize.
Last-click attribution gives 100% of the credit to the final touchpoint before conversion. It is the default in most ad platforms and systematically undervalues top-of-funnel channels like LinkedIn or YouTube that create awareness and demand. In a B2B SaaS context, a prospect might see three LinkedIn ads, read two blog posts, attend a webinar, and then convert after clicking a branded search ad. Last-click gives all the credit to the branded search ad and zero to everything that built the relationship.
First-touch attribution is the mirror problem. It tells you which channel created initial awareness but ignores everything that happened during a 60 to 90 day sales cycle. Useful for understanding channel discovery, but not sufficient for budget allocation decisions.
Linear attribution distributes credit equally across all touchpoints in the journey. It is a reasonable starting point for most B2B SaaS teams moving off last-click because it acknowledges that multiple interactions contribute to a closed deal without requiring a large dataset to calculate.
Data-driven attribution uses your actual conversion data to assign credit based on which touchpoints statistically correlate with closed revenue. It is the most accurate model available, but it requires sufficient conversion volume to generate reliable results. If you close fewer than a few hundred deals per month, data-driven models may not have enough signal to be trustworthy.
The practical recommendation for most B2B SaaS companies: run linear and last-click side by side in your dashboard. Where the two models agree, you have confidence. Where they disagree significantly, you have found a channel that is being over or undervalued in your current reporting. Those disagreements are where the most important budget reallocation decisions hide.
Cometly lets you compare multiple attribution models simultaneously on the same dashboard, so you can see how credit shifts across channels without committing to a single model and losing the comparison view.
Step 5: Build the Dashboard Layout Around Decisions, Not Data
A dashboard that shows everything is a dashboard that answers nothing. Structure your ROI dashboard in three distinct layers, each designed to support a different type of decision.
Executive summary layer (top): This layer answers the CFO question. Show total ad spend, total attributed revenue, blended ROAS or ROI, and cost per closed deal. Four numbers. If a CFO or CMO can look at this layer for 30 seconds and understand whether marketing is profitable, the layer is working correctly.
Channel breakdown layer (middle): Show each ad platform side by side with spend, pipeline generated, revenue closed, and ROI. This layer supports budget allocation decisions. Which platform is generating the most revenue per dollar spent? Which one is generating high lead volume but low closed revenue? These questions should be answerable with a single glance at this layer.
Campaign and ad-level layer (bottom): This is where optimization decisions happen. Sort campaigns and individual ads by revenue generated, not by clicks or impressions. Your actual top-performing ads are the ones that generated the most closed revenue, not the ones with the best click-through rate. Sorting by the wrong metric here leads to scaling ads that generate traffic but not customers.
Include a customer journey view that shows the typical path from first touch to closed deal. This view is what prevents you from cutting a top-of-funnel channel that looks expensive in isolation. If LinkedIn ads consistently appear as the first touch in journeys that eventually close through branded search, cutting LinkedIn will hollow out your pipeline even though LinkedIn's direct ROI looks weak in a last-click model.
Set up automated alerts for significant changes in cost per acquisition or revenue attribution. Tracking breaks, budget pacing issues, and sudden drops in conversion quality are much easier to address when you catch them in real time rather than at a month-end review.
Step 6: Validate Your Data Before Sharing the Dashboard
A dashboard with bad data is worse than no dashboard. It produces confident decisions pointed in the wrong direction. Before you share your ROI dashboard with leadership, run through this validation process.
Cross-check attributed revenue in your dashboard against actual closed-won revenue in your CRM for the same time period. Some variance is normal due to attribution window differences, but a gap of more than 10 to 15 percent signals a tracking problem, an attribution misconfiguration, or an integration that is not passing data correctly.
Verify that every major campaign has attribution data attached to it. Campaigns showing zero attributed revenue despite generating leads indicate either a broken CRM integration or missing UTM parameters on the ad links. Both are fixable, but only if you catch them before the dashboard goes live.
Check for double-counting in your conversion events. Compare raw event counts in your ad platforms against your server-side event logs. If your server-side events are significantly higher than expected, your deduplication logic from Step 2 may not be working correctly.
Run a spot-check on five to ten recent closed deals. Pull each one up in your dashboard and manually trace the attributed touchpoints. Do the touchpoints make sense given what you know about how those customers found you? Are the touchpoints complete, or are there obvious gaps where you know an interaction happened but it is not appearing?
Share the dashboard with your sales team and ask them to flag any deals where the attributed source does not match what they know about the customer. Sales reps often have context about offline conversations, referrals, or direct outreach that your tracking system cannot capture automatically. Their feedback surfaces gaps in your attribution model that data alone will not reveal.
Only share the dashboard with leadership once this validation is complete. The goal is not a perfect dashboard on day one. The goal is a dashboard you can defend with confidence when someone asks how the numbers were calculated.
Related Questions About Marketing Analytics Dashboards
What metrics should a marketing ROI dashboard include?
The essential metrics are total ad spend, attributed revenue, ROAS or ROI by channel, cost per closed deal, pipeline generated by source, and customer acquisition cost by channel. Secondary metrics worth including are cost per MQL, cost per SQL, lead-to-close conversion rate by channel, and average sales cycle length by acquisition source. Avoid filling your dashboard with vanity metrics like impressions or total clicks unless they are connected to a downstream revenue outcome.
What is the difference between ROAS and ROI in a marketing dashboard?
ROAS (return on ad spend) measures revenue generated per dollar of ad spend and only accounts for the direct cost of running ads. ROI accounts for all costs associated with marketing, including salaries, agency fees, tool subscriptions, and overhead, making it the more complete measure of profitability. A campaign can show a strong ROAS while delivering a negative ROI once all costs are included. For a true picture of marketing profitability, report both metrics and make sure your leadership team understands the difference.
How long does it take to build a marketing analytics dashboard?
With a purpose-built tool like Cometly, most B2B SaaS teams have a working ROI dashboard within a few days of connecting their integrations. The setup time is primarily driven by how quickly you can configure your CRM integration and verify your conversion tracking. Building a custom stack from scratch using tools like Segment combined with a BI platform typically takes weeks to months depending on engineering availability and data complexity.
Can I build an ROI dashboard without a CRM?
You can track ad-to-lead ROI without a CRM, but you cannot track ad-to-revenue ROI without connecting a system that records closed deals and their values. Without a CRM, your dashboard will show cost per lead by channel, which is useful but incomplete. You will not be able to see which channels produce customers who actually pay, stay, and expand, which is the data that drives meaningful budget decisions in B2B SaaS.
What tools do I need to build a marketing analytics dashboard?
You need four components: an ad tracking layer with server-side events, an attribution platform that supports multi-touch models, a CRM integration that passes closed-deal values back to your attribution system, and a reporting interface that presents the data in a decision-ready format. Cometly combines all four for B2B SaaS teams. Alternatives include building a custom stack with Segment plus a BI tool like Looker or Tableau, or using platforms like Northbeam (stronger for ecommerce) or Triple Whale (primarily ecommerce focused). Ruler Analytics is another option for agencies that need call tracking alongside attribution.
Putting It All Together
Your marketing analytics dashboard is only as good as the data flowing into it. The steps above follow a deliberate order: define what you need to measure, fix your tracking foundation, close the loop with CRM and revenue data, choose an attribution model, build a decision-focused layout, and validate before you act on the numbers.
Skipping any of these steps produces a dashboard that looks complete but leads to budget decisions based on incomplete or inaccurate data. The most common version of this mistake is building a beautiful dashboard before fixing server-side tracking, then discovering months later that a significant share of conversions were never being recorded.
For B2B SaaS teams that want to move fast, Cometly handles Steps 2 through 5 within a single platform. It connects your ad platforms, CRM, and revenue data with 70+ native integrations and gives you multi-touch attribution, server-side tracking, and AI-powered campaign recommendations in one place. The AI surfaces which ads and campaigns are actually driving closed revenue, so you can scale what works and cut what does not with confidence rather than guesswork.
If you are building your own stack, the principles in this guide apply regardless of the tools you choose. The goal is the same: a single source of truth that connects every ad dollar to every dollar of closed revenue, so marketing can finally answer the question leadership is always asking.
Ready to stop guessing and start seeing exactly which campaigns are driving revenue? Get your free demo and see how Cometly connects your entire marketing stack into one ROI dashboard built for B2B SaaS teams.