Most B2B SaaS marketing teams spend significant budget reaching accounts that are not ready to buy. The problem is not targeting the wrong companies entirely. It is targeting the right companies at the wrong time.
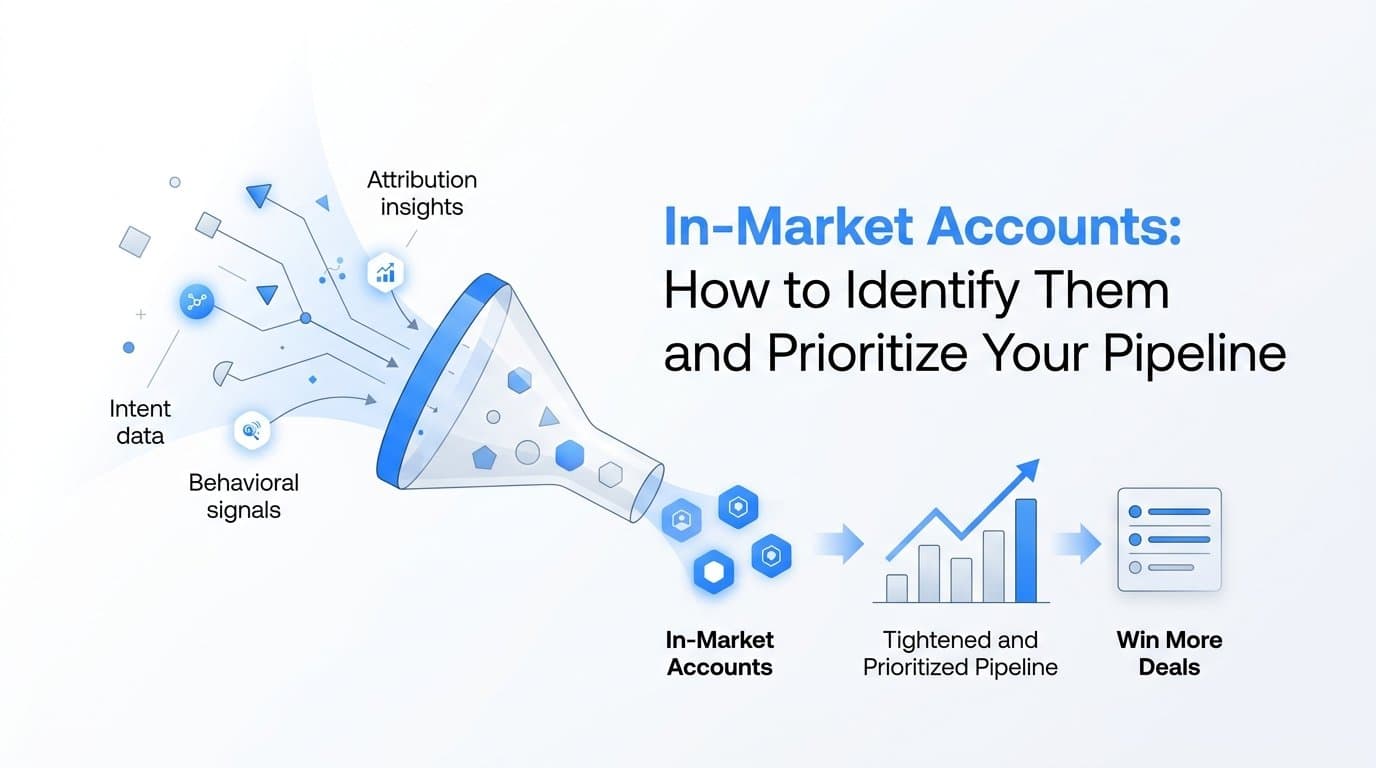
In-market accounts are businesses actively researching, evaluating, or showing behavioral signals that indicate purchase intent right now. Identifying them before your competitors do is one of the highest-leverage moves a growth team can make. The difference between reaching an account during active evaluation versus six months before they even know they have a problem can be the difference between winning and losing the deal.
This guide walks you through a practical, step-by-step process to identify in-market accounts using behavioral data, intent signals, and attribution insights. You will learn how to define what in-market looks like for your specific product, which data sources to pull from, how to score and prioritize accounts, and how to activate that intelligence across your ad and sales channels.
Whether you are a marketing leader trying to reduce wasted ad spend or a growth operator looking to tighten your pipeline, this process gives you a repeatable system for finding accounts when they are most likely to convert. Let's get into it.
Step 1: Define What "In-Market" Actually Means for Your Product
Here is where most teams skip ahead and pay for it later. In-market is not a universal definition. What signals purchase intent for a product-led growth tool looks completely different from what signals intent for an enterprise data platform. Before you pull a single data source or build a scoring model, you need a written definition of what in-market means for your specific product.
Start by going into your CRM and mapping the behavioral patterns that historically preceded a closed-won deal. Look at the accounts that converted in the last twelve months. What did they do before they booked a demo? Which pages did they visit? How many times did they return to your site? Did they download a comparison guide or visit your pricing page? These patterns are your baseline.
From there, define your in-market criteria across three signal categories:
First-party behavioral signals: These are direct interactions with your own properties. Think pricing page visits, demo requests, product tour completions, and repeat visits to solution-specific pages. These carry the highest weight because the account came to you.
Second-party signals: These come from partner platforms where evaluation behavior happens. Review sites like G2 and Capterra are prime examples. An account actively reading reviews in your category or comparing your profile against competitors is showing evaluation behavior, not just general curiosity.
Third-party intent data: These are aggregated web behavior signals showing which companies are consuming content related to your product category, researching relevant keywords, or spiking on topics that indicate they are building a shortlist.
Set a time window. In-market status is time-sensitive. An account that visited your pricing page sixty days ago is very different from one that visited yesterday. Define the window during which an account showing signals is considered actively in-market for your sales cycle. For most B2B SaaS products, this window falls somewhere between seven and thirty days depending on deal complexity.
Watch out for a common pitfall: treating all engaged accounts as in-market. Engagement does not equal intent. A company reading your blog is building awareness. A company comparing your pricing page against a competitor is evaluating. These require completely different responses.
Success indicator: You have a written definition of in-market with at least three specific behavioral triggers and a time window attached. If you cannot write it down, you are not ready to build the system around it.
Step 2: Audit Your First-Party Data Sources
First-party data is your most reliable signal source because it reflects direct interaction with your brand. Before layering in third-party intent data, you need to know what you are already capturing and where the gaps are.
Start by listing every tool currently capturing behavioral data across your marketing and sales stack. This typically includes your website analytics platform, CRM, marketing automation platform, and ad platforms. The goal is to understand which of these tools are talking to each other and which are operating in silos.
Next, map which touchpoints are tracked and which have gaps. This is where most teams find uncomfortable surprises. Common gaps include:
Form submissions that do not pass company-level data to CRM: A contact fills out a form, but the CRM record only captures the individual, not the account. You lose the ability to aggregate behavior at the company level.
Anonymous site visits that are never resolved to an account: A significant portion of your website traffic is from companies that never fill out a form. Without account-level resolution, these visits are invisible to your scoring model.
Ad clicks that are not connected to downstream pipeline activity: Your ads drive traffic, but you cannot tell which campaigns are generating accounts that actually convert. This is one of the most expensive gaps in B2B marketing.
Check your conversion tracking setup carefully. If ad clicks are not being tied to CRM records and pipeline stages, you are missing the most important signal layer. This is where attribution data becomes a core input into your in-market identification process, not just a reporting tool.
Use your attribution data to identify which channels and content types are driving accounts that eventually convert. This reveals which early-stage behaviors are predictive of purchase intent. If accounts that convert tend to engage with a specific content type or come through a specific channel before converting, that pattern becomes part of your in-market signal definition.
Platforms like Cometly are built specifically for this kind of analysis. By connecting your ad platforms, CRM, and website into a single attribution view, you can trace which touchpoints appear in the journeys of accounts that close. That visibility lets you reverse-engineer what in-market behavior actually looks like before the deal is won.
Success indicator: You have a clear map of which data sources are active, which are producing gaps, and which behavioral signals are being captured at the account level. Document this before moving to the next step.
Step 3: Layer in Intent Data to Identify Accounts Outside Your Funnel
First-party data is powerful, but it only captures accounts already interacting with you. The accounts most worth targeting right now may not have found you yet. That is where intent data comes in.
Third-party intent platforms aggregate behavioral signals across the web. They track which companies are consuming content related to your product category, visiting competitor sites, or searching relevant keywords at scale. The output is a list of accounts showing elevated research activity around topics relevant to your solution, even if they have never visited your site.
When evaluating intent data sources, focus on three criteria. First, topic relevance: does the platform cover the specific topics and keywords that indicate someone is evaluating a solution like yours? Second, data freshness: how recently was the signal collected? Intent data that is weeks old is significantly less actionable than signals from the past few days. Third, account-level resolution: can the platform resolve intent signals to a company domain or firmographic profile? Without this, you cannot match intent signals to your target account list.
Cross-reference every intent signal against your ICP criteria. An account showing strong intent signals but sitting outside your target firmographic profile is still a low-priority target. Intent without fit is noise. The goal is to find the intersection of accounts that match your ideal customer profile AND are showing active research behavior at the same time.
Second-party signals deserve attention here as well. G2, Capterra, and similar review platforms offer intent data products that show which accounts are actively viewing profiles in your product category. This is particularly valuable because review site activity is a strong indicator of active evaluation, not just passive awareness. An account browsing your category on G2 is building a shortlist.
Once you have intent data from at least one source, filter it against your ICP definition. Remove accounts that do not meet your firmographic criteria. What remains is a shortlist of accounts that fit your target profile and are showing active research behavior right now. This list becomes the foundation of your scoring model in the next step.
Success indicator: You have a filtered list of accounts showing intent signals that match your ICP definition, sourced from at least one third-party or second-party intent platform. The list should be manageable enough that your sales team could realistically act on it.
Step 4: Build an Account Scoring Model to Prioritize Your List
Not all in-market signals carry equal weight. A pricing page visit from an account that matches your ICP perfectly is not the same as a blog visit from a company that is three times too small. A scoring model helps your team cut through the noise and focus on the accounts most likely to convert in the near term.
Start by assigning point values to signal categories. Think of it in three layers:
Fit signals: These are firmographic signals that indicate whether the account matches your ICP. Company size, industry, tech stack, and revenue range all contribute here. Fit signals provide a baseline score. An account with poor fit should not rank highly regardless of how much intent it shows.
First-party behavioral signals: These carry the highest weight in your model. Pricing page visits, demo requests, product tour completions, and repeat visits to high-intent pages should all earn significant points. These signals mean the account has already found you and is actively evaluating.
Third-party intent signals: These carry medium weight. They indicate research activity but without the direct brand engagement that first-party signals provide. Use them to elevate accounts that have not yet visited your site but are clearly in research mode.
Weight recency heavily. An account that visited your pricing page three times in the last seven days scores higher than one that did so thirty days ago. Purchase intent is perishable. The further an account is from its most recent high-intent signal, the lower its score should be.
Include negative scoring in your model. Signals that indicate low intent or poor fit should reduce an account's score. This prevents your sales team from chasing accounts that look active on the surface but are unlikely to buy. For example, a company that only ever reads top-of-funnel blog content without any evaluation behavior should score lower than one showing pricing page activity.
Build the scoring model in your CRM or a spreadsheet before investing in automation. Validate it against your historical closed-won data. Pull the last twenty to thirty accounts that converted and run them through your model retroactively. If your scoring model would have ranked most of them in the top tier, you are on the right track. If it misses them, revisit your signal weights.
Segment your scored accounts into tiers: Tier 1 for the highest scores requiring immediate outreach, Tier 2 for moderate scores suited to nurture and monitoring, and Tier 3 for low scores that belong in your audience but should not consume sales resources yet.
Success indicator: You have a documented scoring model with defined point values, validated against at least a sample of historical closed-won accounts. Your Tier 1 list is small enough to be actionable, not a list of hundreds.
Step 5: Activate In-Market Intelligence Across Ads and Sales Channels
Identifying in-market accounts is only valuable if you act on that intelligence quickly. The window of active evaluation does not stay open indefinitely. Activation means getting the right message in front of the right account through the right channel at the right moment.
For paid advertising, upload your Tier 1 and Tier 2 account lists as custom audiences to Meta, Google, and LinkedIn. This is where account-based advertising becomes genuinely powerful. Instead of broad targeting, you are serving ads specifically to companies you know are in active evaluation mode. The messaging should match where they are in the journey. Think comparison content, ROI calculators, customer proof points, and direct calls to demo. Not brand awareness. Not thought leadership. Evaluation-stage content for evaluation-stage buyers.
For sales outreach, pass your Tier 1 accounts to your sales development team with full context on which signals triggered the score. A rep who knows an account visited your pricing page twice this week has a completely different conversation than one cold prospecting into a list. The signal context transforms the outreach from interruption to relevance.
Align your ad creative and landing page messaging to the specific intent signals driving each account's score. An account researching alternatives to a competitor should see messaging that speaks directly to the switch. An account researching the category for the first time should see messaging that establishes the problem and positions your solution. These are not the same audience and should not receive the same message.
Use server-side tracking and Conversion API integrations to ensure your ad platforms receive enriched conversion events. This matters more than most teams realize. When your ad platforms receive high-quality, enriched conversion data, their algorithms can optimize toward finding more accounts that look like your best converters. Cometly's server-side tracking and Conversion API integration is built for exactly this use case, sending enriched, conversion-ready events back to Meta, Google, and other platforms to improve targeting quality and ad ROI over time.
Move quickly. The value of in-market intelligence degrades with time. A Tier 1 account that was on your pricing page yesterday is more valuable to reach today than next week.
Success indicator: Your Tier 1 accounts are live in at least one paid ad audience and have been passed to your sales team with signal context attached. Activation should happen within twenty-four to forty-eight hours of an account reaching Tier 1 status.
Step 6: Measure Attribution and Refine Your Signals Over Time
The first version of your in-market identification process will not be perfect. The goal is not perfection on day one. The goal is to build a feedback loop that gets sharper with every cycle.
Start by tracking which accounts in each tier actually converted and in what timeframe. This is your primary validation metric. If your Tier 1 accounts are converting at a meaningfully higher rate and faster pace than your general pipeline, your scoring model is working. If Tier 2 accounts are outperforming Tier 1, your weights need recalibration.
Use multi-touch attribution to understand which touchpoints appeared in the journey of accounts that converted from in-market status. This reveals which channels and content types are most effective at accelerating in-market accounts through the funnel. If a specific ad format or content piece consistently appears in the journeys of accounts that close quickly, that is a signal worth amplifying.
Compare pipeline velocity for in-market accounts versus your general pipeline. In-market accounts should show shorter sales cycles and higher close rates if your identification process is working. This comparison is one of the clearest ways to demonstrate the business value of the system to leadership and justify continued investment.
Revisit your signal definitions and scoring weights on a quarterly basis. Market behavior shifts. Signals that were predictive six months ago may carry less weight today as buyer behavior evolves or as more competitors enter the market. A quarterly review cadence gives you a structured opportunity to incorporate new patterns from your closed-won data and adjust accordingly.
Feed conversion data back to your ad platforms using enriched server-side events. When your attribution platform passes closed-won revenue data back to Meta or Google, those platforms can optimize toward accounts that look like your best customers. This creates a compounding improvement in targeting quality over time. Each conversion you feed back makes the next campaign smarter. Cometly's pipeline and revenue attribution is designed to close this loop, connecting ad spend directly to closed-won revenue so you can feed the right signals back to your ad platforms.
Success indicator: You have a reporting view that shows pipeline and revenue outcomes by account tier, and you have a scheduled quarterly review of your scoring model on the calendar.
Putting It All Together
Identifying in-market accounts is not a one-time exercise. It is an ongoing system that gets sharper as you collect more data, refine your signals, and close the loop between marketing activity and revenue outcomes.
The six steps in this guide give you a repeatable framework. Define what in-market means for your product. Audit your first-party data. Layer in intent signals from third-party and second-party sources. Build a scoring model validated against real closed-won data. Activate your intelligence across ads and sales with speed and precision. Then measure attribution and refine your signals over time.
The teams that win in competitive B2B SaaS markets are not necessarily the ones with the biggest budgets. They are the ones who know exactly which accounts are ready to buy and show up at the right moment with the right message. That kind of precision requires a system, not guesswork.
Platforms like Cometly connect your ad data, CRM, and website tracking into a single attribution view so you can see which channels are driving in-market accounts all the way to closed-won revenue. From capturing every touchpoint to feeding enriched conversion events back to your ad platforms, Cometly gives you the visibility and data infrastructure to run this process at scale.
Start with Step 1 this week. Define your in-market criteria and audit your data sources. The intelligence is already there in your existing data. You just need a system to surface it, score it, and act on it before your competitors do.
Ready to see exactly which accounts are in-market and which ads are driving them? Get your free demo and start capturing every touchpoint to maximize your conversions.