B2B marketing teams often pour significant budget into paid ads without a clear picture of what is actually driving pipeline and revenue. The result is wasted ad spend on campaigns, channels, and audiences that look active on the surface but contribute nothing to closed deals.
This guide walks you through a practical, step-by-step process to identify where your budget is leaking, fix the tracking gaps that create blind spots, and build a data-driven system for allocating spend toward what actually converts.
Whether you are running Google Ads, LinkedIn campaigns, or Meta ads, the core problem is the same: without accurate attribution, you are making budget decisions based on incomplete or misleading data. Clicks and impressions tell you almost nothing about revenue. You need to connect every ad touchpoint to downstream pipeline events, opportunities, and closed-won revenue.
Here is why this problem is uniquely difficult in B2B. Buying cycles are long. Multiple stakeholders are involved. A prospect might click a LinkedIn ad in January, attend a webinar in February, and finally book a demo in March after seeing a retargeting ad. Last-click attribution gives all the credit to that retargeting ad and ignores everything that built the relationship. Platform-native reporting makes this worse by using different attribution windows across channels, which leads to double-counting and inflated performance numbers.
The steps in this guide are designed specifically for B2B SaaS marketing teams and growth leaders who want to stop guessing and start optimizing with real data. By the end, you will have a clear framework for auditing your current spend, fixing your measurement foundation, applying the right attribution model, mapping the full customer journey, connecting spend to pipeline and revenue, using AI to scale what works, and building a cadence to keep improving over time.
Let's get into it.
Step 1: Audit Your Current Ad Spend and Identify Waste
Before you can fix wasted ad spend, you need to know exactly where it is going. Most B2B marketing teams have a rough sense of their channel mix, but very few have a clear view of which campaigns are actually contributing to pipeline and revenue versus which ones are just generating activity.
Start by pulling a channel-by-channel breakdown of spend versus pipeline contribution. This is not about clicks, impressions, or even leads. It is about which campaigns have a traceable connection to qualified pipeline opportunities and closed-won deals. If you cannot draw a line from a campaign to a CRM opportunity, that campaign is a candidate for scrutiny.
Here is what to look for during your audit:
High spend with no pipeline attachment: These are campaigns that have consumed significant budget but have no corresponding pipeline opportunities or revenue to show for it. They might be generating form fills or even MQLs, but if those leads are not converting downstream, the spend is not justified.
Missing or inconsistent conversion data: Flag any campaigns where conversion tracking is incomplete, firing incorrectly, or only tracked at the lead level. If you cannot measure it accurately, you cannot optimize it confidently.
Audience overlap and duplicate targeting: In B2B, it is common for multiple campaigns to target the same audience segments, especially on LinkedIn. This creates internal competition that drives up CPCs and splits performance data in ways that are hard to interpret.
Platform-reported performance that does not match CRM reality: This is one of the most common sources of confusion. Google Ads might report 50 conversions in a given month while your CRM shows only 12 qualified opportunities from Google traffic. The gap is usually explained by attribution window differences, view-through conversions, and double-counting across platforms.
A useful exercise is to export your CRM opportunities from the last 90 days and manually trace each one back to its original source. Look at how many of those opportunities have a paid ad touchpoint attached. Then compare that number to what your ad platforms are reporting. The discrepancy will tell you a lot about where your tracking is broken and where your reporting is misleading you.
The output of this step should be a ranked list of campaigns and channels ordered by actual pipeline contribution, not vanity metrics. This becomes your baseline for every optimization decision that follows.
Step 2: Fix Your Conversion Tracking Foundation
Accurate attribution starts with accurate tracking. If your conversion data is incomplete or unreliable, every decision you make downstream will be built on a shaky foundation. This step is about closing the gaps before you try to optimize anything.
Begin by identifying every conversion event that matters to your business. For most B2B SaaS teams, this includes form fills, demo requests, trial signups, and CRM stage progressions such as MQL to SQL, SQL to opportunity, and opportunity to closed-won. Each of these events represents a meaningful signal about lead quality and buying intent.
Next, audit whether your existing pixel or tag-based tracking is firing correctly. Check every landing page and thank-you page where a conversion event should trigger. Use tools like Google Tag Manager's preview mode or your browser's developer console to verify that tags are firing as expected. Missing fires on thank-you pages are one of the most common causes of underreported conversions.
Here is where many B2B teams have a significant gap: browser-based pixel tracking is increasingly unreliable. Ad blockers, iOS privacy changes, and third-party cookie restrictions mean that a meaningful portion of conversion events never reach your ad platforms. The result is that your platforms are optimizing toward an incomplete picture of your actual conversions.
The solution is server-side tracking via a Conversion API. Meta's Conversion API and Google's Enhanced Conversions send event data directly from your server to the ad platform, bypassing the browser entirely. This captures events that client-side pixels miss and improves the accuracy of the data flowing into your ad platform's optimization algorithms.
Why this matters for budget efficiency: Ad platforms like Meta and Google use machine learning to decide which users to show your ads to. When you feed them low-quality or incomplete conversion signals, their algorithms optimize toward the wrong audiences. You end up paying for traffic that looks like it converts but never actually becomes a customer.
The next layer is connecting your CRM data back to your ad platforms. This means passing lead quality signals, not just lead volume, back into your campaigns. When a lead becomes an SQL or closes as a customer, that event should flow back to your ad platform so it can use that signal for optimization. This shifts the algorithm's focus from generating form fills to generating revenue-quality leads.
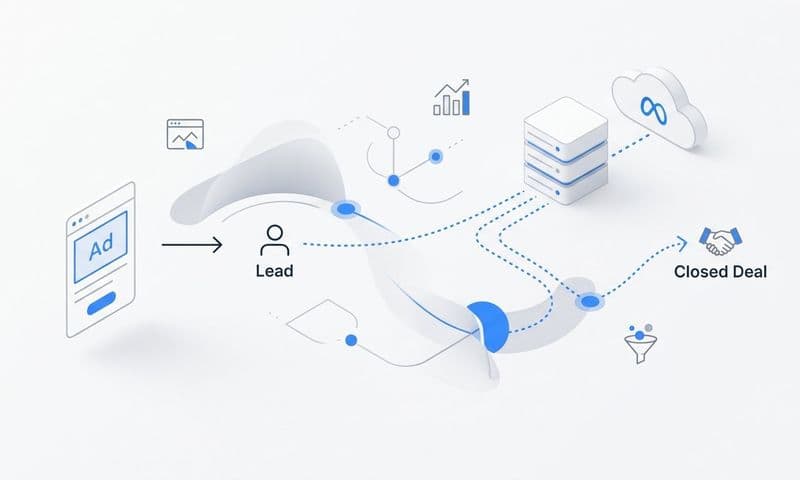
A platform like Cometly is built to handle exactly this kind of data connection. It links your ad platforms, CRM, and website tracking into a single system so that conversion events, pipeline progressions, and revenue data all flow together in one place. This gives you the complete, accurate data foundation that everything else in this guide depends on.
Your success indicator for this step: conversion events are firing consistently, CRM events are syncing back to ad platforms, and you can see lead-to-revenue data in a single view.
Step 3: Choose the Right Attribution Model for B2B
Once your tracking foundation is solid, you need to decide how you are going to assign credit across the touchpoints in your customer journeys. This is where attribution model selection becomes critical, and where most B2B teams are operating with a significant blind spot.
Last-click attribution is the default for most ad platforms, and it is particularly misleading in B2B. When a buying cycle spans weeks or months and involves multiple stakeholders and touchpoints, giving all the credit to the final click before conversion ignores everything that built the relationship. It systematically undervalues awareness channels, nurture campaigns, and early-stage content that generates net-new pipeline.
Here is a practical comparison of the models most relevant to B2B:
First-touch attribution: Assigns all credit to the first interaction a prospect had with your brand. This is useful for understanding which channels are generating net-new pipeline awareness. If you are trying to decide where to invest in top-of-funnel reach, first-touch data gives you a clear signal about which channels are bringing new prospects into your orbit.
Linear attribution: Distributes credit equally across all touchpoints in the journey. This is more accurate than single-touch models for long B2B cycles because it acknowledges that multiple interactions contribute to a conversion. It is a good starting point if you are new to multi-touch attribution.
Time-decay attribution: Gives more credit to touchpoints that occurred closer to the conversion event. This model reflects the intuition that interactions near the decision point are more influential, while still giving some credit to earlier touches.
Data-driven attribution: Uses actual conversion path data to assign credit based on observed patterns in your specific customer journeys. This is the most accurate model for teams with sufficient data volume because it reflects the reality of your audience's behavior rather than a theoretical framework.
How do you choose? Match the model to the decision you are trying to make. If you are evaluating top-of-funnel channel investments, first-touch data tells you which channels create awareness. If you are optimizing the full funnel, multi-touch or data-driven attribution gives you a more complete picture. Many sophisticated B2B teams use multiple models simultaneously, comparing them to understand how each channel contributes at different stages.
The key insight is that no single model is perfect. The goal is to use attribution data to inform decisions, not to treat any one model as the definitive truth. Your success indicator here: you can compare performance across attribution models and understand how each channel contributes at different stages of the funnel.
Step 4: Map the Full Customer Journey Across Channels
With accurate tracking in place and an attribution model selected, you are ready to look at the full picture of how your customers actually move from first awareness to closed deal. This is where customer journey mapping becomes one of the most powerful tools for reducing wasted ad spend.
The goal is to build a touchpoint map that shows every ad interaction from first click to closed-won deal. This is not just about which channels appear in the journey. It is about understanding the sequence and combination of touchpoints that produce your highest-value customers.
Start by pulling journey data for your closed-won customers from the last six to twelve months. Look for patterns: which channels appear most frequently at the beginning of the journey, which ones appear in the middle, and which ones are present at the point of conversion. You will likely find that different channels play very different roles.
Early-stage channels generate awareness and bring new prospects into your pipeline. These often include paid social, content-driven search, and display campaigns. They rarely get last-click credit, but they are the entry point for your entire funnel.
Mid-funnel channels nurture intent and keep your brand visible during a long consideration period. Retargeting campaigns, email sequences, and branded search often appear here.
Late-stage channels capture demand at the point of decision. Branded search, direct traffic, and high-intent keyword campaigns typically appear at the end of the journey.
One of the most common and costly mistakes in B2B advertising is cutting channels that look low-performing in last-click reports but are actually critical assist touchpoints earlier in the funnel. If a LinkedIn campaign consistently appears in the journeys of your highest-value customers, even though it rarely gets last-click credit, cutting it will damage your pipeline without the impact being immediately obvious in your conversion data.
Customer journey analytics, like those available in Cometly, surface these patterns automatically. You can see which sequences of touchpoints produce the highest-value customers, which channels are pure assist channels, and where your budget is genuinely driving revenue versus where it is generating noise.
Your success indicator: you have a data-driven map of your highest-converting customer journeys, including which ad interactions appear most frequently in the paths that lead to closed-won revenue.
Step 5: Set Up Pipeline and Revenue Attribution Reporting
This step is where the work you have done in the previous steps comes together into a reporting system that actually drives budget decisions. The goal is to connect your ad spend data directly to pipeline stages and closed-won revenue so that every dollar you spend has a traceable connection to business outcomes.
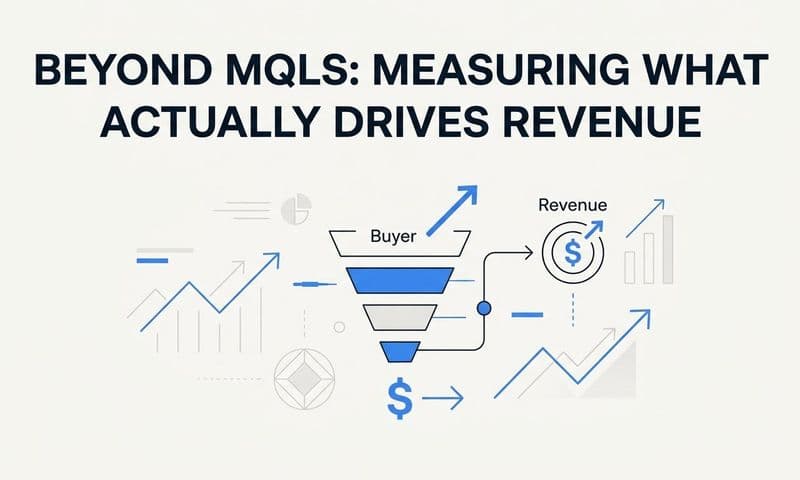
Most B2B marketing teams are still reporting on cost per lead or cost per click. These metrics are easy to pull from ad platforms, but they tell you very little about whether your spend is generating actual revenue. A campaign that produces leads at a low cost per lead might be generating a high volume of unqualified prospects that never progress past the first sales call. A campaign with a higher cost per lead might be producing a smaller number of highly qualified opportunities that close at a strong rate.
The metrics that matter in B2B are cost per pipeline opportunity and cost per closed deal, broken down by channel, campaign, and ad creative. To calculate these, you need to connect your ad spend data to your CRM pipeline data. This requires integrating your ad platforms with your CRM so that the source of each opportunity and each closed deal is tracked back to the specific campaigns that influenced it.
Take this a step further by integrating your billing platform, such as Stripe, with your attribution data. This allows you to connect actual subscription revenue to the campaigns that drove it. Instead of seeing which campaigns generated leads, you can see which campaigns generated customers and how much revenue those customers represent. This is the clearest possible picture of ad ROI.
Build a reporting dashboard that shows the following for each channel and campaign: ad spend, pipeline opportunities generated, revenue closed, and return on ad spend calculated from actual revenue rather than estimated lead value. When you can see this data in a single view, budget decisions become much more straightforward.
Cometly is designed to create exactly this kind of unified reporting view. It connects your ad platforms, CRM, and Stripe data so you can see the full journey from ad click to closed revenue in real time. This removes the guesswork from budget allocation and gives you a single source of truth for every marketing investment decision.
Your success indicator: a single dashboard showing ad spend, pipeline generated, revenue closed, and ROI by channel, campaign, and ad creative, updated in real time.
Step 6: Use AI-Driven Insights to Scale What Works and Cut What Does Not
Once accurate data is flowing through your attribution system, you have the foundation to use AI-driven insights to accelerate your optimization. This is where the work of the previous steps pays off in a significant way.
AI recommendations are only as good as the data they are trained on. If you have been sending incomplete or low-quality conversion signals to your ad platforms, their algorithms have been optimizing toward the wrong outcomes. Now that you have clean, revenue-quality data flowing through your system, you can use AI to surface patterns that would be difficult to identify manually.
Look for patterns in creative performance, audience segments, and bidding strategies that correlate with revenue, not just clicks or leads. A particular ad creative might have a mediocre click-through rate but produce a disproportionately high number of closed deals. An audience segment that looks expensive on a cost-per-click basis might have the lowest cost per closed deal in your entire account. These insights are invisible when you are optimizing for surface-level metrics.
One of the most impactful things you can do at this stage is feed enriched, conversion-ready events back to Meta and Google. When you send these platforms high-quality signals that reflect actual revenue outcomes, their machine learning algorithms get significantly better at finding audiences that look like your best customers. This is not a minor improvement. It fundamentally changes the quality of traffic your campaigns generate.
Use the revenue attribution data you built in Step 5 to set budget rules based on cost per pipeline opportunity or cost per closed deal. Campaigns that exceed your target cost per closed deal should be flagged for reduction or restructuring. Campaigns that are producing pipeline at an efficient cost should receive additional budget.
Reallocate budget from campaigns with high spend and low revenue contribution to campaigns with proven pipeline impact. This is the core mechanism for reducing wasted ad spend: not cutting budget overall, but redirecting it toward what is demonstrably working.
One important caution: do not scale too fast before your attribution data is clean and stable. Scaling spend on campaigns before you have verified that the attribution data is accurate can amplify existing waste rather than eliminate it. Take the time to validate your data before making large budget shifts.
Your success indicator: budget is consistently flowing toward campaigns with the lowest cost per closed deal, and your ad platform algorithms are optimizing toward revenue-quality signals rather than lead volume.
Step 7: Build a Continuous Optimization Cadence
The steps above give you the foundation and the tools. This final step is about building the habit that keeps the system working over time. Attribution data is most valuable when it is reviewed regularly and used to make incremental decisions, not just consulted during quarterly planning cycles.
Set a weekly review cadence focused on tactical decisions. Each week, check your attribution data for anomalies, review campaign-level performance against your cost per pipeline opportunity benchmarks, and make small budget adjustments based on what you see. Weekly reviews keep you from letting underperforming campaigns run unchecked for months.
Use monthly reviews for strategic decisions. Each month, evaluate channel-level ROI, assess whether your attribution model is still reflecting your customer journey accurately, and make larger shifts in budget allocation based on the trends you are observing. Monthly reviews are also the right cadence for evaluating new channels or testing new creative approaches.
Track trends over time, not just point-in-time snapshots. Is your cost per pipeline opportunity improving as you optimize targeting and creative? Is the quality of your pipeline increasing as your ad platform algorithms learn from better conversion signals? These trend lines tell you whether your optimization efforts are compounding over time.
Document everything you cut, why you cut it, and what happened to overall pipeline volume and quality after the change. This creates an institutional knowledge base that prevents you from repeating the same mistakes and helps you build a clearer picture of what actually drives results in your specific market.
Finally, involve sales and revenue operations in your review process. Marketing attribution data is more valuable when it is cross-referenced with qualitative feedback from the sales team about lead quality, deal velocity, and the characteristics of your best customers. When sales and marketing are aligned around the same revenue data, budget decisions become faster and more confident.
Your success indicator: you have a repeatable process for reviewing attribution data, making budget decisions, and measuring the downstream impact on pipeline and revenue, with clear documentation of what you changed and why.
Putting It All Together
Reducing wasted ad spend in B2B is not about cutting budget. It is about redirecting it toward what actually drives revenue. The seven steps in this guide give you a structured path from audit to optimization.
You start by identifying where spend is leaking. You fix the tracking foundation so your data is accurate and complete. You choose an attribution model that reflects the reality of your B2B buying cycle. You map the full customer journey to understand how channels work together. You connect spend to pipeline and revenue so every budget decision is grounded in business outcomes. You use AI to scale what is working and cut what is not. And you build a cadence that keeps the system improving over time.
The common thread across all of these steps is accurate, complete data. Without it, every budget decision is a guess. With it, you can make confident calls about where to invest and where to stop.
Cometly is built to help B2B SaaS teams do exactly this. It connects your ad platforms, CRM, and billing data into a single attribution view so you can see which campaigns drive pipeline and revenue in real time. From server-side conversion tracking to AI-driven recommendations, it gives your team the tools to capture every touchpoint, understand what is actually converting, and optimize with confidence.
If you are ready to stop optimizing for clicks and start optimizing for revenue, Get your free demo today and see how Cometly can give your team the attribution clarity it needs to make every dollar count.