You've done everything right. Your campaigns are generating leads, your MQL numbers look healthy, and your dashboard shows plenty of activity. But when the quarter closes, the pipeline is thin and the deals that did close don't seem to trace back to your highest-volume channels. Sound familiar?
This is one of the most common frustrations in B2B SaaS marketing: activity metrics that look promising but fail to predict revenue. The problem often isn't the campaigns themselves. It's the lens you're using to evaluate them. When you track marketing performance at the individual lead level, you're seeing fragments of a much larger picture.
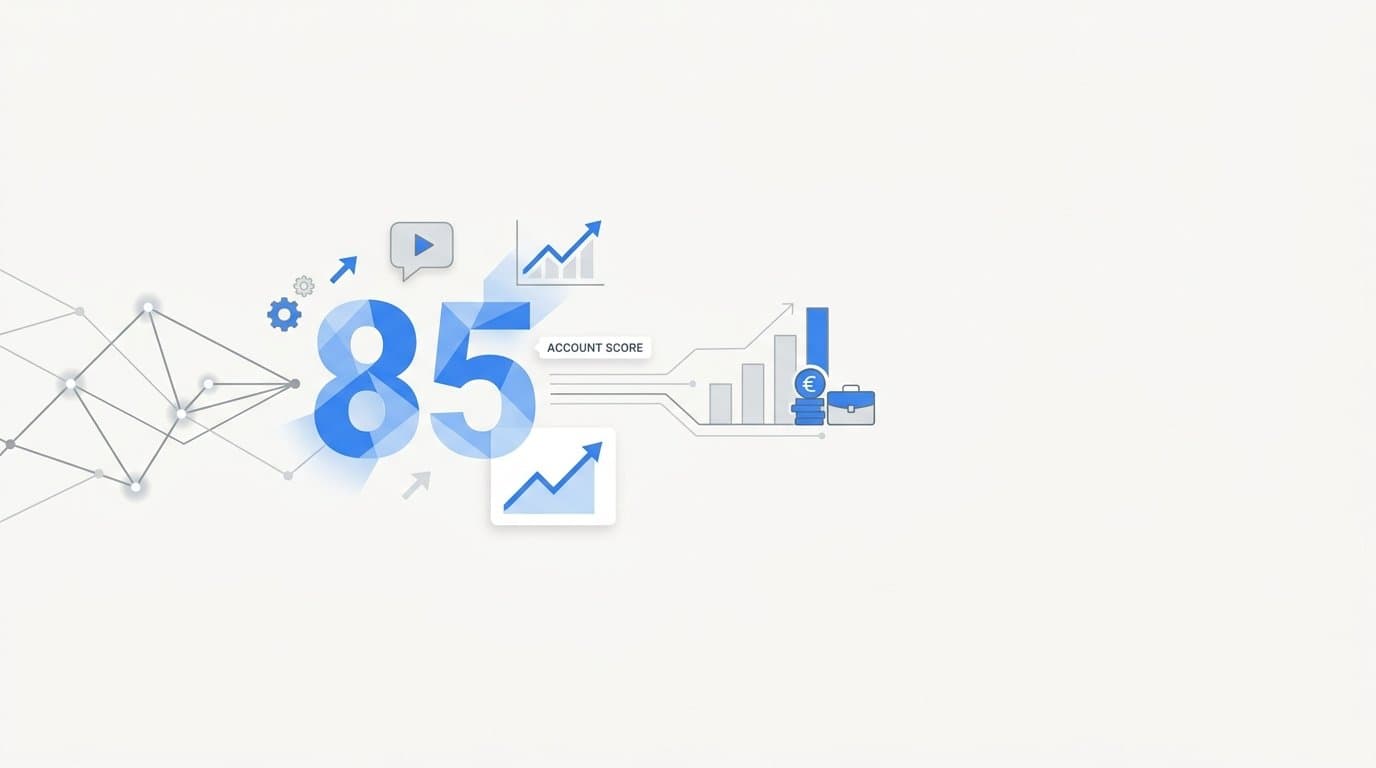
Account engagement score tracking offers a different lens. Instead of asking "did this contact interact with our content?", it asks "is this account, as a whole, showing buying intent?" That shift changes everything about how you prioritize accounts, allocate budget, and align marketing with sales.
This article covers what account engagement scores are, how they're built from real signal data, how to track them accurately across the customer journey, and how to connect them to pipeline and revenue outcomes. If your team is still flying blind on which accounts deserve attention, this is where that changes.
Why Lead-Level Data Leaves B2B Revenue Teams in the Dark
In B2B SaaS, no one buys alone. A typical software purchase involves multiple stakeholders: a champion who discovered your product, a manager who approved the evaluation, a finance lead who reviewed pricing, and an IT stakeholder who assessed the integration requirements. These people rarely show up in your CRM as a coordinated unit. They show up as separate contacts, each with their own activity history.
When your marketing team optimizes for MQLs, you're often scoring those individuals in isolation. Contact A downloaded a whitepaper. Contact B clicked a retargeting ad. Contact C visited your pricing page twice. Individually, none of them crosses the threshold for a high-priority lead. But together, they represent an account that has multiple stakeholders actively researching your product. That's a very different signal than any single contact could produce.
This is where lead-level tracking creates a structural blind spot. Marketing teams end up chasing volume, pushing more contacts into the funnel, without a clear view of whether the accounts those contacts belong to are actually moving toward a purchase decision. Sales teams receive long lists of MQLs with no way to tell which accounts are genuinely ready for outreach and which are just browsing.
The result is a misalignment that costs both time and budget. Sales reps spend cycles on accounts that aren't ready. Marketing keeps spending on channels that generate activity without generating pipeline. The feedback loop between the two teams breaks down because they're not looking at the same unit of measurement.
Account engagement score tracking fixes this by shifting the fundamental unit of analysis from the individual contact to the account. Instead of asking how engaged a lead is, you're asking how engaged an account is. That composite view, built from all the activity across every contact associated with an account, gives revenue teams a unified signal they can actually act on.
For B2B SaaS teams running account-based marketing programs or targeting specific ICP segments, this shift isn't just useful. It's foundational. Without it, you're making budget and prioritization decisions based on an incomplete picture of what's actually happening inside your target accounts.
What an Account Engagement Score Actually Measures
An account engagement score is a composite metric. It aggregates behavioral signals from every contact associated with a given account and rolls them up into a single number that reflects the account's overall level of engagement with your brand.
Think of it like a temperature reading for an account. A low score means the account is cold: minimal interaction, no recent activity, no signal that anyone there is actively evaluating your product. A high score means the account is heating up: multiple contacts are interacting across different channels, they're returning to your site, they're engaging with high-intent content, and the pattern of activity looks like a buying process in motion.
The inputs that feed this score typically span several categories. Website behavior contributes signals like page visits, time on site, return sessions, and specific high-intent page views such as pricing or feature comparison pages. Ad interaction data captures how contacts from the account have engaged with your paid campaigns across platforms like Google and Meta. CRM activity adds signals from sales touchpoints: email replies, call completions, meeting bookings, and opportunity stage changes. Where applicable, product usage data can also contribute, particularly for SaaS companies with freemium models or trial users.
Not all signals carry equal weight, and that's by design. A demo request is a much stronger buying signal than a blog page view. A pricing page visit outweighs a social media impression. Most scoring models apply a weighting system that reflects this hierarchy of intent, assigning higher point values to signals that more closely correlate with purchase readiness.
Recency also matters. An account that visited your pricing page three times in the last week is more relevant to your sales team than an account that downloaded a whitepaper six months ago. Well-built scoring models apply time decay, reducing the weight of older interactions so the score reflects current intent rather than historical activity.
The result is a metric that tells you, at a glance, which accounts are actively engaged right now, which ones are warming up, and which ones have gone quiet. For B2B SaaS teams managing large target account lists, this kind of prioritization signal is enormously valuable. It replaces guesswork with data, and it gives marketing and sales a shared language for describing account readiness.
Critically, the score reflects buying intent at the account level, not just individual activity. That distinction makes it a far more reliable predictor of pipeline readiness than any individual lead score could be. When multiple stakeholders from the same account are engaging simultaneously, the composite score captures that momentum in a way that individual contact records simply cannot.
The Touchpoints That Feed a Reliable Engagement Score
The accuracy of an account engagement score depends entirely on the quality and completeness of the data feeding it. A score built on partial data will give you a partial picture. To build a score you can trust, you need to capture touchpoints across three primary categories: paid ad interactions, CRM events, and website behavior.
Paid Ad Interactions: Every time a contact from a target account clicks an ad, watches a video, or engages with a retargeting campaign, that interaction tells you something about where the account is in its buying journey. First-touch ad data reveals how the account originally discovered your product. Multi-touch ad data shows which messages and content formats resonated as the account moved through the funnel. Feeding this data into your engagement scoring model gives you visibility into the role your paid campaigns are playing in account-level intent, not just individual clicks.
CRM Events: Sales activity data is among the highest-value input you can feed into an engagement score. When a contact from an account replies to a sales email, completes a discovery call, or moves to a new opportunity stage, those are strong signals that the account is actively evaluating your product. These events should be captured in your CRM and fed back into your scoring model in real time. Many teams underutilize CRM data in their scoring because it requires connecting sales activity to marketing systems, but the signal quality is too strong to ignore.
Website Behavior: Not all page visits are equal. A contact who spends several minutes on your pricing page and then navigates to your integration documentation is showing a very different level of intent than someone who bounced from your homepage. Tracking website behavior at the account domain level, using first-party data to associate sessions with known accounts, allows you to capture depth-of-interest signals that reveal where an account is in its evaluation process. Return visits are particularly telling: an account that keeps coming back is an account that's still actively considering you.
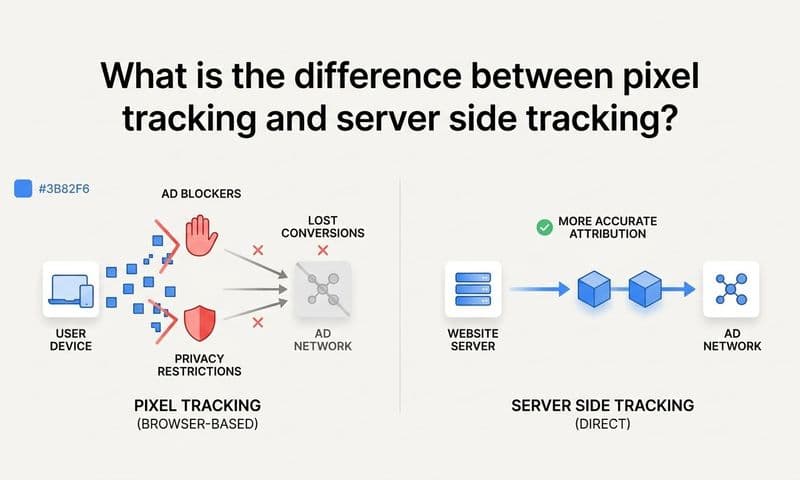
The challenge with website tracking is data completeness. Browser-based pixels miss interactions from users with ad blockers, those who switch devices mid-journey, or those in environments where third-party cookies are restricted. This means a purely pixel-based approach will undercount engagement and produce scores that don't fully reflect account activity.
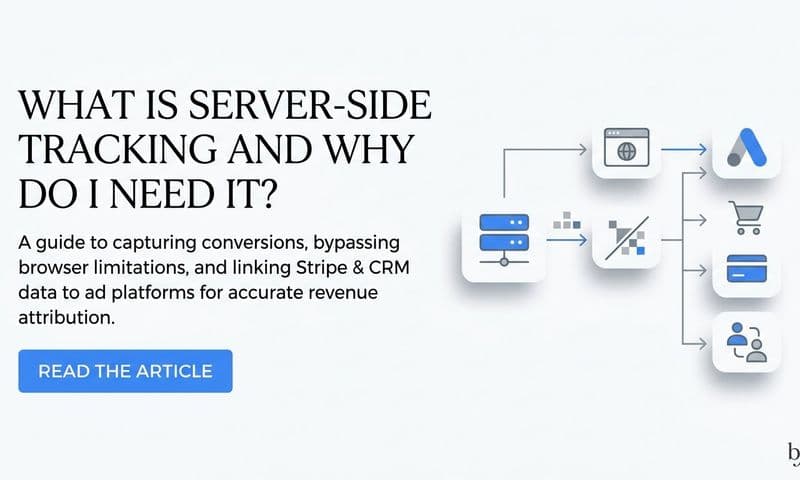
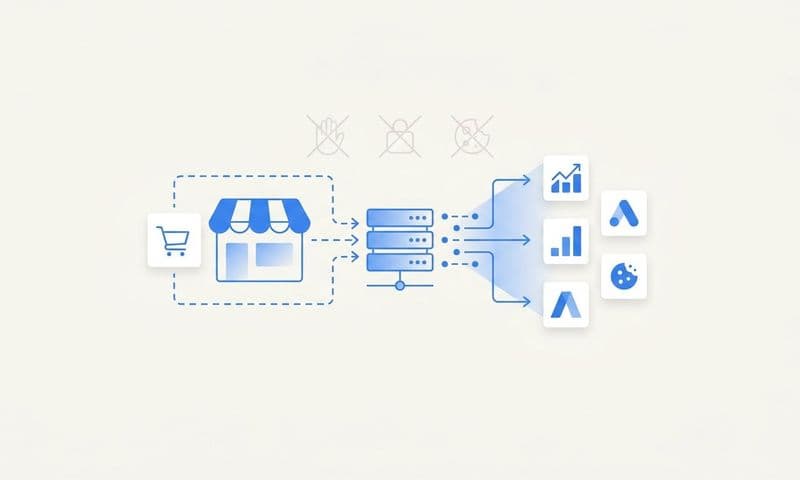
Server-side tracking addresses this gap by capturing events at the server level rather than relying on the browser. When combined with Conversion API integrations, this approach ensures that your engagement score reflects the full picture of account activity, not just the portion that browser-based tracking managed to capture. For B2B SaaS teams that need accurate signals to make budget and prioritization decisions, this completeness is not optional. It's the foundation of a score you can rely on.
How to Build and Track Engagement Scores Across the Customer Journey
Building a reliable account engagement score is a structured process. It starts with defining what you're measuring, moves through the technical infrastructure required to capture it accurately, and ends with a real-time scoring layer that updates as accounts move through your funnel.
Step 1: Map touchpoints to buying stages. Before you assign weights, you need a clear map of which signals correspond to which stages of the buying journey. Awareness-stage signals, such as a first ad click or a blog visit, indicate that an account has discovered you but isn't yet evaluating. Consideration-stage signals, including pricing page visits, feature comparison views, and content downloads, indicate active evaluation. Decision-stage signals, such as demo requests, sales call completions, and repeat pricing page visits, indicate that the account is close to a purchase decision. Each stage should carry progressively higher weight in your scoring model, reflecting the increasing level of intent those signals represent.
Step 2: Implement server-side tracking and Conversion API integrations. This is where many teams fall short. If your scoring model relies on browser-based pixel data alone, you're working with incomplete information. Server-side tracking captures events that pixels miss: cross-device sessions, ad blocker-affected visits, and interactions in restricted cookie environments. Conversion API integrations with platforms like Meta and Google allow you to send conversion events directly from your server to the ad platform, improving both data completeness and the quality of the signals feeding your score.
For B2B SaaS companies with longer sales cycles and multiple stakeholder touchpoints, this level of tracking infrastructure is what separates a reliable engagement score from a noisy one. The more complete your data capture, the more accurately your score reflects real account intent.
Step 3: Build a unified attribution layer. Your engagement score is only as good as the data sources feeding it. Ad platform data, CRM events, and website analytics need to be connected into a single attribution layer so that the score updates in real time as new signals come in. When a contact from an account clicks a Google ad, books a meeting, and visits your pricing page all in the same week, your score should reflect that convergence immediately, not after a manual data sync.
This unified layer also makes it possible to trace which specific campaigns and channels are driving engagement activity at the account level. You're not just seeing that an account's score went up; you're seeing exactly which touchpoints contributed to that increase. That attribution context is what turns an engagement score from an interesting metric into an actionable one.
Platforms like Cometly are built specifically for this kind of unified attribution. By connecting ad platforms, CRM data, and website analytics into a single tracking layer, Cometly gives B2B SaaS teams a real-time view of account engagement that reflects every touchpoint across the customer journey, not just the ones that browser-based tracking managed to capture.
Connecting Engagement Scores to Pipeline and Revenue Attribution
An engagement score sitting in a dashboard is interesting. An engagement score connected to pipeline and revenue outcomes is strategic. The difference between the two is attribution.
The most valuable question you can ask about your scoring model is: at what score threshold do accounts consistently convert to opportunities and closed-won deals? Answering that question requires looking backward at your historical pipeline data and identifying patterns. Which accounts that became closed-won deals had high engagement scores at the point of sales outreach? What did their score trajectories look like in the weeks before they entered the pipeline? These patterns tell you where to set your thresholds and how to interpret score movements in real time.
Once you've established those thresholds, the next step is connecting them to your attribution data. Knowing that an account crossed your conversion threshold is useful. Knowing which specific campaigns, channels, and ad creatives drove the engagement activity that pushed it over that threshold is what enables marketing teams to replicate success at scale.
Revenue attribution closes this loop. When you can trace a closed-won deal back through the engagement score history of that account, and then trace that engagement history back to specific ad campaigns and touchpoints, you have a complete picture of what marketing actually contributed to that revenue. This is the kind of data that justifies marketing spend, informs budget reallocation, and builds credibility with finance and leadership.
For sales teams, engagement scores tied to pipeline data create a prioritized account list based on real intent signals rather than gut instinct. Instead of asking reps to work through a flat list of MQLs, you can give them a ranked view of accounts sorted by engagement score, with context about which touchpoints contributed to the score. That context helps reps personalize their outreach and enter conversations with a clearer understanding of where the account is in its evaluation process.
The practical outcome is better alignment between marketing and sales, grounded in shared data. Marketing can show which campaigns are generating high-scoring accounts. Sales can show which of those accounts are converting to pipeline. Together, the two teams can identify where the handoff is working and where it needs adjustment, using engagement score data as a common reference point rather than arguing over lead quality in the abstract.
Turning Engagement Score Data Into Smarter Campaign Decisions
Engagement score data is most powerful when it feeds back into your campaign strategy. The goal isn't just to track which accounts are engaged. It's to understand which campaigns and channels are generating engagement from the accounts that actually matter, and then to use that understanding to make smarter spending decisions going forward.
Start by segmenting your engaged accounts by fit. A high engagement score from an account that matches your ICP is a very different signal than a high score from an account that's outside your target market. When you layer ICP fit on top of engagement score data, you can identify which campaigns are generating activity from high-fit accounts versus which ones are attracting low-fit traffic that inflates your engagement metrics without contributing to revenue.
This segmentation allows you to shift budget toward the channels and creatives that are driving meaningful engagement from the right accounts, and away from the ones that are generating noise. Over time, this kind of data-driven budget reallocation compounds: you're continuously moving spend toward what works and reducing waste on what doesn't.
Feeding enriched engagement data back into ad platforms through Conversion API integrations takes this a step further. When you send high-quality conversion signals back to Meta, Google, and other platforms, their algorithms use that data to improve targeting. Instead of optimizing for surface-level engagement metrics, the platform learns to find accounts that resemble your highest-scoring, highest-converting segments. This creates a virtuous cycle: better data in produces better targeting, which produces higher-quality engagement, which produces better data.
AI-driven analysis adds another layer of capability. Modern attribution platforms can surface patterns in engagement score behavior across account segments, identifying which combinations of channels, touchpoints, and messages most reliably move accounts toward revenue. These insights go beyond what manual analysis can produce, especially at scale. Instead of relying on intuition about which campaigns are working, you're working from pattern recognition across your entire account base.
Cometly's AI-driven approach to attribution is built around exactly this kind of analysis. By capturing every touchpoint across the customer journey and connecting ad spend to pipeline and revenue outcomes, Cometly gives growth teams the data they need to identify what's working, scale what's performing, and continuously improve the quality of their targeting by feeding enriched signals back to ad platforms.
Putting It All Together
Account engagement score tracking gives B2B SaaS teams something that lead-level metrics alone cannot: a unified, account-level signal that reflects real buying intent across every stakeholder in the account. It shifts the question from "is this contact active?" to "is this account ready to buy?" That shift changes how you prioritize, how you spend, and how marketing and sales work together.
The quality of your engagement score depends entirely on the completeness of the data feeding it. Partial data produces partial scores. To build a score you can trust, you need to connect ad platform data, CRM events, and website behavior into a single attribution layer, and you need server-side tracking to capture the touchpoints that browser-based pixels miss.
When engagement scores are connected to pipeline and revenue attribution, they become strategically powerful. You can identify which campaigns are driving high-scoring accounts, which score thresholds predict conversion, and which channels deserve more budget based on the revenue they're actually generating. That's the difference between a marketing team that reports on activity and one that drives outcomes.
Cometly is built to make this possible. It captures every touchpoint across the customer journey, connects ad spend directly to pipeline and revenue, and feeds enriched conversion data back to ad platforms for smarter optimization. If your team is ready to move beyond lead-level metrics and build an attribution foundation that reflects the full picture of account engagement, Cometly gives you the tools to do it.
Get your free demo today and start capturing every touchpoint to maximize your conversions.