Deals are closing. Pipeline is moving. But if you asked your team right now how long your average sales cycle actually is, and whether that number is good or bad, most people would hesitate. That hesitation is the problem.
Sales cycle length is one of the most frequently tracked and least accurately measured metrics in B2B SaaS. Teams report a number, but that number often reflects how they defined the start of the cycle, which attribution model they used, and which touchpoints their tracking actually captured. Change any one of those variables, and the number changes too.
Benchmarking sales cycle length without a solid measurement foundation is like timing a race without agreeing on where the starting line is. The data looks precise, but the conclusions are unreliable. And when those conclusions drive budget decisions, hiring plans, and go-to-market strategy, the cost of getting it wrong compounds quickly.
This article breaks down what sales cycle length actually measures, how it varies across B2B SaaS segments, and why your attribution model has a bigger impact on your cycle length data than most teams realize. More importantly, it shows how marketing data sits at the center of this challenge, and how connecting your ad spend to closed revenue gives you the benchmarking foundation you actually need.
Breaking Down What Sales Cycle Length Actually Measures
At its simplest, sales cycle length is the average number of days between a lead's first meaningful engagement and a closed-won deal. But that definition contains a phrase that causes enormous confusion in practice: "first meaningful engagement."
Some teams start the clock at lead creation, which might mean the moment a form is submitted or a contact is added to the CRM. Others start it at opportunity creation, which typically happens after a qualification call. Others use the demo request as their starting point. Each of these definitions produces a different number, and none of them are wrong in isolation. The problem is when teams compare their numbers to benchmarks or to each other without accounting for these differences.
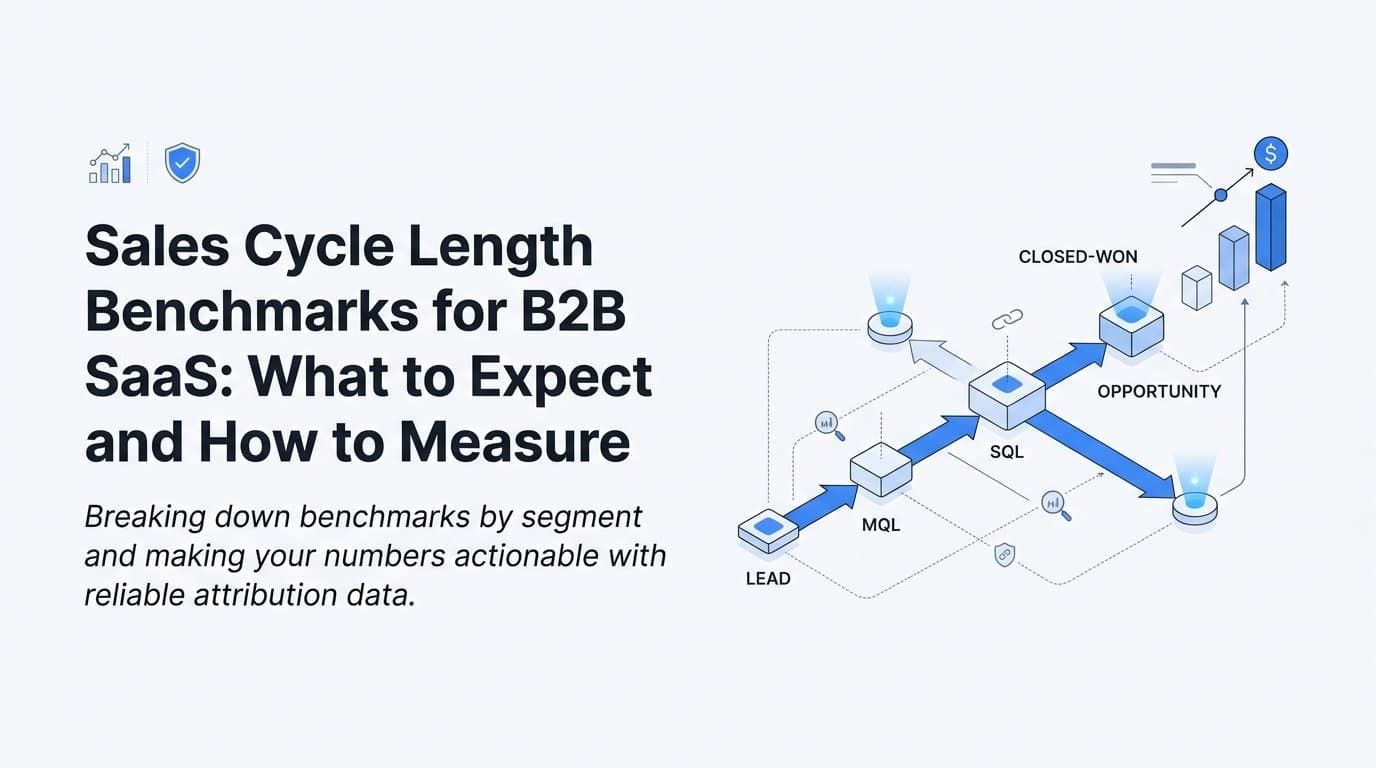
The stages that make up a typical B2B SaaS sales cycle include lead capture, qualification, discovery, demo, proposal, negotiation, and close. In practice, not every deal moves through every stage, and the boundaries between stages are often blurry. A discovery call might fold into the demo. Negotiation might begin before a formal proposal is sent. When stage definitions are inconsistent across reps or across time periods, the cycle length data becomes unreliable even within a single company.
This is where marketing touchpoints become critical to the measurement conversation. Before a prospect ever fills out a form or requests a demo, they have often interacted with your brand multiple times. They may have clicked a paid search ad, read a blog post, visited your pricing page, watched a webinar, and seen a retargeting ad on LinkedIn before they ever became a "lead" in your CRM. If your sales cycle clock starts at form submission, all of those earlier interactions are invisible in your cycle length calculation.
That matters because those early touchpoints are part of the buying journey. A prospect who has spent three weeks engaging with your content before requesting a demo is not the same as a prospect who found you through a cold email yesterday. Their perceived readiness, their likelihood to close quickly, and the support they need from your team are all different. Without attribution data that captures the pre-sales phase, you are measuring a portion of the journey and calling it the whole thing.
Defining sales cycle length accurately requires agreeing on a consistent start point, mapping the stages your team actually uses, and connecting marketing attribution data to the pre-sales phase so the full buying journey is visible. That foundation is what makes benchmarking meaningful.
How Sales Cycle Length Varies Across B2B SaaS Segments
There is no universal sales cycle benchmark that applies to all B2B SaaS companies. The range is wide, and the structural reasons for that range are worth understanding before you try to compare your numbers to anyone else's.
Deal size is the most reliable predictor of cycle length. SMB deals, typically those with annual contract values under $10,000, tend to close significantly faster than mid-market or enterprise deals. The structural reasons are straightforward: fewer decision-makers are involved, procurement processes are simpler or nonexistent, and the financial risk of a wrong decision is lower. A small business owner can often approve a software purchase in a single conversation. An enterprise procurement team cannot.
Mid-market deals introduce more complexity. There are usually multiple stakeholders, a formal evaluation process, and some level of internal approval required. Cycles in this segment often run longer than SMB deals, sometimes considerably so, depending on how competitive the evaluation is and how well-defined the buyer's internal process is.
Enterprise deals are in a different category entirely. Security reviews, legal redlines, procurement workflows, and the involvement of five to ten or more stakeholders can extend a cycle by months. A deal that would take weeks to close at the SMB level can take most of a year at the enterprise level, not because the product is harder to understand, but because the organizational machinery required to approve it moves slowly.
Product complexity and required integrations also add time. If your product needs to connect to a customer's existing data warehouse, ERP system, or identity provider, those technical evaluations take time. If your product requires a security review before IT will approve it, that adds weeks. These are not negotiation delays; they are structural requirements that extend the cycle regardless of how strong your sales process is.
Product-led growth models can compress the early stages of the cycle in ways that sales-led motions cannot. When prospects can sign up for a free trial or freemium tier and self-qualify through actual product usage, they arrive at the sales conversation already familiar with the product. The discovery and demo stages shrink because the prospect has already done much of that work themselves. This does not always mean the overall cycle is shorter, especially for enterprise PLG deals, but it does change where the time is spent.
Channel mix also affects observed cycle length in ways that are easy to misinterpret. Leads from organic search or review site traffic often enter your funnel later in their buying journey. They have already been researching solutions, they know what category of product they need, and they are actively comparing options. These leads may appear to close faster from first touch to close, not because they are easier to sell to, but because they were already closer to a decision when you first encountered them. Cold outbound leads, by contrast, are often earlier in their awareness stage, which extends the observed cycle even if the quality of the deal is ultimately the same.
The Marketing Touchpoints That Lengthen or Shorten Your Cycle
Not all traffic is created equal, and not all leads enter your funnel at the same point in their buying journey. Understanding how different channels and touchpoints affect cycle length is one of the most actionable insights marketing teams can develop.
High-intent channels tend to produce shorter cycles. Branded search captures prospects who already know your company by name and are actively looking for you. Review site traffic, such as visitors coming from G2 or Capterra, represents buyers who are deep in an active evaluation. Direct referrals from existing customers carry trust that reduces the time needed to establish credibility. In each of these cases, the prospect arrives with existing awareness or a strong recommendation, which compresses the early stages of the buying journey.
Top-of-funnel paid social campaigns operate differently. They reach prospects who may not have been actively searching for a solution, which means they generate earlier-stage awareness leads. These leads are not lower quality, but they require more nurturing before they are sales-ready. If you measure cycle length from first ad click, these campaigns will appear to produce longer cycles. If you measure from demo request, the difference may be less visible, but the nurturing work that happened in between is still real and still costs time and resources.
Multi-touch attribution is what allows you to see these patterns clearly. When you can map the full sequence of touchpoints that precede a closed deal, you can start to identify which content assets, ad campaigns, or channels appear most frequently in the paths of fast-closing deals versus slow ones. Maybe your product comparison pages consistently appear in the touchpoint histories of deals that close in under 60 days. Maybe your top-of-funnel awareness content shows up in the paths of your highest-ACV deals, even if those deals take longer to close. These are patterns that last-click attribution will never reveal.
Touchpoint velocity is a related concept worth tracking. This refers to how many interactions a prospect has before converting, and how quickly those interactions happen. A prospect who engages with five pieces of content over two days is behaving very differently from one who engages with five pieces of content over three months. Tracking velocity across channels helps teams identify where deals tend to stall, which is often a sign that the right content or outreach is not reaching the prospect at the right moment.
When you know which touchpoints accelerate deals and which ones precede stalls, you can make specific decisions: invest more in the content that appears in fast-closing paths, build retargeting sequences that re-engage prospects who have gone quiet, and equip your sales team with the right assets for each stage of the journey. That is the difference between managing a sales cycle and actively shaping it.
Why Your Attribution Model Changes How You See Cycle Length
Your attribution model is not just a reporting choice. It is a lens that fundamentally changes what your sales cycle data looks like, and therefore what decisions you make based on it.
Last-click attribution assigns all credit to the final touchpoint before a conversion. In a sales cycle context, this means the demo request form, the pricing page visit, or the bottom-of-funnel ad that a prospect clicked right before converting gets all the credit. Everything that happened before that final interaction is invisible. The result is that last-click attribution systematically compresses the perceived sales cycle. If you are only measuring from the last click, your data will suggest that deals close faster than they actually do from a full-journey perspective.
This distortion has real consequences. Teams using last-click data often conclude that their bottom-of-funnel channels are their most valuable ones, because those are the channels that appear to drive conversions. They increase investment in retargeting, branded search, and review site advertising while cutting back on awareness-stage content and top-of-funnel paid social. What they do not see is that the bottom-of-funnel conversions they are crediting were often initiated by an awareness-stage touchpoint weeks or months earlier. Cut the top of the funnel, and the bottom eventually dries up too.
Multi-touch attribution models distribute credit across all touchpoints in the buying journey. Linear attribution gives equal weight to every interaction, which reveals the full length and complexity of the journey in a way that last-click never does. Data-driven attribution goes further, using algorithmic weighting to assign credit based on which touchpoints are most predictive of conversion. This is the most accurate model for understanding true cycle dynamics, because it reflects the actual contribution of each interaction rather than applying an arbitrary rule.
For B2B SaaS teams, multi-touch attribution is not optional if you want accurate cycle length data. Buying journeys in this space are long, involve many touchpoints across multiple channels, and often span weeks or months before a prospect ever talks to a salesperson. A model that ignores all of that complexity will produce a number that looks clean but reflects a fiction.
The practical implication is this: before you benchmark your sales cycle length against any external reference point, you need to know which attribution model produced your number. A team measuring from first ad impression using linear attribution will report a very different cycle length than a team measuring from demo request using last-click. Neither number is inherently right or wrong, but they are not comparable, and they should not be treated as if they are.
Connecting Sales Cycle Data to Revenue Attribution
Understanding your sales cycle length in isolation is useful. Understanding it by marketing source, campaign, and audience segment is where the real strategic value lives.
Pipeline attribution maps marketing sources to pipeline stages and closed revenue, giving growth teams the ability to see not just where leads come from but how long each source takes to convert. This is a fundamentally different question from "which channel drives the most leads." It asks which channel drives the fastest, highest-value deals, and that distinction changes how you allocate budget.
Imagine being able to see that leads from a specific LinkedIn campaign take an average of 90 days to close, while leads from organic search take 45 days. Or that leads from a particular content offer have a higher ACV but a longer cycle than leads from a competitor comparison page. These are the insights that allow you to forecast more accurately, staff your sales team appropriately, and build a marketing mix that balances speed with deal quality.
Getting to that level of analysis requires integrating your CRM data with your ad platform data. When those two systems share a common identifier for each lead or contact, you can trace a deal from its originating ad impression through every stage of the pipeline to the closed-won event. You can compare average cycle length by source, by campaign, by audience segment, and by deal size. You can see which combinations of channel and offer produce the fastest paths to revenue.
Server-side tracking and Conversion API integrations are essential infrastructure for making this work. Browser-based tracking has become increasingly unreliable as privacy changes limit cookie-based measurement. When early-funnel events such as form fills, demo requests, and trial signups are not captured accurately, the data gaps that result distort your cycle length calculations. A lead that took 60 days to close might appear to have closed in 15 days if the first 45 days of touchpoints were never recorded.
Server-side tracking sends conversion events directly from your server to ad platforms, bypassing the browser entirely. This ensures that early-funnel interactions are captured accurately and that your attribution data reflects the actual buying journey rather than the portion of it that browser-based tracking managed to record. First-party data enrichment, which connects ad click data to CRM entries, closes the gap between marketing and sales data and prevents the kind of data loss that makes cycle length analysis unreliable.
Putting It All Together: Using Benchmarks to Drive Smarter Growth
The most important thing to understand about sales cycle length benchmarks is that they are only as useful as the measurement foundation beneath them. A benchmark from an industry report or a peer conversation means very little if your own data is built on inconsistent stage definitions, last-click attribution, and browser-based tracking gaps. Fix the foundation first, then benchmark with confidence.
Here is a practical framework for B2B SaaS teams to start measuring sales cycle length accurately. First, define your cycle start point consistently across your entire team. Whether you choose first ad touch, lead creation, or opportunity creation, document it and apply it uniformly. Second, connect your ad platform data to your CRM so that every lead has a traceable origin. This connection is what allows you to analyze cycle length by source and campaign. Third, implement server-side tracking and Conversion API integrations to ensure that early-funnel events are captured accurately. Fourth, move beyond last-click attribution and adopt a multi-touch model that reflects the full buying journey.
Once that foundation is in place, use your attribution reports to identify which channels produce the fastest and highest-value deals, which content assets appear in the paths of deals that close quickly, and where in the funnel deals tend to stall. These patterns are the basis for smarter budget allocation and more effective sales enablement.
AI-driven attribution analysis takes this further by surfacing patterns that manual reporting misses. When your data includes every touchpoint from first ad click to closed-won revenue, AI can identify which combinations of channel, content, and timing correlate with faster cycles and higher deal values. That kind of insight is not something a spreadsheet can produce at scale.
Cometly connects ad spend, pipeline, and revenue into a single attribution view, giving B2B SaaS teams the data infrastructure they need to benchmark sales cycle length with real numbers. From multi-touch attribution and pipeline reporting to server-side tracking and AI-driven analysis, it is built to give you a complete picture of every customer journey, from the first impression to the final signature.
The Bottom Line on Sales Cycle Benchmarking
Understanding sales cycle length benchmarks is not just a sales ops exercise. It is a marketing intelligence challenge. When marketers can see which campaigns, channels, and touchpoints accelerate or delay deals, they can make smarter budget decisions and build more predictable pipeline.
The teams that benchmark with confidence are not the ones with access to the best industry reports. They are the ones who have built a measurement foundation that captures every touchpoint, connects marketing data to closed revenue, and uses attribution models that reflect the actual complexity of the buying journey.
If your cycle length data is built on incomplete tracking and last-click attribution, the number you are benchmarking is not your real sales cycle. It is a partial view that leads to partial decisions. Getting the full picture requires connecting every touchpoint to every outcome, from the first ad click to the closed-won deal.
Ready to see your full customer journey and benchmark with real data? Get your free demo and discover how Cometly connects every touchpoint to closed revenue so your team can make smarter, faster decisions backed by attribution data you can actually trust.