
You're spending thousands on paid ads across Meta, Google, TikTok, and LinkedIn—but do you actually know which campaigns are driving revenue? Most marketers rely on platform-reported metrics that often inflate results due to overlapping attribution windows and cookie limitations. The result? Wasted budget on underperforming ads and missed opportunities to scale what's actually working.
This guide walks you through a proven process for tracking paid ads performance accurately. You'll learn how to set up proper tracking infrastructure, connect your ad platforms to real revenue data, and build a measurement system that shows exactly which ads generate leads and sales—not just clicks and impressions.
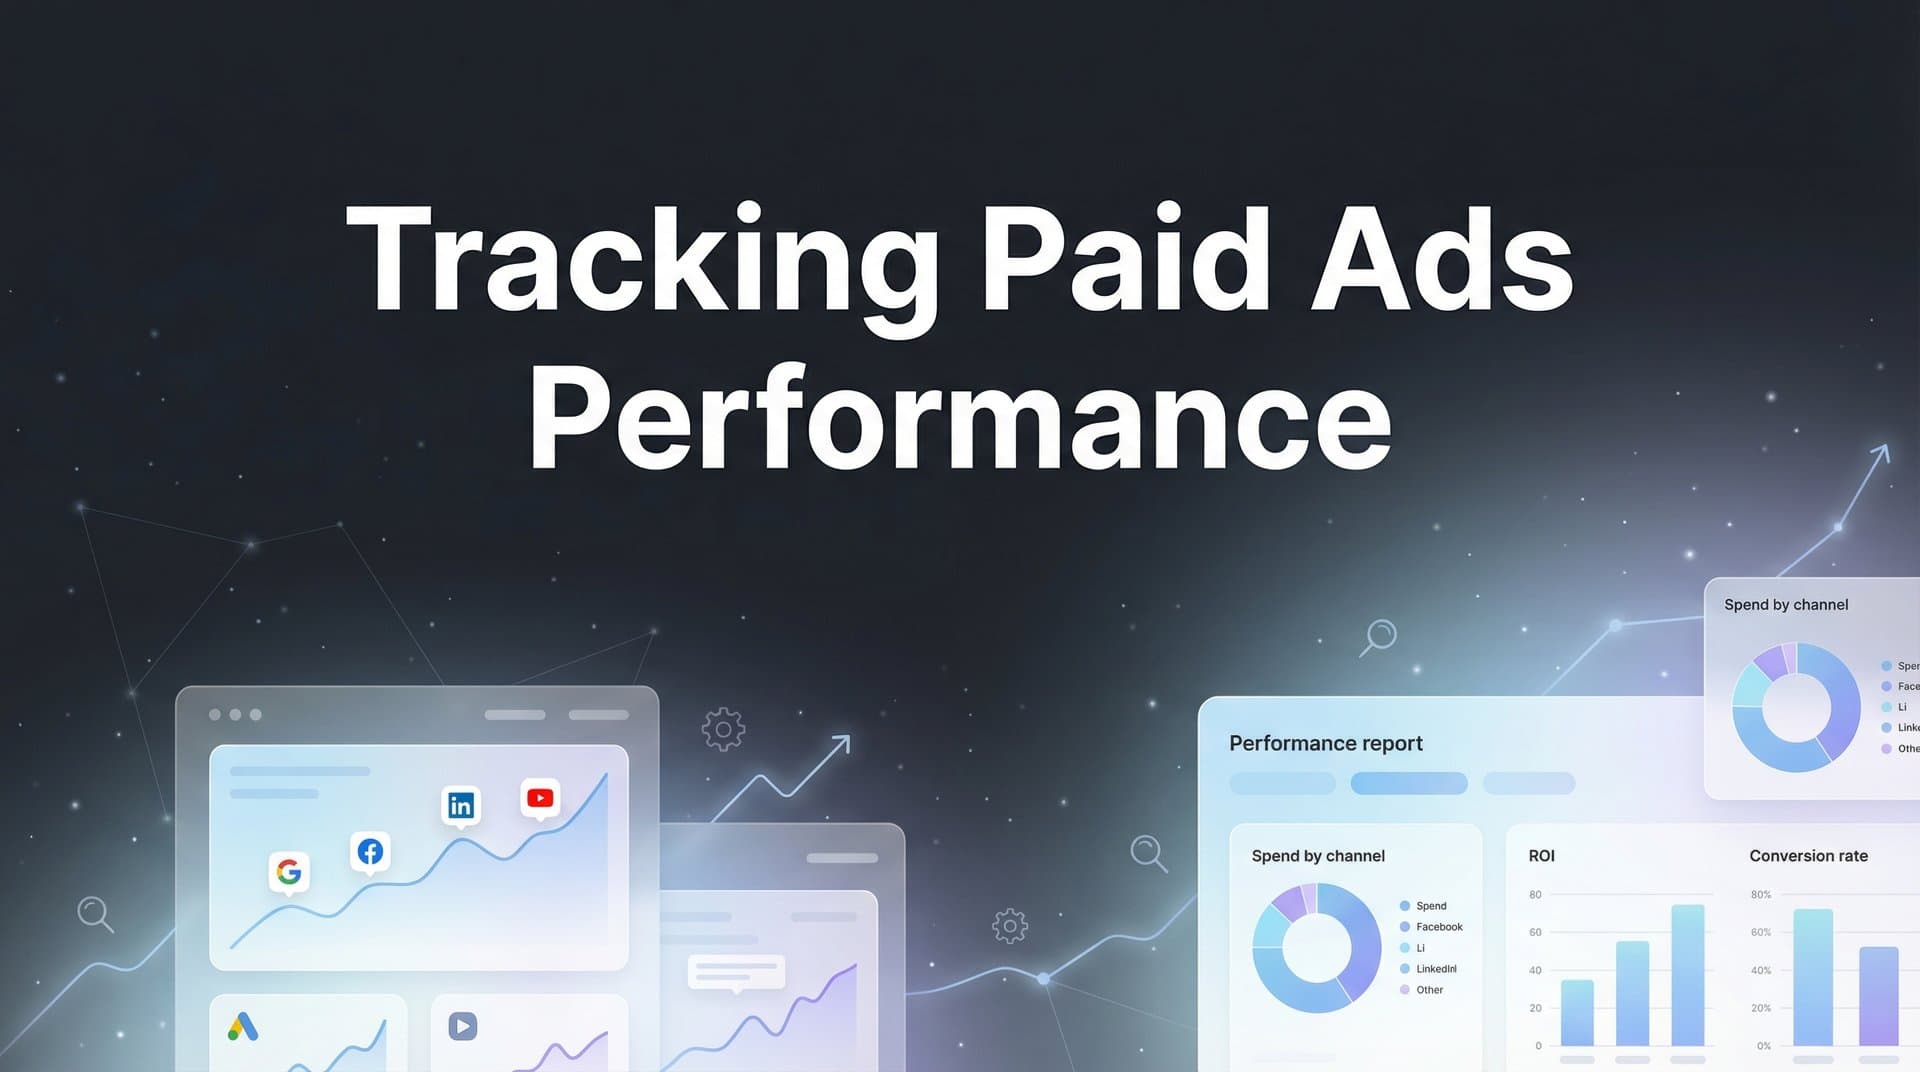
By the end, you'll have a complete tracking setup that captures every touchpoint from first click to closed deal, giving you the confidence to make data-driven decisions about where to invest your ad spend.
Step 1: Define Your Key Performance Metrics Beyond Platform Defaults
Before you set up any tracking infrastructure, you need clarity on what success actually looks like. Platform-reported metrics like impressions, clicks, and even conversions can mislead you if they're not connected to real business outcomes.
Start by identifying your revenue-focused metrics. Return on ad spend (ROAS) tells you how much revenue you generate for every dollar spent. Cost per acquisition (CPA) shows what you're paying to acquire each customer. Customer lifetime value (LTV) reveals the long-term worth of customers from different channels. These metrics connect your ad spend directly to business results. For a deeper dive into these concepts, explore our paid advertising performance metrics guide.
Now map your specific conversion events. What actions indicate genuine progress toward a sale? For e-commerce, this might be product purchases and cart additions. For SaaS companies, it's often demo bookings, free trial signups, and subscription upgrades. For service businesses, think lead form submissions, consultation requests, and phone calls. Be specific about what counts as a conversion worth tracking.
Establish baseline benchmarks for each metric before you start optimizing. What's your current ROAS across all platforms? What does a new customer cost you today? Without these baselines, you can't measure whether your tracking improvements actually drive better results. Pull the last 30-60 days of data from each platform to establish your starting point.
Here's the critical insight most marketers miss: platform-reported conversions often overcount your actual results. Each platform uses its own attribution window—Meta might claim credit for conversions up to 7 days after someone views your ad, while Google Ads tracks clicks for 30 days. When someone sees your Meta ad, clicks your Google ad, and then converts, both platforms claim the conversion. You're counting the same customer twice. Understanding attribution window best practices helps you navigate these discrepancies.
View-through attribution creates another layer of inflation. If someone scrolls past your ad without clicking, then converts days later through a completely different channel, some platforms still claim credit. The result? Your combined platform-reported conversions often exceed your actual customer count by 20-40%.
This is why you need a single source of truth—a tracking system that deduplicates conversions and shows which ad actually deserves credit. Your metrics should reflect reality, not the optimistic picture each platform wants to paint.
Step 2: Set Up Server-Side Tracking to Capture Data Browsers Miss
Browser-based tracking pixels used to be enough. You'd drop a snippet of code on your website, and it would fire events back to your ad platforms whenever someone converted. That world is gone.
Apple's iOS privacy updates fundamentally broke browser-based tracking. When users opt out of tracking (and most do), browser pixels can't fire. Ad blockers strip tracking scripts before they load. Cookie restrictions prevent cross-domain tracking. The result? Many marketers now miss 30-40% of their actual conversions because browser-based pixels simply can't see them. If you're experiencing this issue, our guide on paid ads underreporting conversions explains why this happens.
Server-side tracking solves this by sending conversion data directly from your server to ad platforms—no browser involved. When someone completes a purchase or submits a lead form, your server records the event and sends it to Meta, Google, and other platforms through their APIs. Because this happens server-to-server, it bypasses all the browser restrictions that block traditional pixels.
Think of it like this: browser pixels are like security cameras that customers can disable. Server-side tracking is like the store's internal receipt system—it records every transaction regardless of whether customers allow tracking on their devices.
You have two implementation paths. The manual route involves setting up conversion APIs for each platform, configuring your server to capture conversion events, and writing code to send those events to the right endpoints. This works, but it requires developer resources and ongoing maintenance as platforms update their APIs.
The alternative is using an attribution platform that handles server-side tracking automatically. These platforms integrate with your website and ad accounts, capture conversion events server-side, and distribute them to all your ad platforms through a single integration. You get the benefits of server-side tracking without building and maintaining the infrastructure yourself. Learn how ad tracking tools can help you scale ads using this approach.
Whichever path you choose, verification is critical before you go live. Set up test conversions—make a test purchase, submit a test lead form, book a test demo. Then check each platform's events manager to confirm the conversion data arrived correctly. Look for the event name, timestamp, and any custom parameters you're sending like revenue value or product category.
Pay special attention to event match quality scores in Meta's Events Manager and Google's conversion tracking interface. These scores tell you how well your server events match to user accounts on their platforms. Higher match rates mean better attribution accuracy and more effective campaign optimization. If your match rates are below 70%, you're likely missing key user identifiers like email addresses or phone numbers in your conversion data.
Step 3: Connect Your Ad Platforms to Your CRM and Revenue Data
Platform dashboards show you clicks, impressions, and conversions. Your CRM shows you leads, opportunities, and closed deals. When these systems don't talk to each other, you're flying blind on what matters most: which ads actually drive revenue.
The typical customer journey involves multiple steps: someone clicks your ad, visits your website, submits a lead form, enters your CRM as a prospect, gets nurtured by your sales team, and eventually becomes a paying customer. Each of these stages lives in a different system. Without connecting them, you can't see which $50 ad click turned into a $5,000 customer. Understanding customer journey mapping for paid ads helps you visualize these touchpoints.
Start by implementing a consistent UTM parameter structure across all your campaigns. UTM parameters are the tags you add to your destination URLs that identify where traffic comes from. Every ad should include utm_source (the platform), utm_medium (the ad type), utm_campaign (the campaign name), and utm_content (the specific ad or ad set).
Here's what consistency looks like in practice. For Meta ads, you might use utm_source=facebook, utm_medium=paid_social, utm_campaign=q1_product_launch, utm_content=video_ad_v2. For Google Search ads: utm_source=google, utm_medium=cpc, utm_campaign=brand_keywords, utm_content=headline_test_a. The exact structure matters less than using it consistently across every single ad you run.
When someone converts, these UTM parameters get captured with their information. When they enter your CRM, the UTM data comes with them. Now you can trace that lead back to the specific ad that generated it.
Next, integrate your CRM with your tracking system. Most modern CRMs (HubSpot, Salesforce, Pipedrive, Close) offer native integrations or API access that lets attribution platforms pull data automatically. This connection enables you to see the complete picture: ad spend from your platforms, lead data from your CRM, and revenue from closed deals—all in one place. Explore marketing attribution platforms for revenue tracking to find the right solution.
The integration should capture key milestones: when a lead enters your CRM, when they become a qualified opportunity, when they close as a customer, and what revenue they generate. With this data connected, you can finally calculate true ROAS—not based on platform-reported conversions, but on actual revenue attributed to specific campaigns.
This is where most marketers discover their biggest surprises. The campaign with the highest platform-reported ROAS might generate low-quality leads that never close. Meanwhile, that expensive awareness campaign you almost cut might be introducing prospects who convert weeks later through other channels. You can't see these patterns until your ad data connects to your revenue data.
Step 4: Implement Multi-Touch Attribution to See the Full Picture
Last-click attribution is the default model for most ad platforms—whoever got the final click before conversion gets all the credit. It's simple, but it's also deeply misleading for any business with a multi-touch customer journey.
Think about how people actually buy. Someone sees your Meta ad introducing your product. Days later, they search your brand name on Google and click your ad. A week after that, they see your LinkedIn ad, click through, and finally convert. Last-click attribution gives LinkedIn 100% of the credit. Meta and Google, which introduced the prospect and kept them engaged, get nothing.
This creates perverse incentives. You'll overinvest in bottom-of-funnel brand campaigns that capture demand you've already created, and you'll underinvest in awareness campaigns that generate that demand in the first place. Your optimization decisions become systematically biased toward the last touchpoint.
Multi-touch attribution solves this by distributing credit across all the touchpoints in a customer's journey. Different models distribute that credit in different ways, and choosing the right one depends on your business model and sales cycle. Our comprehensive guide on attribution modeling for paid ads breaks down each approach in detail.
First-touch attribution gives all credit to the first interaction. This works well if you want to understand which channels are best at generating brand awareness and introducing new prospects.
Linear attribution distributes credit evenly across all touchpoints. If someone had five interactions before converting, each gets 20% credit. This model values every interaction equally and works well for businesses where nurturing matters throughout the journey.
Time-decay attribution gives more credit to recent touchpoints. The first interaction might get 10% credit, while the last gets 40%. This reflects the reality that recent interactions often have more influence on the final decision.
Data-driven attribution uses machine learning to analyze thousands of customer journeys and determine which touchpoints actually influence conversions. It's the most sophisticated approach but requires substantial data volume to work accurately.
For most businesses with sales cycles longer than a few days, time-decay or data-driven attribution provides the most actionable insights. They recognize that awareness-stage campaigns matter while still acknowledging that bottom-funnel interactions drive the final conversion.
Once you've selected a model, run attribution comparisons to understand how credit shifts between channels. Pull a report showing the same conversion data under different attribution models. You'll often find that channels like display advertising and social media get significantly more credit under multi-touch models compared to last-click. This reveals where you've been systematically undervaluing certain campaigns. If you're running ads across multiple channels, learn about attribution tracking for multiple campaigns.
The goal isn't to find the "correct" attribution model—it's to choose one that aligns with your business reality and stick with it consistently. When you optimize based on multi-touch attribution, you'll make decisions that account for the entire customer journey, not just the final click.
Step 5: Build a Unified Dashboard for Cross-Platform Performance Analysis
You've got Meta Ads Manager open in one tab, Google Ads in another, TikTok Ads Manager in a third, and LinkedIn Campaign Manager in a fourth. Each platform shows different metrics, uses different terminology, and reports conversions differently. Comparing performance across platforms means exporting CSV files, building spreadsheets, and spending hours reconciling data that should be simple to analyze.
A unified dashboard consolidates all your platform data into a single view where you can compare performance apples-to-apples. Instead of switching between platforms to see which campaigns are working, you see everything in one place with consistent metrics and attribution logic. The right ad performance tracking software makes this consolidation seamless.
Start by identifying the key metrics you need to see across all platforms. At minimum, this should include ad spend, impressions, clicks, click-through rate, conversions, cost per conversion, and ROAS. For each metric, you want both platform-reported values and attributed values based on your multi-touch attribution model. This comparison reveals where platforms are overcounting.
Create comparison reports that surface your highest and lowest performers. Which campaigns have the best ROAS? Which have the worst? Which channels drive the most revenue? Sort by attributed conversions rather than platform-reported conversions to see true performance. You'll often discover that your most profitable campaigns aren't the ones platforms highlight in their dashboards.
Set up automated alerts for campaigns that need attention. If a campaign exceeds your target cost per acquisition by 25%, you should know immediately—not days later when you check your dashboard. If ROAS drops below your profitability threshold, pause the campaign automatically or get notified to review it. These alerts prevent budget waste by catching underperformers before they drain significant spend.
Schedule a weekly review cadence to analyze performance trends. Pick the same day and time each week to review your dashboard. Look for campaigns that are trending up or down. Identify patterns: do certain ad creatives perform better on specific days? Do some audiences respond better to different offers? Weekly reviews turn data into actionable insights. Using paid ads analytics tools helps automate much of this analysis.
The unified dashboard should also show your funnel metrics—not just ad performance, but how those clicks turn into leads, opportunities, and customers. When you can see that Channel A drives cheaper clicks but lower conversion rates while Channel B costs more but generates higher-quality leads, you make smarter allocation decisions.
This consolidated view transforms how you optimize. Instead of optimizing each platform in isolation, you optimize your entire paid ads strategy holistically. You can shift budget from underperforming channels to top performers in real time, based on data that reflects actual business outcomes rather than platform-reported vanity metrics.
Step 6: Feed Accurate Conversion Data Back to Ad Platforms
Here's what most marketers miss: ad platform algorithms optimize based on the conversion data you send them. If you're only sending browser-based pixel data with 60% accuracy, the algorithms are learning from incomplete information. They'll optimize toward patterns that might not reflect your actual best customers.
Conversion APIs let you send enriched, verified conversion events from your server back to ad platforms. This isn't just about tracking accuracy—it's about improving campaign performance. When platforms receive better data, their algorithms make better optimization decisions.
Set up conversion API connections for each platform you advertise on. Meta's Conversions API, Google's Enhanced Conversions, TikTok's Events API, and LinkedIn's Conversion API all work similarly. They accept server-side event data with rich user identifiers and conversion details that browser pixels can't capture. If you're running Meta campaigns, learn how to improve Facebook Ads performance with better data.
The key is enriching your conversion events with as much information as possible. Include email addresses, phone numbers, and other identifiers that help platforms match conversions to user accounts. Send revenue values with purchase events so platforms can optimize for value, not just conversion volume. Include product categories, order IDs, and custom parameters that help you analyze performance later.
When you send a purchase event, don't just tell the platform "a conversion happened." Tell them "Jane Smith purchased $347 worth of Product Category B, Order ID 12345, at 2:34 PM." This enriched data helps platforms understand which audiences and ad creatives drive the most valuable conversions.
Monitor your match rates and data quality scores in each platform's events manager. Meta shows Event Match Quality scores for each conversion event. Google displays Enhanced Conversions match rates. These scores tell you what percentage of your conversion events successfully matched to user accounts on their platforms. Higher match rates mean better attribution and more effective optimization. If you're experiencing issues, our guide on Google Ads conversion tracking problems can help troubleshoot.
If your match rates are low, you're likely missing key identifiers. Check that you're hashing email addresses and phone numbers correctly before sending them. Verify that you're including all available user data with each event. Even small improvements in match rates translate to better campaign performance because algorithms have more accurate data to learn from.
This creates a powerful feedback loop. Your server-side tracking captures conversions browsers miss. You send those conversions back to platforms with enriched data. Platforms optimize toward your actual best customers. Your campaigns perform better. You generate more revenue. The cycle continues.
Many marketers focus exclusively on tracking accuracy for reporting purposes. That matters, but feeding better data back to platforms might be even more valuable. When Meta's algorithm knows which specific ad creative drove a $500 purchase from a high-value customer, it can find more people like that customer and show them similar creative. That's optimization gold.
Putting It All Together: Your Paid Ads Tracking Checklist
With these six steps complete, you now have a tracking system that shows exactly which ads drive revenue—not just clicks. You've moved beyond platform-reported metrics that inflate results and hide the truth about campaign performance.
Quick checklist to verify your setup:
□ Key metrics defined and baselined—you know what success looks like and where you're starting from
□ Server-side tracking capturing browser-blocked conversions—you're seeing the 30-40% of conversions that browser pixels miss
□ CRM connected to ad platforms with consistent UTM structure—you can trace revenue back to specific campaigns
□ Multi-touch attribution model selected and configured—you're crediting all the touchpoints that influence conversions, not just the last click
□ Unified dashboard showing cross-platform performance—you can compare campaigns apples-to-apples in one place
□ Conversion data flowing back to ad platforms for optimization—algorithms are learning from accurate, enriched data
The marketers who scale profitably aren't spending more—they're tracking better. When you can see exactly which campaigns generate revenue, you can confidently cut waste and double down on winners. You'll stop guessing which platforms deserve more budget and start making decisions based on data that reflects business reality.
This tracking infrastructure isn't just about measurement. It's about confidence. Confidence to test new channels knowing you'll see their true impact. Confidence to defend your budget when executives question ad spend. Confidence to scale winners aggressively because you know they're actually working.
Start with Step 1 today. Define your key metrics, establish your baselines, and begin building the foundation for accurate tracking. Within a week, you'll have visibility that most of your competitors lack. Within a month, you'll be optimizing based on revenue data while they're still chasing platform-reported vanity metrics.
Ready to elevate your marketing game with precision and confidence? Discover how Cometly's AI-driven recommendations can transform your ad strategy—Get your free demo today and start capturing every touchpoint to maximize your conversions.


