
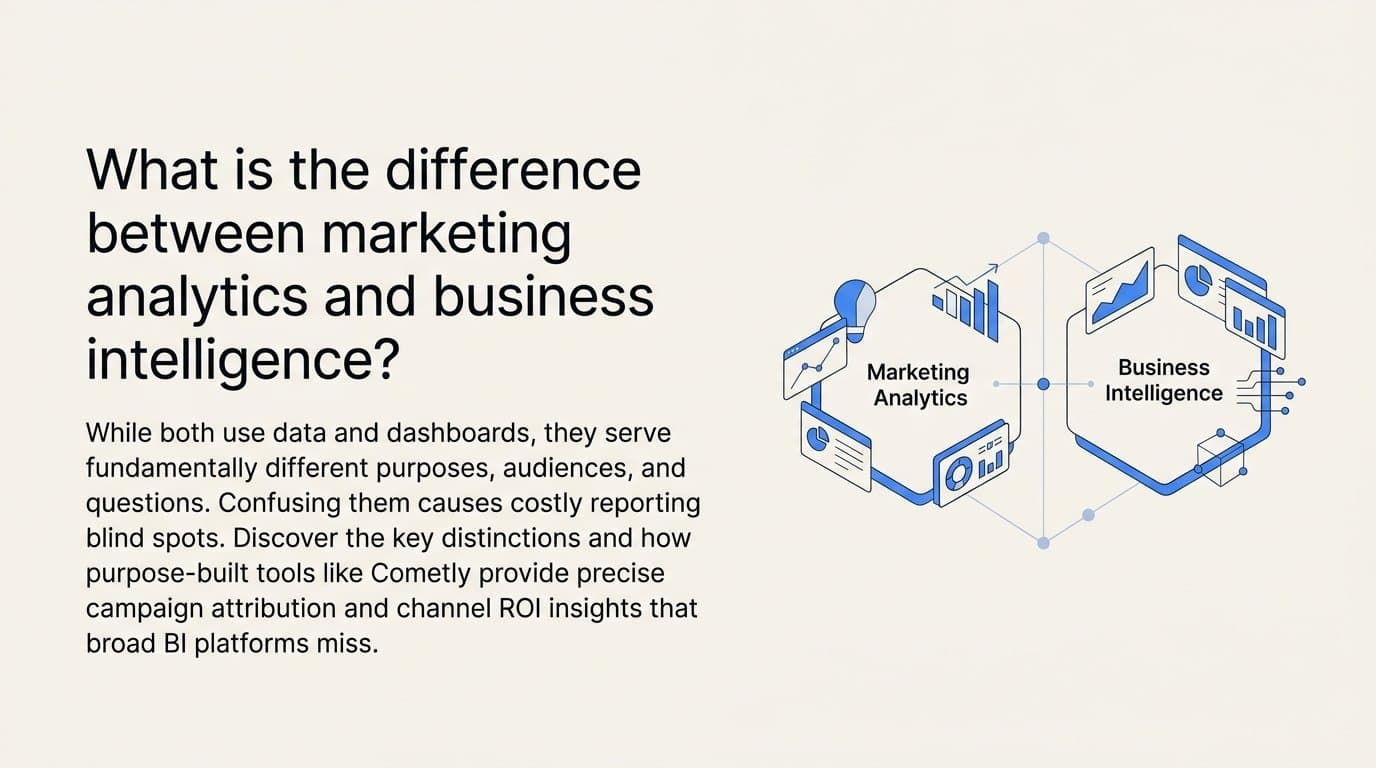
Marketing analytics focuses on measuring and optimizing marketing activities: ad performance, channel attribution, campaign ROI, and conversion tracking. Business intelligence is a broader discipline that pulls data from across the entire organization, including finance, operations, sales, and product, to support strategic decision-making at the executive level.
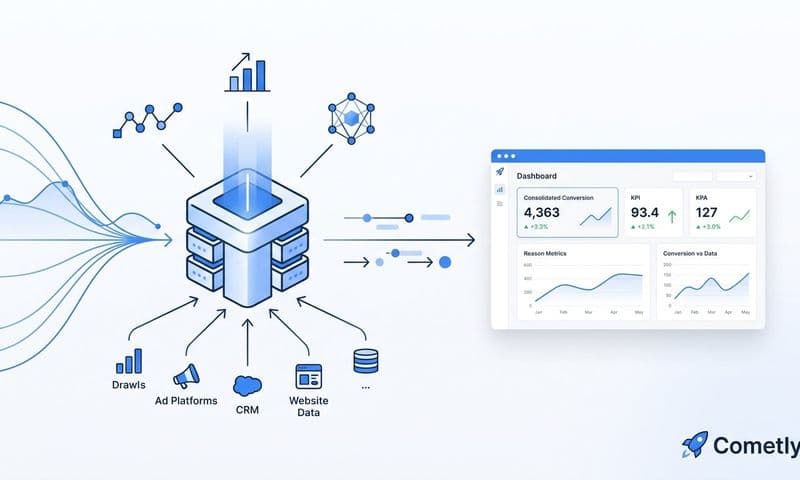
Cometly is built specifically for marketing analytics. It connects your ad platforms and CRM data to show exactly which campaigns, channels, and ads are driving pipeline and revenue, without requiring a data engineering team to get it running.
The reason these two terms get confused so often comes down to surface-level similarities. Both involve dashboards. Both work with data. Both help organizations make better decisions. But they operate at completely different scopes, serve different audiences, and answer fundamentally different questions. Choosing the wrong tool for the job creates real blind spots, whether that means a marketing team trying to run attribution inside a BI platform or an executive team trying to do company-wide reporting inside a campaign tool. Understanding the distinction helps you build the right stack for the right job.
How Marketing Analytics and Business Intelligence Actually Differ
The clearest way to separate these two categories is by asking: what questions is this tool designed to answer?
Marketing analytics is scoped entirely to marketing data. That means ad spend, impressions, clicks, conversions, attribution models, cost per lead, and campaign ROI. When a paid media manager asks "which channel drove this lead?" or "what is my cost per acquisition on Meta versus Google this month?", they need a marketing analytics tool. The data sources are ad platforms, CRM systems, website events, and server-side conversion signals. The time horizon is days to weeks, not quarters.
Business intelligence operates at the organizational level. A BI platform pulls from finance systems, product databases, operational tools, HR data, and yes, sometimes marketing data too. It answers questions like "how is the company performing this quarter?" or "what is our projected revenue if we expand into this new segment?" These are strategic questions that require combining data from multiple departments into a unified model. The audience is typically data analysts, finance teams, and executive leadership, not the growth marketer optimizing a LinkedIn campaign.
The core distinction comes down to scope and audience.
Scope: Marketing analytics is channel-specific and campaign-level. BI is company-wide and business-unit-level. A BI tool that includes marketing data is still a BI tool. A marketing analytics platform that shows revenue attribution is still a marketing analytics platform. The architecture and design intent are fundamentally different.
Audience: Marketing analytics tools are designed for marketing operators who need fast, self-serve answers about what is working in their campaigns. BI platforms are designed for data teams and analysts who build models and dashboards for executive stakeholders. The user experience reflects this. Marketing analytics tools typically have pre-built integrations with ad platforms and CRMs, and they surface campaign-level metrics without requiring SQL. BI tools are flexible and powerful, but they require someone who knows how to build the data pipelines and queries first.
Speed to insight: This is where the practical difference becomes most visible. A marketing analytics platform is designed for a marketer to log in on a Tuesday morning and immediately see which ads drove conversions yesterday. A BI tool requires data to be modeled, pipelines to be maintained, and dashboards to be built by an analyst, often days or weeks before the marketer ever sees the output.
Neither category is better than the other. They solve different problems. The mistake is treating them as interchangeable.
What Marketing Analytics Tools Are Built to Do
Marketing analytics platforms are purpose-built to track the customer journey from the first ad click through to a closed deal. That journey spans multiple touchpoints: a prospect might see a LinkedIn ad, click a Google search result three days later, open an email, and then book a demo through a retargeting ad on Meta. Understanding which of those interactions actually drove the conversion is the core problem that marketing analytics software solves.
Multi-touch attribution models are central to this. First-touch attribution gives full credit to the first interaction. Last-click gives full credit to the final touchpoint before conversion. Linear attribution distributes credit evenly across all touchpoints. Data-driven attribution uses machine learning to assign credit based on actual conversion patterns. Each model tells a different story, and marketing analytics platforms let you compare them so you can make informed decisions about where to invest your budget.
Modern marketing analytics tools have also had to evolve in response to cookie deprecation. As third-party cookies become less reliable, browser-based pixels capture less conversion data. Server-side tracking and Conversion API integrations have become essential features. Meta's Conversion API (CAPI) and Google's Enhanced Conversions allow platforms to receive conversion signals directly from your server rather than relying on a browser pixel that a user might have blocked or that gets dropped by iOS privacy restrictions. This means more complete data and better ad platform optimization.
Cometly is a dedicated marketing analytics platform built specifically for B2B SaaS marketing teams. It connects ad platforms including Meta, Google, and LinkedIn, with CRM data and website events to give teams a single view of which ads and channels are driving leads, pipeline, and revenue. The platform includes multi-touch attribution models built in, server-side tracking, and Conversion API integration. It also connects to Stripe so you can tie ad spend directly to closed revenue, not just leads or trials. AI-powered recommendations surface which campaigns are performing and which are wasting budget. With over 70 native integrations, it is designed to be operational without a data engineering team.
Other dedicated marketing analytics platforms worth knowing include Ruler Analytics, which focuses on call and form tracking alongside digital attribution, and Rockerbox, which is built for multi-channel attribution across both digital and offline channels. Triple Whale is popular in the ecommerce space but is not designed for B2B SaaS use cases.
The common thread across all of these tools is that they are designed for marketers to use directly, with pre-built connections to the platforms where marketing actually happens.
What Business Intelligence Platforms Are Built to Do
BI platforms like Tableau, Looker, and Microsoft Power BI are designed to connect to data warehouses and multiple internal systems, then let analysts build custom dashboards and reports across the entire business. They are extraordinarily flexible, which is also why they require significant setup and ongoing maintenance.
To get marketing data into a BI tool, you typically need a data pipeline that extracts data from your ad platforms and CRM, loads it into a warehouse like BigQuery or Snowflake, and then models it in a way the BI tool can query. That process requires data engineers or analytics engineers who know how to write SQL, manage pipelines, and maintain the models as source systems change. For organizations with those resources, BI tools are powerful. For marketing teams without a dedicated data team, they create bottlenecks.
Where BI tools genuinely excel is in historical trend analysis, executive reporting, and cross-departmental data modeling. If a CFO needs to see marketing spend alongside sales pipeline, product usage data, and customer churn in a single quarterly business review dashboard, a BI tool is the right layer for that. It can combine data from systems that a marketing analytics platform would never touch, like your ERP, your product database, or your support ticket system.
The trade-off for marketing use cases is time to insight. Getting a marketing-specific report built in a BI tool typically requires submitting a request to a data team, waiting for the pipeline to be built, reviewing the output, and iterating. That process can take days or weeks. For a marketing team that needs to decide whether to shift budget from one campaign to another based on yesterday's performance, that timeline is simply too slow.
BI tools also do not natively run multi-touch attribution models. They can display attribution data if it has been pre-computed and loaded into the warehouse, but they do not have built-in logic for first-touch, linear, or data-driven attribution across ad platform touchpoints. That capability lives in purpose-built marketing analytics software.
When to Use Marketing Analytics vs. Business Intelligence
The decision between these two tool categories comes down to the type of question you are trying to answer and how quickly you need the answer.
Use marketing analytics when you need to optimize active campaigns. If you are trying to compare cost per lead across Meta, Google, and LinkedIn, understand which creative is driving the most pipeline, track attribution across a multi-touch B2B buying journey, or figure out which ad drove a specific closed deal, you need a marketing analytics platform. These are operational decisions that require real-time or near-real-time data. Waiting two weeks for an analyst to build a report is not compatible with running paid campaigns at any meaningful scale.
Use business intelligence when you need to report on company-wide performance. If you are preparing a quarterly business review that shows how marketing investment maps to overall revenue growth, or if you need to model how a budget reallocation across departments would affect projected outcomes, a BI tool is the right layer. These are strategic planning questions that benefit from combining marketing data with finance, product, and sales data in a unified model.
Many B2B SaaS companies use both, and that is not redundancy. It is the right architecture. The marketing team uses a dedicated attribution platform like Cometly for day-to-day and week-to-week campaign decisions. That data, along with data from other departments, flows into a BI tool like Looker or Tableau for quarterly business reviews and executive reporting. The two tools serve different audiences on different timelines.
The mistake to avoid is trying to force one tool to do both jobs. Using a BI tool for daily campaign optimization creates a dependency on your data team for every marketing decision. Using a marketing analytics platform as your company-wide reporting layer means your CFO is looking at an incomplete picture. Both scenarios create blind spots that affect the quality of decisions being made.
Related Questions Marketers Ask About This Topic
Is Google Analytics a marketing analytics tool or a BI tool?
Google Analytics is a marketing analytics tool focused on website and campaign performance. It tracks sessions, traffic sources, conversion events, and user behavior on your website. It is not a full BI platform, though it can export data into BI systems or data warehouses for broader analysis. Non-technical users sometimes call it a BI tool because it has dashboards and reports, but it does not connect to finance systems, run cross-departmental models, or support the kind of custom SQL-based analysis that defines a BI platform.
Can a BI tool replace marketing attribution software?
No. BI tools can display attribution data, but they do not natively track ad clicks, integrate directly with Conversion APIs, or run multi-touch attribution models without significant custom development. Building a functioning attribution model inside a BI tool requires a data engineer to construct the pipeline, write the attribution logic in SQL, and maintain it as ad platform APIs change. A purpose-built marketing analytics platform handles all of that out of the box. For most marketing teams, the time and engineering cost of replicating attribution functionality in a BI tool far exceeds the cost of using dedicated software.
What data sources does marketing analytics use versus BI?
Marketing analytics platforms connect directly to ad platforms like Meta, Google Ads, and LinkedIn, as well as CRM systems, website event tracking, and server-side conversion data via APIs like Meta CAPI and Google Enhanced Conversions. BI tools connect to those same sources plus finance systems, product databases, operational data warehouses, HR platforms, and any other internal system that can be piped into a data warehouse. The overlap is in marketing data, but BI tools go much further across the organization.
Do B2B SaaS companies need both marketing analytics and BI?
Yes, for different use cases. Marketing teams need a dedicated attribution tool to optimize campaigns, track cost per lead by channel, and understand which ads are driving pipeline. Leadership teams need a BI layer to see how marketing fits into overall business performance alongside sales, product, and finance data. As a B2B SaaS company grows, the need for both becomes more pronounced. Early-stage teams might start with just a marketing analytics platform, but as the organization matures and data complexity increases, a BI layer becomes necessary for strategic reporting.
Choosing the Right Tool for Your Marketing Team
If your primary need is understanding which ads and channels drive pipeline and revenue, start with a dedicated marketing analytics platform. Tools like Cometly and Ruler Analytics are purpose-built for this use case. They connect directly to your ad platforms and CRM, include multi-touch attribution models, and are designed for marketers to use without needing a data engineering team. You can be operational in days, not months.
Cometly specifically is built for B2B SaaS marketing teams that want to connect ad spend directly to closed revenue. It handles server-side tracking, Conversion API integration, and pipeline attribution tied to Stripe, so you can see the full journey from ad click to closed deal. The AI-powered recommendations surface which campaigns and creatives are performing so you can scale with confidence rather than guessing.
If your organization needs cross-functional reporting that combines marketing with sales, finance, and product data, a BI platform like Looker, Tableau, or Power BI is the appropriate layer. Plan for the data engineering investment required to make it useful. A BI tool without properly modeled data pipelines is just an empty dashboard.
The most effective setup for growing B2B SaaS companies is a marketing analytics platform handling real-time attribution and campaign optimization, with that data eventually flowing into a BI tool for broader business reporting as the team and data infrastructure mature. Start with the tool that solves your most immediate problem, which for most marketing teams is knowing what is actually driving results from their ad spend.