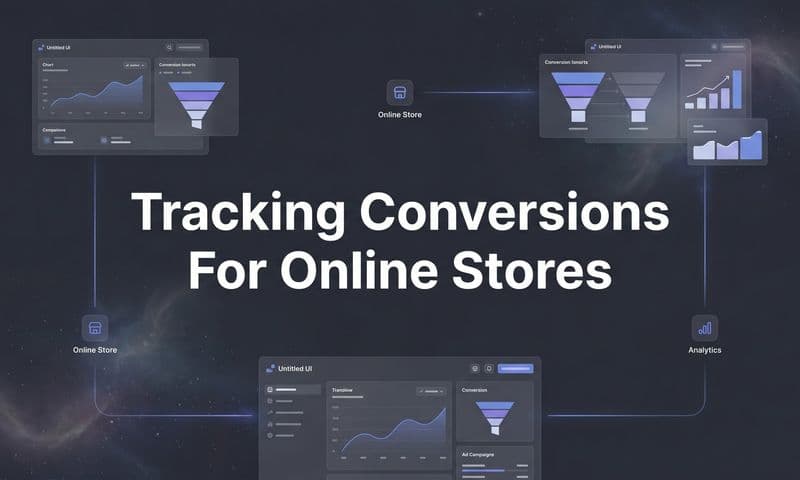
You're spending $10,000 a month on ads. Leads are coming in. Your sales team is having conversations. Then three months later, a $30,000 deal closes. But here's the question that keeps you up at night: which campaign actually drove that sale?
If you're marketing high ticket products or services—whether that's enterprise software, consulting packages, luxury services, or B2B solutions—you're facing a tracking nightmare that standard analytics tools simply weren't built to solve. Your prospects don't click an ad and buy. They research for weeks. They attend webinars. They have multiple sales calls. They involve other decision-makers. And somewhere in that 60-to-180-day journey, they finally convert.
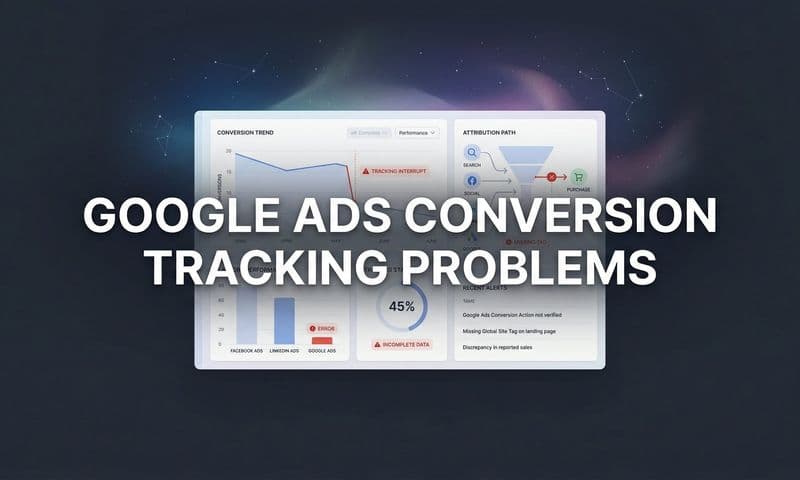
Meanwhile, your Facebook Ads Manager is celebrating that lead you got yesterday while completely ignoring the $50,000 client who first clicked your ad four months ago. Google Analytics lost track of your prospect when they switched from their phone to their laptop. And your attribution reports? They're essentially fiction, crediting conversions to whatever touchpoint happened to fall within an arbitrary 28-day window.
This isn't just frustrating—it's expensive. Without accurate conversion tracking, you're scaling blind. You're killing campaigns that actually drive revenue. You're doubling down on channels that generate leads but never close deals. And you're making budget decisions based on incomplete data that bears little resemblance to reality.
This guide will show you exactly how to build a conversion tracking system that actually works for high ticket sales. We'll cover the infrastructure you need, the attribution models that make sense for extended sales cycles, and the specific tactics that connect your marketing spend to actual closed revenue. Because when deals take months to close and involve multiple touchpoints, you need a fundamentally different approach to measurement.
The Attribution Window Trap: When Your Best Campaigns Get Zero Credit
Here's the fundamental problem: most ad platforms operate on attribution windows of 7 to 28 days. Facebook's default is 7 days. Google Ads typically uses 30 days. These windows were designed for e-commerce, where someone clicks an ad and buys within hours or days.
But your sales cycle doesn't fit that model. Your prospect clicks a LinkedIn ad on January 15th. They download your guide. They attend your webinar in February. They have discovery calls in March. And they finally sign a $40,000 contract on April 20th—95 days after that initial click.
What does LinkedIn's attribution report show? Nothing. That original ad gets zero credit because the conversion happened far outside the attribution window. According to your ad platform, that campaign is a complete waste of money. In reality, it was the beginning of a highly profitable customer journey.
This attribution window problem gets worse when you consider how high ticket buyers actually behave. They're not impulse purchasing. They're conducting serious research. They're comparing multiple vendors. They're building internal business cases. This process naturally extends beyond any standard tracking window.
The result? Your performance data is systematically biased toward bottom-of-funnel activities that happen close to conversion while completely undervaluing the top-of-funnel campaigns that started the entire relationship. You end up cutting awareness budgets that were actually your most profitable investments—you just couldn't see it in the data.
Then there's the multi-touch complexity. A prospect researching a high ticket purchase might interact with your brand 20 or 30 times before converting. They see your Facebook ad. They visit your website organically. They watch YouTube videos. They read case studies. They attend a webinar. They engage with your email sequence. They have multiple sales calls.
Standard tracking tools try to simplify this complexity by using last-click attribution—giving all the credit to whatever touchpoint happened right before conversion. But this approach is useless for understanding what actually drives high ticket sales. That final sales call gets 100% of the credit while the paid ad that started the journey six weeks ago is treated as irrelevant.
Cookie deprecation and cross-device tracking failures compound these issues. iOS privacy changes have already made it harder to track mobile users. Third-party cookie restrictions continue to tighten. And high ticket prospects routinely switch devices throughout their journey—clicking your ad on their phone during their commute, researching on their work laptop, and finally converting on a different browser weeks later.
Each device switch creates a tracking gap. Each session break potentially starts a new "user" in your analytics. The continuous customer journey that actually happened gets fragmented into disconnected sessions that your tracking tools can't reconcile. You're trying to measure a months-long relationship using tools designed for same-day transactions.
Building the Infrastructure: From Anonymous Clicks to Closed Revenue
Tracking high ticket conversions requires infrastructure that connects three critical systems: your ad platforms, your website, and your CRM. Most marketers only have the first two pieces working—and even those are unreliable.
Server-side tracking solves the reliability problem that's plaguing client-side pixel tracking. When you rely solely on browser pixels, you're at the mercy of ad blockers, cookie restrictions, and browser privacy settings. Studies show that browser-based tracking now misses 30-40% of actual conversions due to these limitations.
Server-side tracking operates differently. Instead of relying on a prospect's browser to send data to ad platforms, your server communicates directly with those platforms. When someone fills out a form on your website, your server captures that data and sends it to Facebook, Google, and other platforms—regardless of whether the user has cookies enabled or ad blockers running.
This approach maintains tracking continuity throughout the entire customer journey. That prospect who clicked your ad on their iPhone but converted on their work laptop three weeks later? Server-side tracking can connect those sessions by matching identifying information like email addresses, phone numbers, or internal user IDs—data that client-side tracking often can't access. Understanding cross-device conversion tracking methods is essential for maintaining this continuity.
But capturing the initial conversion is only the first step. The real value happens in your CRM, where leads become opportunities, opportunities move through pipeline stages, and deals eventually close with specific revenue values attached. This is where the actual conversion happens for high ticket sales—not on your website.
CRM integration transforms your tracking from measuring leads to measuring revenue. When you sync your CRM data back to your marketing analytics, you can see which campaigns generated leads that actually closed. You can calculate true customer acquisition cost by channel. You can identify which traffic sources produce the highest deal values and fastest close rates.
The technical implementation requires bidirectional data flow. Marketing data (source, campaign, ad, keyword) needs to flow into your CRM and attach to every lead record. Then CRM data (deal stage, revenue value, close date) needs to flow back to your analytics platform. This creates a complete loop from first click to closed revenue.
Building a unified customer journey view means matching anonymous website visitors to known leads to closed customers across all channels. When someone first visits your site, they're anonymous. When they fill out a form, they become a known lead. When they enter your CRM, they become an opportunity. When they close, they become a customer.
Your tracking system needs to maintain identity continuity throughout this progression. That means using consistent identifiers (email addresses, phone numbers, CRM IDs) to connect the dots. It means enriching each touchpoint with the full context of previous interactions. And it means building a timeline that shows every ad click, website visit, content download, and sales interaction in chronological order.
This unified view reveals patterns that fragmented data obscures. You might discover that prospects who engage with specific content pieces close 3x faster. Or that certain ad campaigns consistently produce higher deal values even though they generate fewer total leads. These insights only become visible when you can see the complete journey from first touch to closed revenue.
Attribution Models That Actually Work for Extended Sales Cycles
When a high ticket sale involves 20+ touchpoints over 90+ days, how do you fairly distribute credit? This is where attribution modeling becomes critical—and where most marketers get it wrong by using models designed for simple, short-cycle conversions.
First-touch attribution gives all credit to the initial interaction. This model makes sense if you believe that getting someone's attention is the hardest part. For high ticket sales, first-touch attribution tends to favor awareness campaigns and top-of-funnel content. It answers the question: "What made this prospect aware of us in the first place?"
Last-touch attribution does the opposite—giving all credit to the final touchpoint before conversion. This model favors bottom-of-funnel activities like sales calls, demos, and proposal reviews. It answers: "What finally convinced this prospect to buy?"
Both models tell incomplete stories. The reality is that high ticket conversions require both awareness and closing activities. The LinkedIn ad that started the relationship matters. So does the case study they read before signing. So does the webinar that educated them about your solution. Giving 100% credit to any single touchpoint ignores the multi-touch reality of complex sales.
Linear attribution distributes credit equally across all touchpoints. If there were 15 interactions before conversion, each gets 6.67% of the credit. This model assumes every touchpoint contributed equally to the sale. While this feels fair, it probably undervalues the touchpoints that actually moved the needle while overvaluing passive interactions.
Time-decay attribution gives more credit to touchpoints closer to conversion. The logic is that recent interactions had more influence on the decision than things that happened months ago. For high ticket sales with long consideration periods, this model often makes intuitive sense—the webinar they attended last week probably influenced their decision more than the blog post they read three months ago.
Position-based attribution (also called U-shaped) gives the most credit to first and last touch (typically 40% each) and distributes the remaining 20% across middle touchpoints. This model acknowledges that getting someone's attention and closing the deal are both critical, while still recognizing that middle-funnel nurturing played a role. Learn more about attribution for high ticket sales to determine which model fits your business.
Which model should you use? The answer depends on your sales process and what you're trying to optimize. Many high ticket marketers find that time-decay or position-based models provide the most actionable insights because they acknowledge the importance of multiple touchpoints while recognizing that not all interactions are equally valuable.
The more important decision is setting attribution windows that match your actual sales cycle. If your average time-to-close is 120 days, using a 28-day attribution window is pointless. You need to extend that window to at least 180 days—preferably longer—to capture the full journey.
Custom attribution windows let you analyze performance based on when conversions actually happen, not when ad platforms arbitrarily stop tracking. This means accepting that you won't see complete performance data for new campaigns until enough time has passed for deals to close. A campaign you launched last month might look mediocre today but could prove highly profitable once those leads work through your pipeline over the next 90 days.
Practical implementation means running multiple attribution models simultaneously. Look at first-touch to understand which campaigns are best at generating awareness. Look at last-touch to see what's actually closing deals. Look at time-decay or position-based for a more balanced view. Then make budget decisions based on the full picture, not any single model.
Teaching Ad Platforms What a Valuable Conversion Actually Looks Like
Here's a problem most high ticket marketers don't realize they have: their ad platforms are optimizing for the wrong goal. Facebook's algorithm thinks a good conversion is any lead. Google's algorithm celebrates every form submission equally. But you know that not all leads are created equal.
Some leads become $50,000 customers. Others never respond to follow-up. Some close in 30 days. Others take six months. Some come from qualified decision-makers. Others are tire-kickers who'll never buy. Your ad platforms can't tell the difference—unless you teach them.
This is where conversion sync becomes critical. Also called offline conversion tracking or Conversion API, this approach sends data from your CRM back to your ad platforms. When a lead closes as a customer, that information gets sent to Facebook, Google, or LinkedIn along with the revenue value and any other relevant data.
Why does this matter? Because ad platform algorithms learn from conversion data. When you only send lead data, the algorithm optimizes for lead volume. It finds more people who look like the people who filled out forms—regardless of whether those people actually buy. When you send closed-won deal data with revenue values, the algorithm can optimize for customers who actually generate revenue.
The feedback loop works like this: A prospect clicks your Facebook ad and becomes a lead. That lead enters your CRM. Over the next 90 days, they move through your sales pipeline. They eventually close as a $30,000 customer. Your conversion sync setup sends that closed-won event back to Facebook with the revenue value attached.
Facebook's algorithm now knows that this specific lead—who had certain characteristics, interests, and behaviors—became a high-value customer. It can use that information to find more prospects who match that profile. Over time, as you send more closed-won data, the algorithm gets better at distinguishing between leads who will buy and leads who won't.
Implementation requires technical setup but the payoff is substantial. You need to configure your CRM to trigger events when deals reach certain stages (qualified opportunity, closed-won) and send those events to ad platforms via their respective APIs. Most modern marketing attribution platforms with revenue tracking handle this automatically once you've connected your systems.
The strategic shift is moving from cost-per-lead to cost-per-qualified-opportunity or cost-per-customer metrics. Instead of celebrating that you generated 100 leads at $50 each, you analyze how many of those leads became qualified opportunities, how many closed, and what your actual customer acquisition cost was by channel.
This reveals dramatically different performance pictures. You might discover that LinkedIn generates fewer leads than Facebook but those leads close at 3x the rate with 2x the deal value. Your cost-per-lead on LinkedIn is higher, but your cost-per-customer is actually lower. Without revenue-based optimization, you'd never see this—you'd just keep scaling Facebook because it has the lowest cost-per-lead.
Optimizing for pipeline value instead of lead volume means bidding strategies change too. You can use value-based bidding to tell ad platforms that you're willing to pay more for leads that are likely to become high-value customers. You can create lookalike audiences based on closed customers rather than all leads. You can exclude audience segments that generate leads but never convert to revenue.
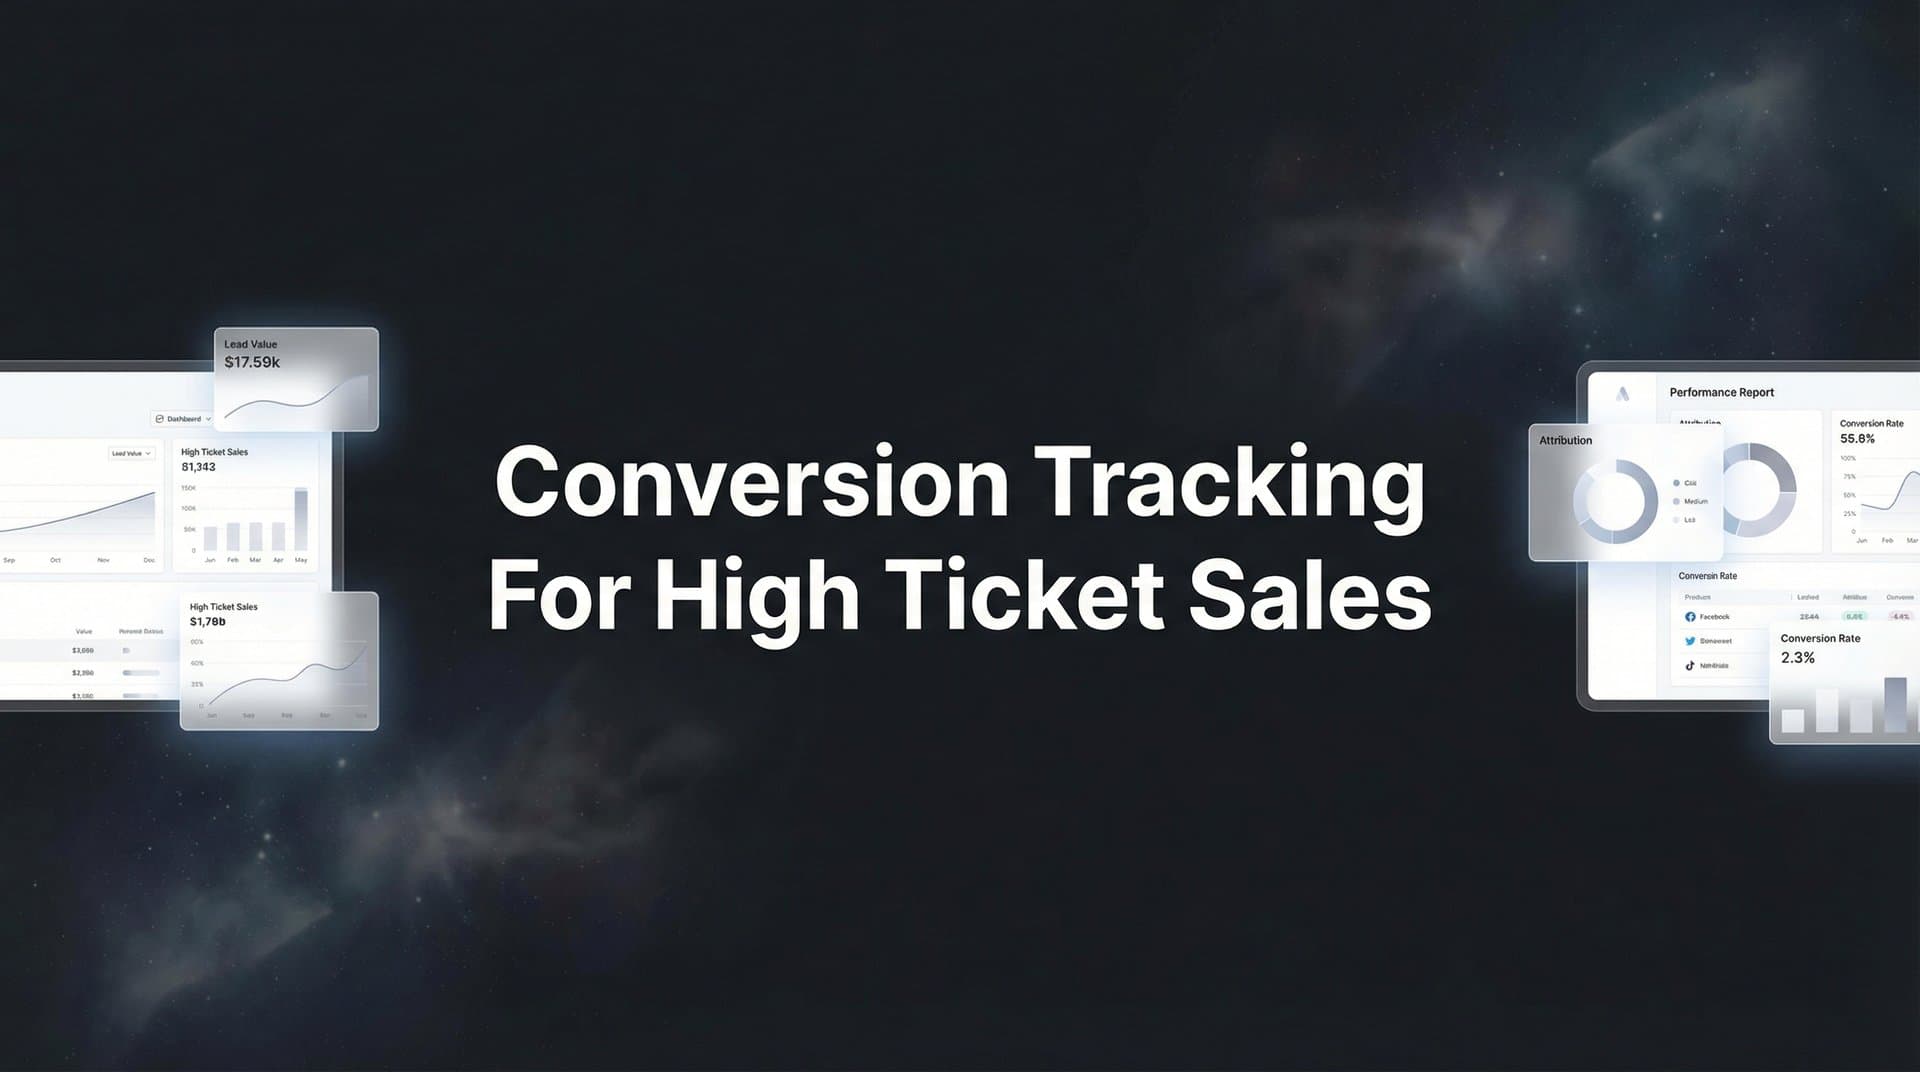
The Metrics That Actually Matter for High Ticket Sales
Return on ad spend is the metric everyone wants to see. But ROAS calculated on lead volume is meaningless for high ticket sales. A campaign with a 5:1 ROAS based on leads might actually have a 0.5:1 ROAS when you measure closed revenue. The leads came in, but they didn't convert.
Customer acquisition cost by deal size is far more revealing. Calculate your total marketing spend divided by the number of closed customers, then segment by deal size. You might find that acquiring a $10,000 customer costs $2,000 while acquiring a $50,000 customer costs $3,500. That second scenario is actually more profitable even though the CAC is higher.
Time-to-close by channel shows you which traffic sources produce the fastest-moving deals. Some channels might generate leads that close in 45 days. Others produce leads that take 120 days. If you need to hit revenue targets quickly, you know which channels to prioritize. If you're building long-term pipeline, slower channels might be fine.
Pipeline velocity metrics reveal how efficiently leads move through your sales process by source. Calculate the average time from lead to qualified opportunity, opportunity to proposal, and proposal to close—segmented by marketing channel. This shows you not just which channels generate leads, but which channels generate leads that actually progress.
Cohort analysis becomes essential when sales cycles extend beyond a month. Group leads by the month they were generated, then track their conversion rates over time. Your January cohort might show a 15% close rate after 90 days. Your February cohort might show 20%. This tells you whether your lead quality is improving—but you can only see it by analyzing cohorts, not overall conversion rates.
This approach also solves the waiting problem. You can't evaluate a campaign's true performance until enough time has passed for deals to close. Cohort analysis lets you compare apples to apples by looking at how different campaigns performed at the same point in their lifecycle. You can see that this month's campaign is tracking ahead of last month's campaign at the 30-day mark, even though neither has fully matured yet.
Revenue dashboards should connect marketing spend to actual closed revenue, not just pipeline generated. Track total ad spend by channel, closed revenue by channel, CAC by channel, and average deal value by channel. Layer in time-to-close data and conversion rates at each pipeline stage. This complete view shows you the actual return on your marketing investment.
Qualified opportunity rate matters more than lead volume. If Channel A generates 100 leads but only 10 become qualified opportunities, while Channel B generates 50 leads with 20 becoming qualified opportunities, Channel B is more valuable—even though it produced fewer total leads. Track what percentage of leads from each source actually enter your sales pipeline as real opportunities. Implementing conversion tracking for lead generation helps you measure these qualified opportunity rates accurately.
Win rate by source shows you which channels produce leads that actually close. Calculate the percentage of qualified opportunities that become closed-won deals, segmented by original marketing source. Some channels might produce leads with 40% win rates while others produce leads with 10% win rates. This dramatically changes how you think about channel value.
Customer lifetime value by acquisition channel reveals long-term profitability differences. Some channels might produce customers who stay longer, buy more, or refer others. Others might produce one-time buyers who churn quickly. Tracking LTV by channel helps you make smarter long-term investment decisions rather than optimizing purely for initial CAC.
Putting It All Together: Building a Tracking System That Scales
High ticket conversion tracking isn't just more complicated than e-commerce tracking—it's fundamentally different. The infrastructure requirements, attribution approaches, and success metrics all need to be designed for extended sales cycles, multiple decision-makers, and complex customer journeys that span months.
The foundation is server-side tracking that maintains data continuity regardless of browser restrictions, cookie policies, or device switches. This ensures you're capturing the full picture rather than the fragmented view that client-side tracking provides. Without this foundation, everything else is built on incomplete data.
CRM integration transforms tracking from measuring activity to measuring outcomes. Leads are just the beginning of the story. The real conversion happens when deals close and revenue is recognized. Connecting your CRM to your marketing analytics lets you see which campaigns actually drive revenue, not just which ones generate form submissions.
Extended attribution windows that match your actual sales cycle length are non-negotiable. If your deals take 90-180 days to close, your tracking windows need to extend at least that long—preferably longer. This means accepting delayed reporting and making peace with the fact that you won't know a campaign's true performance for months.
Multi-touch attribution models that acknowledge the complexity of high ticket sales provide more accurate insights than first-click or last-click approaches. Whether you use time-decay, position-based, or custom models, the key is recognizing that multiple touchpoints contribute to conversion and distributing credit accordingly. Mastering attribution tracking for multiple campaigns ensures you're capturing the full picture across all your marketing efforts.
Conversion sync closes the feedback loop by teaching ad platforms what valuable conversions actually look like. When you send closed-won deal data with revenue values back to Facebook, Google, and LinkedIn, their algorithms can optimize for customers who actually buy rather than just leads who fill out forms.
The metrics that matter focus on revenue outcomes rather than vanity metrics. Customer acquisition cost by deal size, time-to-close by channel, win rates by source, and cohort-based conversion analysis all provide more actionable insights than lead volume or cost-per-lead.
Building this infrastructure requires technical implementation, but the strategic payoff is substantial. You'll finally know which campaigns actually drive revenue. You'll stop wasting budget on channels that generate leads but never close deals. You'll scale with confidence because your decisions are based on complete data rather than fragments. Following best practices for tracking conversions accurately ensures your data remains reliable as you scale.
The difference between marketers who succeed with high ticket sales and those who struggle often comes down to measurement. When you can accurately track the full journey from first click to closed deal, you can make informed decisions about where to invest. When you're tracking blind, you're essentially gambling with your marketing budget.
Ready to elevate your marketing game with precision and confidence? Discover how Cometly's AI-driven recommendations can transform your ad strategy—Get your free demo today and start capturing every touchpoint to maximize your conversions.