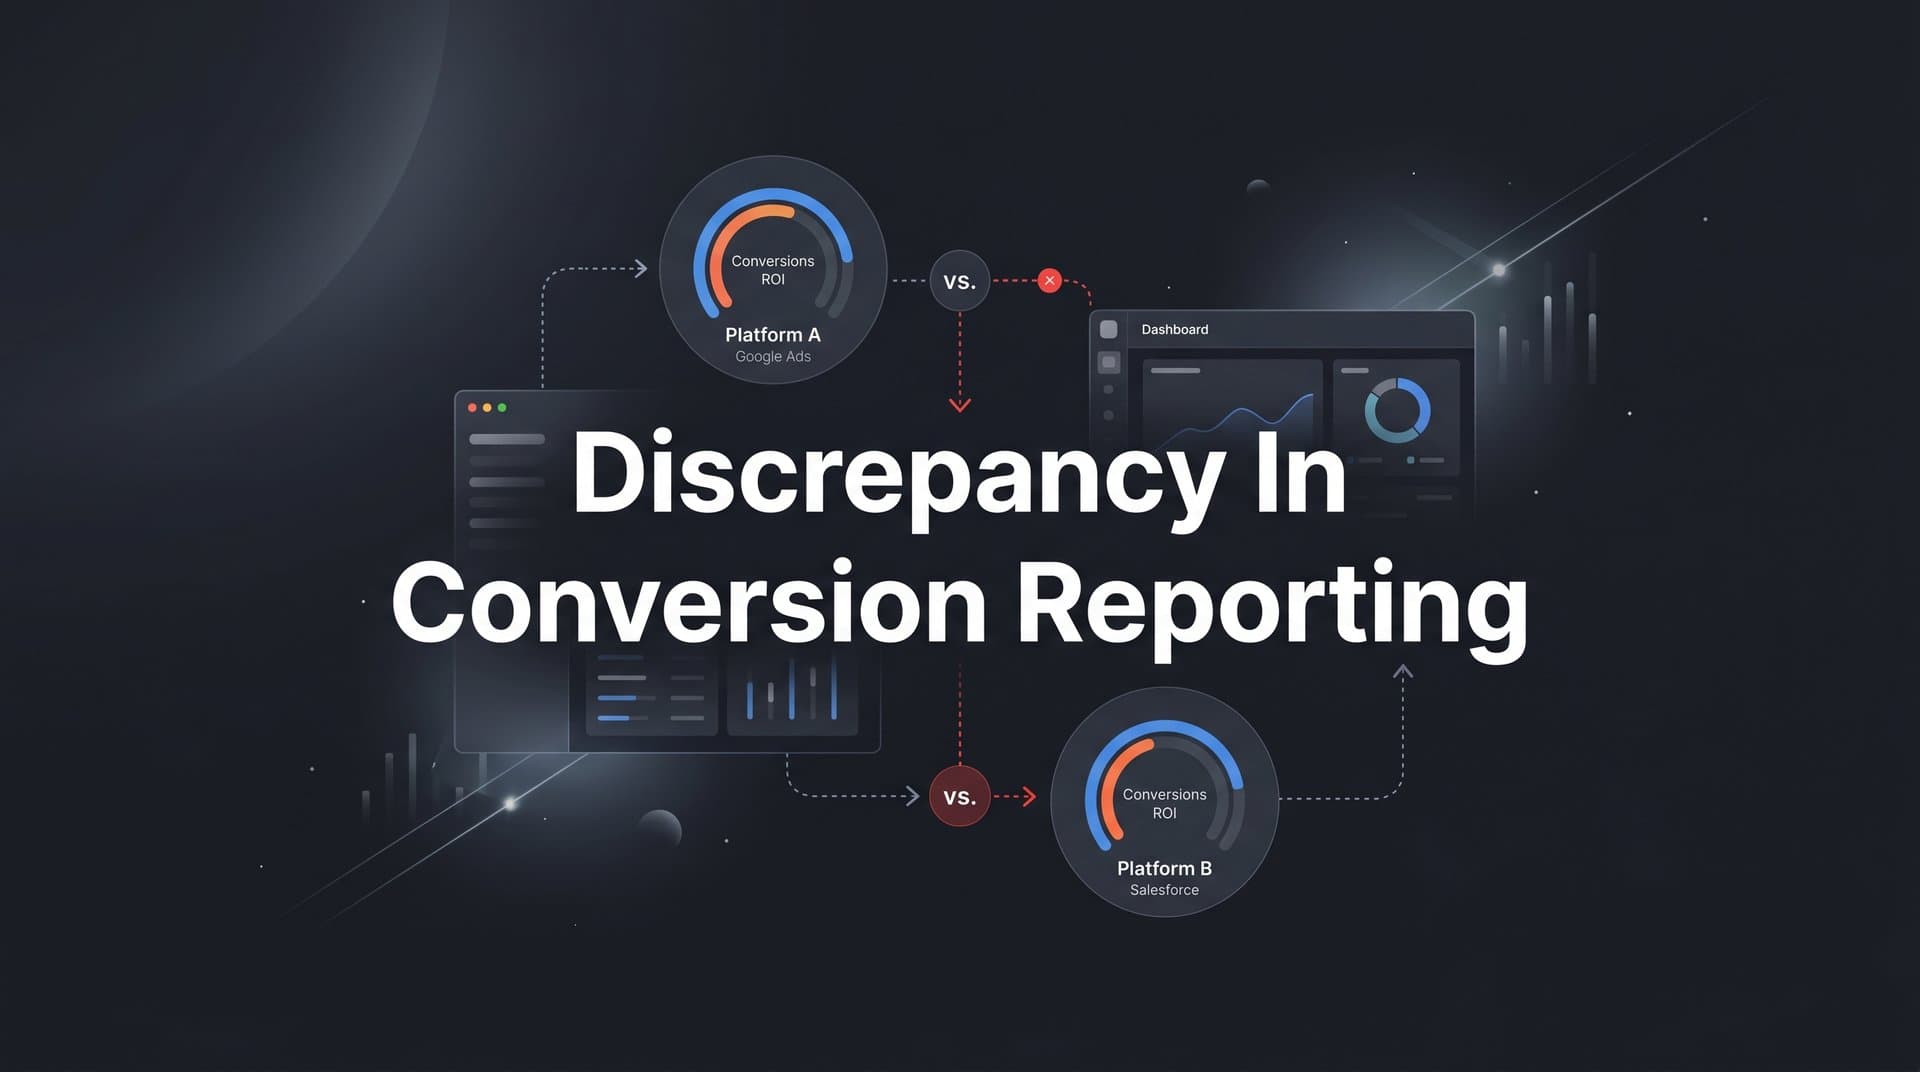
If you have ever pulled conversion data from Google Ads, Meta, and your CRM only to find three completely different numbers, you already know how frustrating a discrepancy in conversion reporting can be. These gaps are not just a minor annoyance. They create real confusion about which campaigns are working, which channels deserve more budget, and whether your marketing is actually driving revenue.
For B2B SaaS marketing teams, this problem is especially costly. Long sales cycles, multiple touchpoints, and complex buyer journeys make accurate conversion data critical for every budget decision. When your numbers do not agree, you end up either over-investing in underperforming channels or pulling budget from campaigns that are quietly driving pipeline.
This article breaks down seven practical strategies to identify, diagnose, and resolve conversion reporting discrepancies. Each strategy targets a specific root cause, from attribution model mismatches and pixel tracking failures to server-side data gaps and CRM integration issues. Whether you are running paid search, social ads, or multi-channel campaigns, these approaches will help you build a single source of truth for your conversion data so your team can make confident, data-backed decisions.
1. Audit Your Attribution Models Across Every Platform
The Challenge It Solves
One of the most common and least obvious drivers of a discrepancy in conversion reporting is the attribution model each platform uses by default. Google Ads, Meta, and GA4 all apply different logic when assigning credit for a conversion. The same conversion can legitimately be counted by multiple platforms at the same time, and without understanding why, the numbers look like errors when they are actually just different interpretations of the same event.
The Strategy Explained
Start by documenting the default attribution model for every platform you use. Google Ads defaults to data-driven attribution, which uses machine learning to distribute credit across touchpoints. Meta applies a 7-day click and 1-day view window by default, meaning it will claim credit for any conversion that occurs within seven days of a click on one of its ads. GA4 also uses data-driven attribution, but with its own underlying logic that differs from Google Ads.
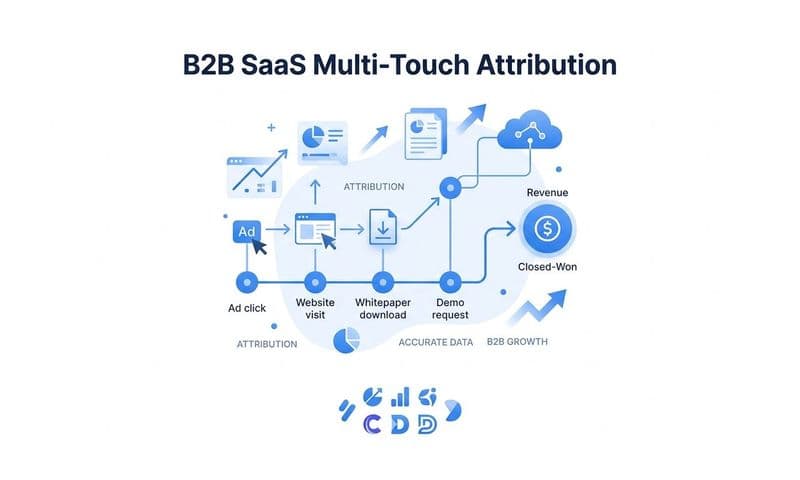
These differences mean that a single customer who clicked a Google ad, saw a Meta ad, and converted on your website could appear as a conversion in all three platforms simultaneously. That is not a bug. That is attribution overlap, and it is one of the primary reasons your totals never add up. Understanding conversion window attribution across each platform is essential before you can begin reconciling these numbers.
Implementation Steps
1. Log into each ad platform and analytics tool and document the current attribution model and lookback window settings in a shared spreadsheet.
2. Identify which platforms allow you to change the attribution model and test alternative windows, such as switching Meta to a 7-day click only window to reduce view-through inflation.
3. Choose one platform or attribution tool as your reporting standard and note where other platforms will naturally diverge from it due to their fixed defaults.
Pro Tips
Do not try to make every platform report the same number. That is not possible when each has its own attribution logic. Instead, focus on understanding the expected overlap and use a neutral third-party attribution layer to produce the number you actually make decisions from. Knowing why numbers differ is more valuable than forcing agreement between siloed dashboards.
2. Implement Server-Side Tracking to Eliminate Pixel Data Loss
The Challenge It Solves
Browser-based pixel tracking has become increasingly unreliable. Ad blockers, Safari's Intelligent Tracking Prevention, Firefox's Enhanced Tracking Protection, and Apple's App Tracking Transparency framework have all reduced the volume of conversion signals that reach ad platforms through traditional JavaScript pixels. If your tracking relies entirely on browser-side events, you are likely missing a meaningful portion of your actual conversions, which creates gaps that look like discrepancies but are actually data loss.
The Strategy Explained
Server-side tracking sends conversion event data directly from your server to the ad platform's API, bypassing the browser entirely. Meta's Conversions API and Google's Enhanced Conversions are both designed for this purpose. Because the data travels server-to-server, it is not affected by browser restrictions, ad blockers, or device-level privacy settings. Learning more about what the Conversions API actually does can help clarify why this shift matters for data accuracy.
Implementing server-side tracking alongside your existing browser pixels gives you redundant data collection. The browser pixel captures what it can, and the server-side event captures the rest. Together, they provide a more complete picture of your actual conversion volume, which reduces the gap between what your ad platforms report and what your CRM actually shows.
Implementation Steps
1. Audit your current pixel implementation to identify which conversion events are browser-based only and estimate the data loss by comparing pixel-reported events to backend records like form submissions or payment completions.
2. Set up Meta's Conversions API or Google's Enhanced Conversions using your server or a tag management platform that supports server-side containers, such as Google Tag Manager's server-side configuration.
3. Run both browser and server-side events in parallel for at least two to four weeks to validate coverage before making any budget decisions based on the new data.
Pro Tips
Server-side tracking also improves the quality of data you send back to ad platforms, which benefits their machine learning models. Better conversion signals lead to better audience targeting and bid optimization. This is not just a reporting fix. It is a performance improvement as well. Teams using Enhanced Conversions in Google Ads consistently report improvements in both data completeness and campaign optimization quality.
3. Align Conversion Event Definitions Across All Tools
The Challenge It Solves
Even when your tracking is technically sound, your numbers can still diverge if each platform is measuring a different action and calling it a conversion. Google Ads might count a page visit as a conversion. Meta might count a form view. Your CRM might count a qualified lead. If these definitions are never reconciled, you will always be comparing apples to oranges, and no amount of technical fixes will produce consistent numbers.
The Strategy Explained
Creating a unified event taxonomy means defining exactly what counts as a conversion for your business and ensuring every platform is measuring that same action. For most B2B SaaS companies, the meaningful conversion events are demo requests, trial signups, qualified leads, and closed-won deals. Everything else is a micro-conversion or engagement metric that should be tracked separately but not included in top-line conversion counts. Following best practices for tracking conversions accurately starts with getting this taxonomy right before touching any platform settings.
Once you have defined your conversion events, audit every platform to confirm it is measuring only those specific actions. Remove or exclude any conversion goals that do not match your taxonomy, and use consistent naming conventions so it is immediately clear what each event represents when reviewing reports.
Implementation Steps
1. Create a conversion event taxonomy document that lists each meaningful conversion, its definition, the triggering condition, and the platforms where it should be tracked.
2. Review every active conversion goal in Google Ads, Meta, LinkedIn, and any other ad platform you use, and identify any goals that do not match your taxonomy or that are duplicating other goals.
3. Disable or exclude conversion goals that do not belong in your primary reporting and ensure remaining goals have consistent names and trigger conditions across platforms.
Pro Tips
Pay particular attention to micro-conversions like button clicks or page scrolls that may have been added to conversion tracking during setup and never removed. These inflate conversion totals and make it nearly impossible to compare platform performance accurately. A clean taxonomy is the foundation of trustworthy data.
4. Deduplicate Conversion Events to Prevent Double Counting
The Challenge It Solves
When you implement server-side tracking alongside browser-based pixels, both can fire for the same conversion event. Without deduplication logic, the ad platform counts both signals as separate conversions, inflating your totals and making your campaigns look more effective than they actually are. This is a real technical requirement, not a theoretical edge case, and both Meta and Google provide specific documentation on how to handle it.
The Strategy Explained
Deduplication works by assigning a unique identifier to each conversion event, such as a transaction ID, order ID, or event ID, and passing that identifier with both the browser pixel event and the server-side event. When the ad platform receives both signals, it checks whether the event ID has already been recorded. If it has, the duplicate is discarded and only one conversion is counted. This is one of the most impactful steps you can take when fixing conversion tracking gaps that inflate reported performance.
Meta uses the event_id parameter for deduplication across its pixel and Conversions API. Google's Enhanced Conversions uses order IDs and transaction IDs for the same purpose. Configuring these correctly is essential any time you are running both browser and server-side tracking in parallel.
Implementation Steps
1. Generate a unique event ID for every conversion event at the time it fires, either from your backend system or using a consistent hashing method, and pass it with both the browser pixel and server-side event payload.
2. Verify your deduplication setup by checking the Meta Events Manager or Google's Tag Assistant to confirm that duplicate events are being detected and discarded rather than counted twice.
3. Monitor your conversion volumes before and after implementing deduplication to confirm that totals are decreasing toward realistic levels rather than remaining inflated.
Pro Tips
If you notice conversion volume dropping significantly after enabling deduplication, that is a sign your previous data was inflated. Do not panic. Accurate lower numbers are always more valuable than inflated ones. Use the corrected baseline to recalibrate your performance benchmarks and cost-per-conversion targets.
5. Reconcile Time Zone and Reporting Window Settings
The Challenge It Solves
This is one of the most overlooked sources of discrepancy in conversion reporting, and it causes significant confusion at the day and week level. If your Google Ads account is set to Pacific Time and your Meta account is set to Eastern Time, a conversion that happens at 11:45 PM Pacific will appear on different calendar days in each platform's report. Multiply this across dozens of daily conversions and your day-level data becomes nearly impossible to reconcile.
The Strategy Explained
Time zone mismatches create reporting differences that appear to be tracking errors but are actually just calendar math. The same issue applies to reporting windows. If you are comparing a 30-day window in one platform to a 28-day window in another, or a 7-day click window in Meta to a 30-day click window in Google Ads, the totals will naturally differ even if every conversion is being tracked perfectly. These platform-level inconsistencies are a well-documented source of Facebook ads reporting discrepancies that many teams attribute to tracking failures when the real cause is much simpler.
Standardizing these settings across all platforms reduces a category of discrepancy that has nothing to do with tracking quality. It also makes period-over-period comparisons more reliable, since you are always comparing the same time slices across every tool.
Implementation Steps
1. Audit the time zone setting in every ad platform account and analytics tool, and document any that differ from your company's standard reporting time zone.
2. Update account-level time zone settings where possible to align with a single standard, typically the time zone where your business operates or where the majority of your customers are located.
3. Review and standardize reporting window settings across platforms, choosing consistent lookback windows for click-through and view-through attribution when the platform allows customization.
Pro Tips
Even after standardizing time zones, expect some day-level variation due to conversion delay, the time between a click and the actual conversion event. Focus on week-over-week and month-over-month comparisons rather than day-level data when assessing campaign performance, as these longer windows smooth out the natural variation that even perfect tracking cannot eliminate.
6. Connect Your CRM Data to Ad Platform Reporting
The Challenge It Solves
Ad platforms can only see what happens in the browser or through server-side events tied to their tracking infrastructure. They have no visibility into what happens after a lead enters your CRM. Whether that lead became a qualified opportunity, a closed deal, or churned after one month is information that lives entirely outside the ad platform's view. This creates a fundamental gap between ad-reported conversions and actual business outcomes, which is especially problematic for B2B SaaS companies with longer sales cycles.
The Strategy Explained
Offline conversion imports allow you to send CRM data back to ad platforms so they can match closed deals and qualified leads to the original ad clicks that generated them. Google Ads supports offline conversion imports via CSV uploads or API integrations. Meta supports offline events through its Conversions API as well. Understanding what offline conversions are and how they work is the first step toward closing the loop between ad spend and actual revenue outcomes.
Connecting your CRM to your ad platforms also improves the quality of data that feeds platform machine learning models, allowing them to optimize toward leads that actually convert to revenue rather than just any form submission.
Implementation Steps
1. Identify the CRM stages that represent meaningful business outcomes for your company, such as marketing qualified lead, sales qualified lead, opportunity created, and closed-won.
2. Set up an automated export or API connection that sends these CRM events, along with the matching identifiers like email address or click ID, to Google Ads and Meta as offline conversion events. A dedicated offline conversion tracking setup ensures these downstream signals reach the right platform with the right matching data.
3. Allow at least 30 to 60 days of data to accumulate before drawing conclusions, as the time between an ad click and a closed deal in B2B SaaS can be significant.
Pro Tips
Use the Google Click ID (GCLID) and Meta's Click ID (FBCLID) as matching keys when sending offline conversions. These identifiers are captured at the time of the ad click and stored in your CRM, allowing platforms to match the downstream outcome back to the original ad with high accuracy. The more precisely you can match, the more actionable your attribution data becomes.
7. Build a Centralized Attribution Dashboard as Your Single Source of Truth
The Challenge It Solves
Even after implementing all of the strategies above, you will still have multiple platforms reporting their own version of conversion performance. Google Ads will report its numbers. Meta will report its numbers. Your CRM will report its numbers. Without a centralized layer that applies consistent attribution logic across all of these sources, your team will continue making decisions based on whichever dashboard they happen to open first. That inconsistency is itself a form of discrepancy in conversion reporting.
The Strategy Explained
A centralized attribution platform aggregates conversion data from all of your ad channels, your CRM, and your website into a single view that applies the same attribution logic to every source. Instead of asking "why does Google Ads show 40 conversions and Meta show 35 when our CRM shows 28 qualified leads," you have one number that reflects your actual business outcomes, with the ability to drill down into which channels and campaigns contributed to each one. The right performance marketing reporting software makes this kind of cross-channel visibility possible without requiring manual data reconciliation every week.
Platforms like Cometly are built specifically for this challenge. By connecting your ad accounts, CRM, and website into a single attribution layer, Cometly gives B2B SaaS marketing teams a consistent, accurate view of every conversion across the entire customer journey. You can analyze ad performance, compare attribution models side by side, and make data-driven decisions about where to scale budget with confidence.
Implementation Steps
1. Identify all of the data sources that need to feed into your central attribution view, including every ad platform, your CRM, your website analytics tool, and any other conversion sources like email or organic search.
2. Choose an attribution platform that supports native integrations with your existing stack and allows you to define your own conversion events and attribution models rather than forcing you into a single preset approach.
3. Designate the centralized dashboard as the official reporting standard for your team and establish a process for reviewing it on a consistent cadence, such as weekly performance reviews and monthly budget allocation decisions.
Pro Tips
The value of a centralized attribution dashboard compounds over time. The longer you run it, the more historical data you accumulate, and the more accurately you can identify patterns in which channels drive pipeline at different stages of the funnel. Treat it as infrastructure, not just a reporting tool, and invest in keeping the data connections clean and up to date.
Putting It All Together
Fixing a discrepancy in conversion reporting is not a one-time task. It requires a systematic approach that addresses root causes rather than just reconciling numbers after the fact.
Start with the two strategies that account for the majority of reporting gaps most marketing teams experience: auditing your attribution models and aligning your conversion event definitions. These two steps alone will often explain why your numbers look so different across platforms.
From there, layer in server-side tracking to recover data lost to browser restrictions, configure deduplication to prevent inflated totals, and standardize your time zone and reporting window settings across every tool. These are the technical foundations that make your data trustworthy at the event level.
The final two strategies, connecting your CRM to your ad platforms and building a centralized attribution dashboard, are what transform accurate event data into actionable business intelligence. They close the loop between ad spend and revenue, which is the information B2B SaaS marketing teams actually need to make confident budget decisions.
When your data agrees, your decisions improve. Start with one strategy from this list, validate your numbers, and build from there. You do not need to solve everything at once. You just need to start solving the right things.
Ready to build a single source of truth for your conversion data? Discover how Cometly connects your ad accounts, CRM, and website into one accurate attribution layer. Get your free demo today and start capturing every touchpoint to maximize your conversions.