For B2B SaaS marketing teams, budget allocation is one of the highest-stakes decisions made each quarter. Spend too much on channels that look good on the surface but fail to convert, and you burn through budget with little to show for it. Allocate too conservatively on channels that are actually driving pipeline, and you leave growth on the table.
The challenge is that most teams are making these decisions without a reliable framework. They rely on gut instinct, last-click attribution, or historical spend patterns that no longer reflect how buyers actually move through the funnel. Sound familiar? You are not alone.
A structured marketing budget allocation framework changes that dynamic entirely. It gives your team a repeatable, data-driven process for deciding where every dollar goes, how to evaluate performance across channels, and when to reallocate based on what the data is actually telling you. Instead of defending budget decisions with assumptions, you defend them with evidence.
This guide walks through each step of building and applying that framework, from auditing your current spend to using attribution data to continuously optimize allocations. Whether you are managing a lean growth budget or scaling a multi-channel paid program, these steps will help you make smarter decisions and connect your marketing investment directly to revenue.
B2B SaaS buying cycles are long, involve multiple stakeholders, and span many touchpoints before a deal ever closes. That complexity is exactly why a structured framework matters more here than in almost any other context. The good news is that the same complexity that makes budgeting hard also creates clear patterns you can learn from, if you have the right data and process in place.
By the end of this guide, you will have a clear, actionable process for turning fragmented marketing data into confident budget decisions. Let's get into it.
Step 1: Audit Your Current Spend and Channel Performance
Before you can allocate budget intelligently, you need an honest picture of where your money is currently going and what it is actually producing. This step sounds straightforward, but most teams discover gaps and surprises when they do it properly for the first time.
Start by pulling all active channel spend into a single view. This means paid search, paid social, content production, email, events, sponsorships, and any other programs that have budget attached to them. The goal is a unified spend register, not a collection of siloed reports from each platform.
For each channel, document the performance metrics you have available. The most useful metrics at this stage are cost per lead, cost per opportunity, and cost per closed deal. These three numbers tell you very different things. Cost per lead tells you about top-of-funnel efficiency. Cost per opportunity tells you how well a channel drives qualified pipeline. Cost per closed deal tells you the real revenue impact.
Here is where most audits reveal a critical problem: many teams have solid cost-per-lead data but incomplete or missing cost-per-opportunity and cost-per-closed-deal data. That gap is not just a reporting inconvenience. It means you are making allocation decisions based on partial information, and the channels that look expensive at the lead level might be delivering the most efficient pipeline at the revenue level.
As you build your channel inventory, flag every channel where attribution data is incomplete or missing entirely. Note which channels are being measured with last-click attribution only, since last-click data systematically undervalues channels that contribute earlier in the journey. A content program that consistently appears in the early stages of closed-won deals will look like it produces nothing in a last-click report.
This audit is not about judging performance yet. It is about establishing what you actually know versus what you are assuming. Many teams discover that a significant portion of their budget is allocated based on assumptions rather than data.
Success indicator: You have a complete, honest snapshot of where budget is going and what performance data you actually have versus what you are assuming. Every channel has a documented status: fully tracked, partially tracked, or untracked.
Step 2: Align on an Attribution Model Before You Allocate
This step is one of the most overlooked in the entire budgeting process, and skipping it creates problems that compound throughout the quarter. The attribution model you choose directly shapes how you perceive channel value, which means it directly shapes where you put your money.
Think of it this way: if two stakeholders are looking at the same channel data but using different attribution models, they will reach completely different conclusions about which channels deserve more budget. That misalignment does not just create confusion. It creates conflict that slows down decisions and often leads to poor compromises.
Here is a quick breakdown of the main attribution models and when each makes sense for B2B SaaS teams:
First-touch attribution gives all credit to the channel that first brought a prospect into your ecosystem. It is useful for understanding where awareness is coming from, but it ignores everything that happened between the first touch and the closed deal.
Last-click attribution gives all credit to the final touchpoint before a conversion. It is the default in many ad platforms and analytics tools, but it systematically undervalues top-of-funnel channels like content, paid social, and brand campaigns that initiate the journey.
Linear attribution distributes credit equally across all touchpoints in the path. It is a more balanced starting point than first or last touch, but it treats every touchpoint as equally valuable, which is rarely accurate.
Data-driven attribution uses algorithmic weighting to assign credit based on actual path patterns. When you have enough conversion data, this model tends to produce the most accurate picture of channel contribution. It is the model that most closely reflects how B2B SaaS deals actually close.
For most B2B SaaS teams, multi-touch attribution is the right standard. Given longer sales cycles and multiple decision-maker touchpoints, a model that distributes credit across the full journey gives you a far more accurate picture than any single-touch model.
One practical advantage of using a platform like Cometly is the ability to compare attribution models side by side. You can see how your budget decisions would shift if you moved from last-click to linear to data-driven attribution, which makes the conversation about model selection much more concrete and data-driven.
Common pitfall: Locking in an allocation before your team has agreed on an attribution model means different stakeholders are measuring success differently from day one. Get alignment on the model first.
Success indicator: Your team has agreed on a primary attribution model and has the tooling in place to apply it consistently across all channels.
Step 3: Map the Full Customer Journey to Find High-Value Touchpoints
Once you have your attribution model in place, the next step is to use customer journey data to understand which touchpoints appear most consistently in paths that lead to closed-won revenue. This is where your budget allocation starts to get genuinely strategic.
The key distinction to make here is between touchpoints that initiate awareness and touchpoints that drive conversion. Both deserve budget, but they serve fundamentally different roles in the journey. A paid social ad that introduces your brand to a new audience is not doing the same job as a demo request page or a retargeting campaign that catches a buyer at the moment of evaluation. Conflating the two leads to misallocation.
A practical exercise that consistently reveals useful patterns: pull your last 30 to 50 closed-won deals and map every tracked touchpoint that appeared in those customer journeys. Look for patterns across those paths. Which channels appear early in nearly every journey? Which touchpoints seem to appear right before a demo request or trial signup? Which content types show up repeatedly in high-value deals?
This analysis often surfaces something important: channels that look underperforming in isolated channel reports are actually critical contributors to closed revenue when you look at the full journey. A blog post or a webinar that never generates a direct conversion might appear in the path of a large percentage of your best customers. That is a signal worth funding.
Cometly tracks every touchpoint from the first ad click through to closed-won revenue, giving teams a complete journey view rather than isolated channel snapshots. That kind of end-to-end visibility is what makes this analysis possible. Without it, you are working with fragments of the story.
Look specifically for touchpoints that are underrepresented in your current budget relative to their contribution to pipeline. These are your underfunded assets, and they represent some of the most efficient reallocation opportunities available to you.
Success indicator: You have identified two to three touchpoints that are consistently present in high-value customer journeys but are currently underfunded relative to their pipeline contribution.
Step 4: Set Allocation Targets Based on Pipeline and Revenue Goals
Now you have the data and the journey insights. It is time to translate those into actual budget targets. The most reliable way to do this is to start from your revenue goal and work backward.
Begin with your revenue target for the quarter or year. Use your historical conversion rates to work backward through the funnel: how much pipeline do you need to generate that revenue? How many opportunities does that require? How many leads? Once you have those numbers, you can calculate the spend required to generate that pipeline across your channel mix, using the cost-per-opportunity data you gathered in Step 1.
This approach keeps your budget grounded in business outcomes rather than arbitrary spend ratios or last year's allocations.
From there, structure your budget into three distinct buckets:
Demand generation: This bucket covers channels and programs that create awareness and pipeline from audiences who are not yet actively evaluating solutions. Think content, brand campaigns, paid social, and events. These investments take longer to show direct ROI but are essential for building a sustainable pipeline engine.
Demand capture: This bucket focuses on converting buyers who are already in-market and actively evaluating options. Paid search, retargeting, and review site programs typically fall here. These channels tend to show faster, more measurable returns but depend on the demand generation work happening upstream.
Retention and expansion: This bucket funds programs that protect and grow existing revenue through upsell, cross-sell, and renewal campaigns. For SaaS companies where net revenue retention is a key growth lever, this bucket deserves more attention than it typically receives.
Use your attribution data to weight spend toward the channels and touchpoints with the highest pipeline contribution per dollar. And set aside a portion of your total budget as a test-and-learn reserve. This is money earmarked for experimenting with new channels or creative approaches, with clear criteria for what success looks like before you scale.
Common mistake: Allocating based on last year's spend ratios without validating whether those ratios still reflect current channel performance. Markets shift. Buyer behavior changes. Your allocation should reflect where performance is now, not where it was.
Success indicator: Each channel has a clearly defined budget target tied to a specific pipeline or revenue contribution expectation, not just a historical spend pattern.
Step 5: Implement Conversion Tracking Across Every Channel
Your budget allocation framework is only as accurate as your conversion data. If tracking is incomplete or inconsistent across channels, the performance data you are using to make decisions is unreliable, and the allocations you build on top of it will reflect those gaps.
This is a step many teams underinvest in because it feels like an infrastructure problem rather than a marketing problem. In reality, it is one of the highest-leverage investments a B2B SaaS marketing team can make.
Browser-based pixel tracking has become significantly less reliable over recent years. Ad blockers, cookie restrictions, and privacy changes across browsers and operating systems mean that a meaningful share of conversion events never get recorded. For B2B SaaS teams running paid programs, this data loss creates a specific problem: ad platforms optimize toward the conversion signals they receive. If those signals are incomplete, the platforms optimize toward the wrong behavior, which wastes budget.
Server-side tracking and Conversion API integrations address this directly. Instead of relying on a browser pixel to fire, server-side tracking sends conversion events directly from your server to ad platforms like Meta and Google, bypassing browser limitations entirely. This improves match rates, reduces data loss, and gives ad platform algorithms better signals for optimization.
Cometly's server-side tracking and CAPI integrations are built specifically for this purpose. They ensure conversion events are captured accurately and sent back to ad platforms with the enriched data those platforms need to improve targeting and optimization. Better data in means better performance out.
The key conversion events to track for a B2B SaaS marketing program include form submissions, demo requests, trial signups, MQL to SQL transitions, and closed-won deals. Each of these events represents a meaningful stage in the buyer journey and should be mapped to a specific point in your attribution model.
Also address event deduplication as part of your tracking setup. When conversion events are tracked through multiple methods simultaneously, you can end up with inflated conversion counts that make your cost-per-conversion metrics look better than they are. That distortion will lead to overconfident allocation decisions.
Success indicator: Every channel in your budget has accurate conversion tracking in place, data is flowing into your attribution platform without gaps, and you have confidence that the numbers you are seeing reflect actual buyer behavior.
Step 6: Build a Reallocation Cadence Using Real-Time Data
A budget plan is not a static document. Market conditions shift, channel performance fluctuates, and buyer behavior evolves throughout the quarter. Teams that treat their budget as a quarterly set-it-and-forget-it plan consistently underperform compared to teams that build a structured reallocation cadence into their process.
The goal is not to make reactive, panic-driven changes every week. It is to build a disciplined rhythm for reviewing performance data and making incremental adjustments based on what the data is telling you.
Here is a cadence structure that works well for most B2B SaaS marketing teams:
Weekly paid channel review: Every week, compare actual cost per pipeline against your targets for each paid channel. Look for channels that are trending above or below their cost-per-opportunity benchmarks. Make micro-adjustments to bids, budgets, and targeting based on what you see. This is your operational layer.
Monthly strategic review: Once a month, step back and evaluate attribution data across all channels, not just paid. Look at whether the pipeline contribution patterns you identified in Step 3 are holding up. Decide whether to shift budget between programs based on what the data shows. This is your strategic layer.
Cometly's real-time dashboard gives marketing teams a live view of ad performance, pipeline contribution, and ROI by channel. Instead of waiting for end-of-month reports to understand what happened, you can see what is happening now and act on it. That speed advantage compounds over time.
The other critical piece of an effective reallocation cadence is defining clear triggers in advance. Rather than relying on subjective judgment about when to move budget, set specific thresholds. For example: if a channel exceeds its cost-per-opportunity target by a defined percentage over a defined period, budget automatically shifts to a better-performing channel. These rules remove the politics from reallocation decisions and make the process faster and more consistent.
Common pitfall: Waiting until the end of the quarter to review performance means you have already spent the budget before you had the chance to optimize it. By the time you see the problem, the money is gone.
Success indicator: Your team has a documented reallocation process with defined triggers and a regular cadence for reviewing attribution data, and budget adjustments are happening based on data rather than intuition.
Putting Your Framework Into Practice
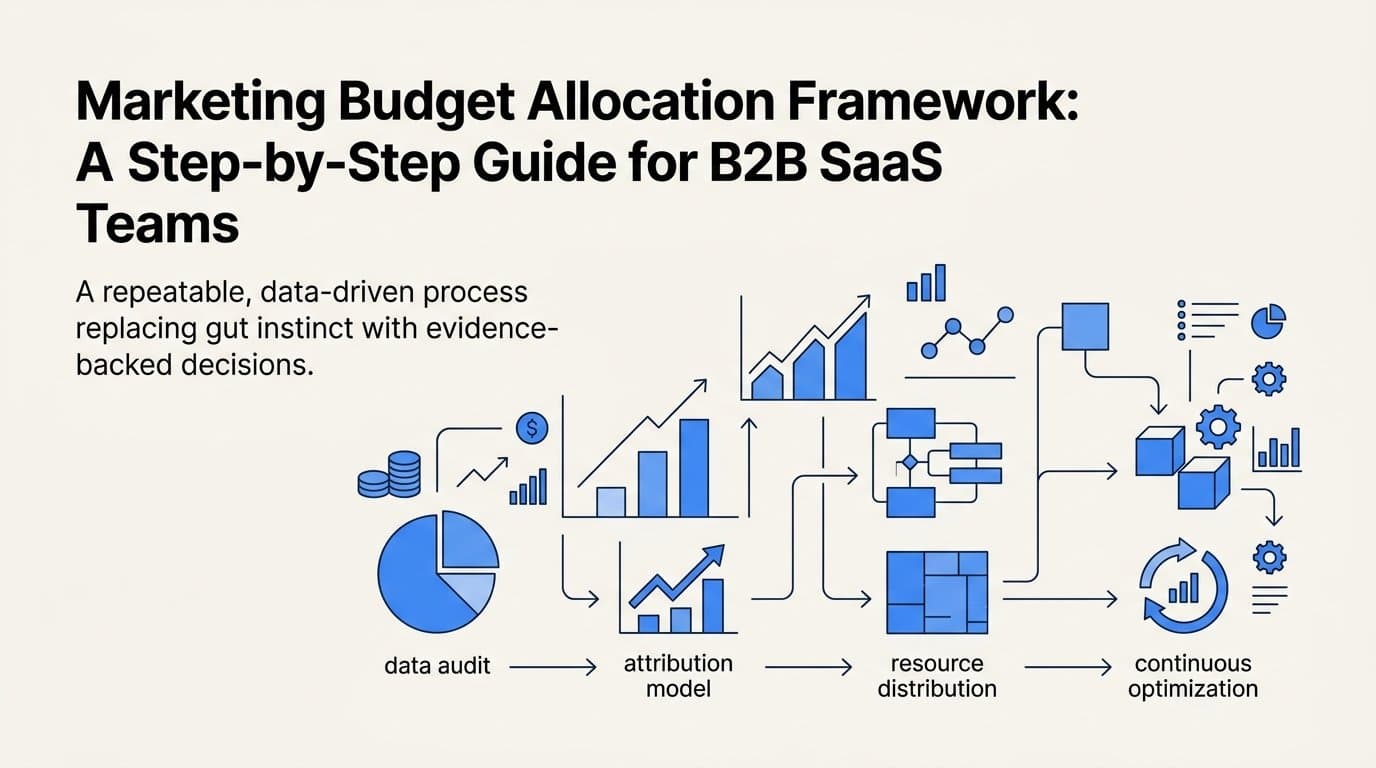
You now have a six-step framework for building and applying a marketing budget allocation process that is grounded in data, aligned to revenue goals, and designed to improve over time. Here is a quick-reference summary of the steps:
1. Audit your current spend and channel performance to establish an honest baseline.
2. Align on an attribution model before allocating so every stakeholder is measuring success the same way.
3. Map the full customer journey to identify high-value touchpoints that may be underfunded.
4. Set allocation targets by working backward from revenue goals through conversion rates to required spend.
5. Implement accurate conversion tracking across every channel so your data reflects real buyer behavior.
6. Build a reallocation cadence with defined triggers and a regular review rhythm to keep allocations aligned with actual performance.
The most important thing to understand about this framework is that it only works when the attribution data feeding it is accurate and complete. The process is sound, but the tooling layer matters just as much as the process itself. Without reliable tracking and a platform that connects ad spend to pipeline and revenue, you are still making decisions based on incomplete information.
Cometly serves as the attribution and analytics layer that makes every step of this framework executable. From tracking every touchpoint across the customer journey to comparing attribution models side by side to feeding enriched conversion data back to ad platforms, it gives your team the visibility and confidence to make smarter budget decisions at every stage.
If you do not have perfect data today, start with the audit step anyway. Identifying your tracking gaps is the first step toward closing them. Every improvement you make to your attribution data quality makes every subsequent budget decision more defensible and more accurate.
Ready to build a data-driven budget allocation process backed by complete attribution data? Get your free demo and see how Cometly connects your ad spend to pipeline and revenue so you can allocate with confidence.