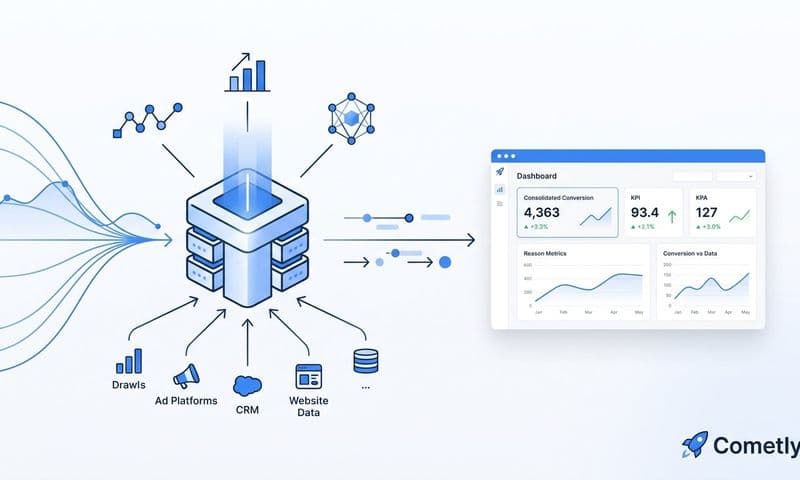

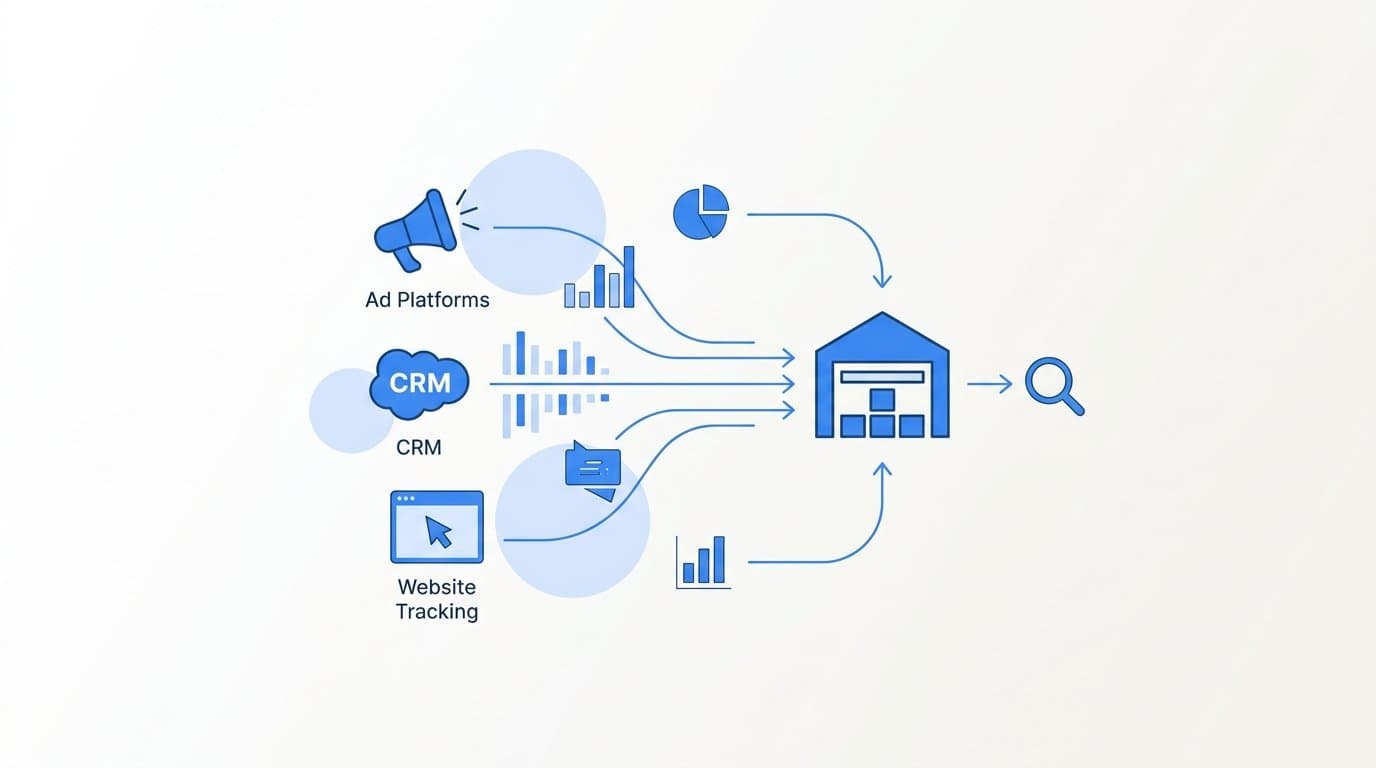
To build an attribution data warehouse, you connect your ad platforms, CRM, and website tracking into a centralized storage layer, then model the data so every touchpoint maps to a revenue outcome. That is the core idea, and everything else in this guide is about executing it correctly.
For most B2B SaaS teams, the fastest path is a purpose-built attribution platform like Cometly, which handles ingestion, modeling, and reporting without requiring a custom data engineering team. Cometly connects 70+ ad platforms and CRM sources, giving you a single source of truth from first ad click to closed-won revenue out of the box.
If you prefer to build a custom warehouse, this guide walks through every step: defining your data schema, connecting sources, choosing a warehouse, modeling attribution, and activating insights. Whether you use a platform or build from scratch, the goal is the same: accurate, queryable data that tells you which channels drive pipeline and revenue.
Here is what the build looks like, step by step.
Step 1: Define What Data Your Attribution Warehouse Needs to Store
Before you write a single line of SQL or provision a cloud warehouse, you need to know exactly what you are storing and why. Skipping this step is the most common reason attribution projects fail six months in.
Start with the four core data types every attribution warehouse depends on:
Ad platform events: Impressions, clicks, and spend pulled from Meta Ads, Google Ads, LinkedIn Ads, and any other paid channels. You need this at the campaign and ad level, not just account-level aggregates.
Website events: Page views, form submissions, trial sign-ups, and other conversion actions tracked on your site. These are the bridge between an ad click and a CRM record.
CRM records: Lead creation dates, opportunity stages, and closed-won timestamps from HubSpot, Salesforce, or your CRM of choice. Without this layer, you can track clicks but not revenue.
Payment and revenue data: Stripe or your billing system, so you can tie actual subscription revenue back to the campaigns that sourced each customer.
The single most important design decision you will make is choosing the unique identifier that connects all four sources. This is typically a user ID, email address, or an anonymous cookie or session ID that persists across touchpoints. If your ad click data, website events, and CRM records cannot be joined on a shared field, your attribution model will have gaps.
Before building anything, document the attribution questions you actually need to answer. Which channels drive first touch? Which assist conversions along the way? Which close deals? What is the true cost per acquired customer? The answers determine your schema.
You also need to decide on data granularity. Event-level data gives you full-funnel analysis and the ability to remodel attribution later. Daily aggregates are cheaper to store and query but lock you into whatever model you built at ingestion time. For most B2B SaaS teams, event-level is worth the extra storage cost.
Common pitfall: Importing raw data from multiple sources without a unified ID field makes cross-source joins impossible later. Fix the schema before you ingest, not after.
Success indicator: You can draw a diagram showing how a user ID from your CRM maps back to a session ID from your website events and a click ID from your ad platform. If you can draw that diagram, your schema is ready.
Step 2: Choose and Set Up Your Data Warehouse
Once your schema is defined, you need somewhere to store the data. For B2B SaaS teams, three warehouse options dominate the market.
BigQuery (Google Cloud) uses a pay-per-query pricing model and is particularly strong for marketing data because it integrates natively with Google Ads and Google Analytics. It is serverless, so there is no infrastructure to manage, and it scales automatically. For teams just starting out, the cost structure is forgiving at low data volumes.
Snowflake separates compute and storage, which gives large data teams the flexibility to run heavy transformation workloads without inflating storage costs. It is the most popular choice among enterprise data teams and integrates well with dbt and most BI tools.
Redshift (Amazon Web Services) is the right choice if your existing infrastructure is already AWS-heavy. It performs well for large-scale analytics workloads and benefits from tight integration with other AWS services.
All three support standard SQL, integrate with ETL tools like Fivetran and Airbyte, and work with dbt for transformation modeling. The choice between them usually comes down to your existing cloud provider and your team's familiarity.
For teams under 50 employees or with limited engineering resources, a managed attribution platform like Cometly eliminates the need to provision a warehouse entirely. You get the same queryable, cross-channel data without the infrastructure overhead.
If you are building a custom warehouse, follow this setup checklist:
1. Create a project and dataset with a clear naming convention that separates raw ingested data from modeled tables.
2. Configure access controls by role so that marketing analysts can query modeled tables without accessing raw ingestion layers.
3. Set up partitioning on your events table by date. This is the single biggest lever for query performance and cost control, because most attribution queries filter by date range.
4. Enable clustering on high-cardinality fields like campaign ID and channel so that queries on these dimensions scan less data.
5. Enable audit logging so you have a record of who queried what, which matters when discrepancies arise.
Cost consideration: Warehouse costs scale with data volume and query frequency. Partition and cluster aggressively from day one. Retroactively optimizing a poorly structured warehouse is painful and expensive.
Success indicator: You can run a simple SELECT query on your events table and return rows within seconds. If basic queries time out, your partitioning setup needs work before you add more data.
Step 3: Connect and Ingest Your Attribution Data Sources
With your warehouse provisioned, the next step is getting data into it. The order matters: connect your highest-value sources first so you can start validating data quality early.
Start with your paid ad platforms: Meta Ads, Google Ads, and LinkedIn Ads. Pull spend, impressions, clicks, and conversion events at the campaign and ad level. Account-level data is not granular enough for attribution. You need to know which specific ad drove which click.
Server-side tracking is not optional if you want accurate data. Browser-based pixels miss a significant portion of events because ad blockers prevent them from firing and iOS privacy changes limit cookie-based tracking. The solution is implementing server-side event tracking, which fires from your server rather than the user's browser. Cometly's Conversion API integration handles this natively, sending enriched first-party events directly to Meta and Google without relying on browser pixels.
Next, connect your CRM. Whether you use HubSpot or Salesforce, you need to pull lead creation dates, opportunity stages, and closed-won timestamps. This is the layer that transforms your attribution warehouse from a click-tracking tool into a revenue attribution system. Without CRM data, you can see which channels drive traffic. With it, you can see which channels drive customers.
For data ingestion automation, ETL tools like Fivetran, Airbyte, or Stitch connect to ad platforms and CRMs on a schedule and load data into your warehouse automatically. Fivetran is the most plug-and-play option with the widest connector library. Airbyte is open-source and more customizable. Stitch sits in the middle. If you use Cometly, its 70+ native integrations handle this entire layer without requiring a separate ETL tool.
Data deduplication is a step many teams skip and then spend months debugging. When both a browser pixel and a server-side event fire for the same user action, you get two records for one conversion. Implement deduplication logic immediately using event ID fields to identify and remove duplicate records. Most ad platforms provide a unique event ID that you can use as a deduplication key.
Verification step: After connecting each source, compare the row counts in your warehouse against the numbers reported in the source platform. A small discrepancy is normal due to processing delays. A large discrepancy signals a configuration problem that will corrupt your attribution models downstream.
Success indicator: Your warehouse shows the same number of conversions as your ad platforms report, within a reasonable margin, and your CRM records are appearing with the correct timestamps.
Step 4: Model Your Attribution Data for Cross-Channel Analysis
Raw ingested data is not attribution data. It is a collection of disconnected tables. The modeling layer is where you transform those tables into something that answers real marketing questions.
The foundation is a unified customer journey table. This table has one row per touchpoint per user, with columns for timestamp, channel, campaign, ad creative, event type, and the user's unique identifier. Every downstream attribution model you build queries this table.
Building this table requires ID resolution: stitching anonymous pre-conversion touchpoints to identified post-conversion records. A user might click an ad, browse your site anonymously, then fill out a form and become an identified lead in your CRM. Your ID resolution logic needs to connect the anonymous session to the identified record so the ad click gets credit for the eventual conversion.
Once your unified journey table is built, implement at least two attribution models in SQL so you can compare them:
First-touch attribution assigns 100% of credit to the first interaction. This is useful for understanding which channels are most effective at generating awareness and bringing new prospects into your funnel.
Linear attribution distributes credit equally across all touchpoints. For B2B SaaS with long sales cycles and multiple meaningful interactions before a deal closes, linear often gives a more balanced view than first or last touch.
Once you have sufficient conversion volume, layer in data-driven attribution, which uses statistical modeling to assign credit based on actual conversion patterns rather than a fixed rule. This is the most accurate model, but it requires enough historical data to be statistically meaningful.
Next, build a revenue attribution table that joins your CRM closed-won records back to the touchpoint history. The result: each deal has an attributed channel, campaign, and spend figure, so you can calculate true cost per acquired customer by channel.
For teams building a custom warehouse, dbt (data build tool) is the standard for managing this modeling layer. It lets you version-control your SQL transformations, document data lineage, and test your models automatically. This is important because attribution models are not set-and-forget. You will iterate on them as your data matures.
Cometly handles this entire modeling layer automatically. You can switch between attribution models in the UI without rewriting SQL, which is a significant time advantage for marketing teams without dedicated data engineers. The platform also handles ID resolution and journey stitching, which are the most technically complex parts of the modeling layer.
Success indicator: You can query your revenue attribution table and see a specific deal in your CRM, the touchpoints that preceded it, and the channel and campaign that gets credit under each attribution model.
Step 5: Build Your Reporting and Activation Layer
A warehouse full of well-modeled data is only valuable if it drives decisions. The reporting and activation layer is where attribution data becomes marketing strategy.
For teams that built a custom warehouse, connect it to a BI tool for visualization. Looker, Tableau, and Metabase are the most common choices. Looker is the most powerful for complex metrics and custom dimensions. Tableau is widely familiar to business users. Metabase is the fastest to set up and works well for smaller teams.
Every attribution warehouse should power three core dashboards:
Channel ROI dashboard: Spend versus pipeline versus revenue by source. This is the top-level view that tells you where to allocate budget. It should update daily and show trends over time, not just point-in-time snapshots.
Campaign performance dashboard: Cost per acquisition, return on ad spend, and conversion rate by campaign. This is where you identify which specific campaigns are efficient and which are burning budget.
Customer journey analysis: Average number of touchpoints to conversion, most common paths from first touch to closed-won, and which channels appear most frequently in winning journeys. This dashboard informs content and channel strategy, not just budget allocation.
Activation is the step most teams overlook. Sending enriched conversion data back to ad platforms using the Conversion API improves algorithmic targeting because the ad platform's AI gets better signal about which users actually converted and became customers. Cometly handles this natively, feeding enriched events to Meta and Google automatically. For custom warehouse builds, you need to build this reverse ETL pipeline separately.
Set up automated alerts for significant changes in your key metrics. If cost per acquisition rises above a defined threshold or a channel's conversion rate drops materially, your team should know before the next weekly review, not during it.
For teams using Cometly, the reporting layer is built in and includes AI-driven recommendations that surface which ads and campaigns to scale or cut based on revenue attribution data. Instead of manually querying dashboards to find insights, the platform surfaces them proactively.
Success indicator: A marketing team member without SQL skills can open a dashboard, see which channels drove the most closed-won revenue last month, and make a budget reallocation decision based on that data.
Related Questions About Attribution Data Warehouses
What is the difference between an attribution platform and an attribution data warehouse?
An attribution platform like Cometly is a managed solution that handles ingestion, storage, modeling, and reporting in one product. A data warehouse is the storage layer only and requires separate tools for ingestion (ETL), transformation (dbt), and reporting (BI tool). The platform approach is faster to deploy and requires less engineering. The custom warehouse approach gives you more flexibility and control over your data models.
How long does it take to build an attribution data warehouse from scratch?
A minimal viable version with two or three sources connected and basic attribution modeling typically takes a skilled data engineer four to eight weeks. A full multi-touch attribution warehouse with CRM integration, ID resolution, and multiple attribution models can take three to six months, depending on the complexity of your data sources and the availability of engineering resources.
Do I need a data engineer to build an attribution warehouse?
For a custom build using BigQuery or Snowflake, yes. You need someone comfortable with SQL, ETL pipeline configuration, and data modeling concepts like ID resolution and incremental loading. Platforms like Cometly are designed specifically for marketing teams and do not require engineering resources to deploy or maintain.
What is the best attribution model for B2B SaaS?
Linear and time-decay models are commonly used in B2B SaaS because buying cycles are long and multiple touchpoints contribute meaningfully to a deal. First-touch is useful for understanding awareness channel performance. Data-driven attribution is the most accurate once you have enough conversion volume to train the model, typically several hundred conversions or more.
How do I handle data privacy when building an attribution warehouse?
Use server-side tracking and first-party data collection to reduce reliance on third-party cookies. Hash or pseudonymize personal identifiers like email addresses at the point of ingestion rather than storing them in plain text. Ensure your data processing agreements with warehouse vendors and ETL tools are current and appropriate for your data types.
Putting It All Together
Building an attribution data warehouse requires four foundational pieces: a clear data schema with a unified identifier, connected sources across ads and CRM, a modeling layer that ties touchpoints to revenue, and a reporting layer that makes the data actionable for marketing decisions.
For B2B SaaS teams with engineering resources, the custom path using BigQuery or Snowflake with dbt and a BI tool gives you maximum flexibility and full ownership of your data models. Plan for a multi-month build and invest in schema design before you write a single ingestion pipeline.
For marketing teams that need accurate attribution without a multi-month engineering project, Cometly delivers the same outcome: every touchpoint connected to pipeline and revenue, with AI-driven recommendations and Conversion API integration built in from day one.
Here is the quick-start checklist regardless of which path you choose:
1. Define your schema and unified ID field before ingesting any data.
2. Choose your warehouse (BigQuery, Snowflake, Redshift) or a managed platform like Cometly.
3. Connect your ad platforms and CRM, starting with your highest-spend channels.
4. Implement event deduplication logic before conversion data accumulates.
5. Build your attribution models and a revenue attribution table that joins CRM closed-won records to touchpoint history.
6. Activate enriched conversion data back to ad platforms via Conversion API to improve algorithmic targeting.
The goal is not the warehouse itself. The goal is knowing which channels and campaigns actually drive revenue so you can scale what works and stop funding what does not.
Ready to skip the multi-month build and get accurate attribution running now? Get your free demo and see how Cometly connects every touchpoint to pipeline and revenue from day one.