Most B2B SaaS marketing teams are running tools they no longer need, missing data from tools that are broken, and making budget decisions based on incomplete attribution. The frustrating part is that the problem is invisible until something breaks, a budget review reveals unexplainable numbers, or your ad platforms start optimizing toward the wrong signals.
A martech stack audit is how you fix that. Not by cutting tools for the sake of cutting, but by building a clear picture of what you have, what is working, and where your data is falling apart.
This guide walks you through a practical, repeatable martech stack audit template designed specifically for B2B SaaS marketing and growth teams. By the end, you will have a complete inventory of every tool in your stack, a scoring framework to evaluate each one, a plan to eliminate redundancy and close data gaps, and a stronger foundation for accurate attribution and ROI tracking.
Whether you are preparing for a budget review, scaling your paid acquisition, or trying to understand why your conversion data does not add up, this audit gives you the visibility to make confident decisions.
The process covers six concrete steps: inventorying your current tools, mapping them to your customer journey, evaluating performance and data quality, identifying gaps and overlaps, scoring and prioritizing changes, and building a clean, connected stack going forward.
Each step includes specific questions to ask, criteria to evaluate, and actions to take. This is a working template you can run with your team in a single sprint.
A well-audited martech stack does more than cut costs. It ensures your attribution data is reliable, your ad platforms are receiving accurate conversion signals, and your team is spending time on tools that actually move the needle. For B2B SaaS teams investing in paid channels, that accuracy is the difference between scaling what works and burning budget on what does not.
Step 1: Build a Complete Inventory of Every Tool in Your Stack
Before you can evaluate anything, you need to know what you are working with. This sounds obvious, but most teams are surprised by what they find when they actually sit down and list everything out.
Start by creating a master spreadsheet. Every tool your marketing team uses, pays for, or has access to goes on this list, including free tiers, trials, and tools that were set up by someone who left the company six months ago.
For each tool, capture the following columns:
Tool name: The exact name as it appears in your billing or login.
Category: Assign it to a functional bucket such as CRM, ad platform, analytics, automation, tracking, content and SEO, or reporting and dashboards.
Owner: The person responsible for this tool. If no one can name an owner, that is already a red flag.
Monthly or annual cost: Pull this from your finance team's SaaS spend report, not from memory.
Contract renewal date: Critical for prioritizing which decisions need to happen first.
Number of active users: How many people logged in during the last 30 days? Most tools have usage dashboards or admin reports you can pull this from.
To make sure nothing gets missed, pull from multiple sources. Check your finance team's SaaS spend report, look at browser extensions your team has installed, review integrations listed inside your CRM and ad platforms, and scan any onboarding documentation for tools mentioned in setup flows.
Once you have your list, organize tools into functional buckets. A clean categorization looks like this:
Data collection and tracking: Tag managers, pixels, server-side tracking tools, and event tracking platforms.
Attribution and analytics: Multi-touch attribution platforms, web analytics, and conversion reporting tools.
CRM and pipeline: Your primary CRM, any supplementary pipeline tools, and deal tracking systems.
Paid media management: Ad platforms, bid management tools, and creative testing tools.
Email and nurture: Marketing automation platforms, email service providers, and sequence tools.
Content and SEO: Content management systems, keyword research tools, and on-page optimization tools.
Reporting and dashboards: Business intelligence tools, data visualization platforms, and custom dashboard builders.
One common pitfall at this stage: teams frequently miss pixel-based tracking tools, Zapier-style automation connectors, and legacy tools still pulling data in the background. Check your tag manager carefully. Look at every pixel firing on your site. Check your ad platform integrations for connected apps you may have forgotten about.
The success indicator for this step is simple: you have a single spreadsheet with every tool listed, categorized, and assigned an owner before you move to Step 2.
Step 2: Map Each Tool to Your Customer Journey
An inventory tells you what tools you have. A journey map tells you whether those tools are covering the right moments in your funnel.
Start by drawing out your B2B SaaS customer journey in stages: Awareness, Consideration, Conversion, Retention, and Expansion. Then, for each tool in your inventory, assign it to the stage or stages it touches.
For each stage, you want to identify three things. First, which tools are responsible for capturing data at this stage. Second, which tools are responsible for acting on that data, such as triggering a nurture sequence or firing a conversion event. Third, which tools are responsible for reporting on outcomes at this stage.
Flag any journey stage that has no tool coverage. These are your data blind spots, and they directly impact attribution accuracy. If you have no tool capturing data at the Consideration stage, for example, you cannot understand what content or campaigns are influencing prospects before they convert.
Pay special attention to the handoff between marketing and sales. This is where attribution chains break most often in B2B SaaS. A lead fills out a form, gets passed to sales, and the connection between that lead and the original ad click gets lost somewhere in the transfer. Tools that do not communicate across that handoff create broken attribution chains that make it impossible to tie closed revenue back to marketing spend.
Document which tools are sending data to your ad platforms, specifically Meta, Google, and LinkedIn. More importantly, document how they are sending it. Are you using server-side tracking or only browser-based pixels? This distinction matters enormously. Browser-based pixels are increasingly blocked by ad blockers and browser privacy restrictions. Server-side conversion tracking via Conversion API integrations, such as Meta CAPI or Google Enhanced Conversions, dramatically improves signal quality and match rates, giving your ad platforms better data to optimize against.
A common pitfall at this stage is assigning tools to multiple journey stages without a clear owner at each stage. When the same tool is responsible for capturing data at Awareness and reporting at Conversion with no one specifically accountable for either, you end up with data duplication and conflicting attribution signals.
The success indicator here is that every stage of your customer journey has at least one tool capturing data and one tool reporting on it, with no uncovered gaps in your map.
Step 3: Score Each Tool on Performance and Data Quality
Now that you know what tools you have and where they sit in your journey, it is time to evaluate how well each one is actually performing. This is where the audit gets rigorous.
Create a scoring rubric with five criteria, each rated on a scale of one to five. Score every tool in your inventory against these criteria and calculate a composite score.
1. Data accuracy and reliability: Is this tool receiving clean, deduplicated events? Is it tracking server-side or only via browser pixel? Are conversions being reported consistently across platforms? A tool that fires duplicate events or misses conversions due to ad blockers gets a low score here, regardless of how good its interface looks.
2. Integration depth with other tools in your stack: Does this tool connect directly to your CRM, ad platforms, and analytics layer? Or does it require manual exports and CSV uploads to share data? Deep, native integrations score high. Manual workarounds score low.
3. Attribution contribution: Does this tool give you visibility into which channels and campaigns are driving pipeline and revenue? Or does it only report on top-of-funnel vanity metrics like impressions and clicks? Tools that connect marketing activity to actual revenue outcomes score highest here.
4. Active usage by the team: How many team members used this tool in the last 30 days? Is it part of a weekly workflow or something people log into once a quarter? A tool that nobody uses is not a tool. It is a subscription.
5. Cost-to-value ratio: Can you directly connect the insights from this tool to a budget decision your team made? If the answer is no, the value is unclear. If the answer is yes, and that decision led to measurable improvement, score it high.
One critical pitfall to avoid: scoring tools based on features rather than actual usage and outcomes. A platform with 200 features that your team uses for one specific report is not a high-value tool. Score what is being used and what is producing decisions, not what is theoretically possible.
After scoring, look at the distribution. Tools with composite scores of 20 or above are your core stack. Tools scoring between 12 and 19 need a closer look. Tools scoring below 12 are candidates for replacement or removal.
This scoring framework also helps you have honest conversations with tool vendors and internal stakeholders. When someone argues to keep a tool, you can point to the score and ask which specific criteria they believe are underrated.
The success indicator for this step is that every tool has a composite score and you can clearly see which tools are high-value and which are candidates for replacement or removal.
Step 4: Identify Redundancies, Gaps, and Attribution Blind Spots
With your scored inventory in hand, you can now do the most valuable part of the audit: finding where your stack is broken.
Start by reviewing your scored inventory for overlap. Look for tools doing the same job at the same journey stage. Common redundancies in B2B SaaS stacks include multiple analytics platforms reporting on the same traffic, duplicate CRM integrations pulling the same contact data, and overlapping attribution tools that each report different numbers for the same campaigns.
Redundancy is not always a problem. Sometimes two tools serve slightly different purposes within the same category. The key question is whether both are actively used and whether their data is consistent with each other. If two tools are both supposed to be tracking conversions but reporting different numbers, that inconsistency is more damaging than the redundancy itself. It means your team cannot trust either data source.
Next, identify your attribution blind spots specifically. These are the moments in your customer journey where you lose the ability to connect a conversion back to its source. The most common blind spots in B2B SaaS stacks include:
Form submissions not tied to ad click data: A lead fills out a form, but the conversion event does not carry the original click ID from the ad that drove the visit. The attribution chain breaks at the first touchpoint.
Offline conversions not synced back to ad platforms: A deal closes in your CRM, but that revenue data never makes it back to Google or Meta. Your ad platforms continue optimizing based on lead volume rather than revenue quality.
CRM pipeline stages not connected to marketing touchpoints: Your sales team is moving deals through stages, but there is no mechanism connecting those deal stages back to the campaigns and channels that originated them.
Evaluate your conversion tracking setup directly. Are you firing conversion events server-side? Are you using first-party data enrichment to improve match rates? Weak conversion tracking means your attribution model is working with incomplete data, which leads to poor budget allocation decisions.
Also look for tools that are creating data silos. If your paid media team is working from one dashboard, your demand gen team from another, and your revenue team from a third, you do not have a single source of truth. That fragmentation is a structural problem that no amount of reporting can fix. It has to be solved at the data layer.
The success indicator for this step is a documented list of redundant tools to consolidate and a list of gaps to fill, with specific attribution blind spots identified and mapped to the journey stages where they occur.
Step 5: Prioritize Changes Using a Decision Framework
Not every finding from your audit needs to be acted on immediately. If you try to fix everything at once, you will fix nothing. This step is about sequencing your changes intelligently.
Use a two-axis prioritization matrix. On one axis, plot the impact on attribution accuracy and revenue visibility, ranging from low to high. On the other axis, plot the effort required to implement or remove the change, also ranging from low to high. Every finding from your audit gets placed into one of four quadrants.
Quick wins (high impact, low effort): These are your first priorities. Common quick wins include removing unused tools that are still incurring cost, connecting a CRM integration that is already supported natively but has not been configured, and enabling server-side conversion tracking for an ad platform you are already running. These changes improve your data quality immediately without requiring significant resources.
Strategic projects (high impact, high effort): These belong on your roadmap with dedicated resources and realistic timelines. Common strategic projects include replacing a legacy analytics platform with a modern attribution solution, consolidating multiple reporting tools into a single source of truth, and building a first-party data pipeline that feeds enriched conversion events back to ad platforms. These changes take longer but produce the most durable improvements to attribution accuracy.
Backlog (low impact, low effort): These are worth doing eventually but should not consume priority bandwidth. Minor integrations, cosmetic reporting improvements, and tool configuration tweaks fall here.
Deprioritize (low impact, high effort): Do not spend time on these. Optimizing tools that are not connected to your attribution or revenue reporting is a distraction, regardless of how technically interesting the work might be.
For each prioritized change, assign three things: an owner, a target completion date, and a success metric. The success metric should be tied to attribution outcomes rather than activity. Cleaner conversion data, improved match rates between your CRM and ad platforms, and more accurate pipeline reporting are the right measures of success here.
When you are evaluating replacements for attribution or analytics tools, look for platforms that offer multi-touch attribution, server-side tracking, Conversion API integration, and direct connection to CRM and revenue data. These capabilities close the most common attribution gaps in B2B SaaS stacks. A tool that only reports on top-of-funnel activity without connecting to pipeline and revenue will recreate the same blind spots you are trying to eliminate.
One common pitfall to watch for: prioritizing cost savings over data quality. Removing a tool that provides critical attribution data to save on subscription costs often results in far greater losses through wasted ad spend and poor budget decisions. Always weigh the cost of a tool against the cost of the blind spot it prevents.
The success indicator for this step is a prioritized action list with owners and deadlines, organized by impact tier, that your team can begin executing immediately.
Step 6: Rebuild Your Stack Around a Single Source of Attribution Truth
After completing your audit, the goal is not just a leaner stack. It is a connected stack where data flows cleanly from first ad click to closed-won revenue without gaps or contradictions.
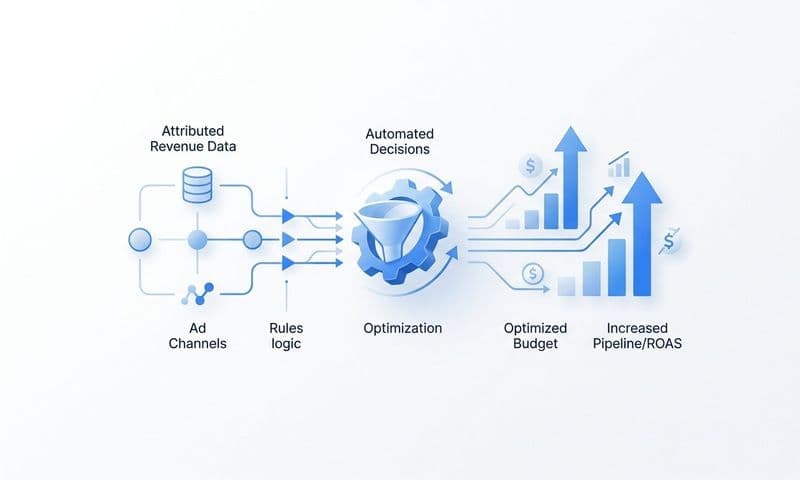
Define your attribution layer as the core of your stack. Every other tool should either feed data into it or receive insights from it. Your attribution platform connects your ad platforms, CRM, website tracking, and revenue data in one place. It is the system of record for understanding what is driving growth.
Establish a clear tracking hierarchy. Use server-side event tracking as your primary data collection method. Browser-based pixels serve as a secondary signal to fill gaps. CRM data becomes the ground truth for revenue attribution. This layered approach maximizes data coverage and accuracy, especially as browser privacy restrictions continue to limit the reliability of cookie-based tracking.
For B2B SaaS teams running paid acquisition, the practical test of a well-built attribution layer is straightforward. Can you open a single dashboard and see which ads drove which leads, which leads became pipeline, and which pipeline closed as revenue? If yes, your attribution is working. If you need to pull data from three different tools and reconcile them manually in a spreadsheet, you have identified your next audit priority.
Set up a regular audit cadence going forward. A full stack audit should happen annually. Lighter quarterly reviews should catch new tools being added without review, integrations breaking silently, and attribution gaps opening up as your campaigns scale. The quarterly review does not need to be a full sprint. A two-hour review of your tool inventory, a check of integration health, and a look at conversion data consistency is enough to catch problems before they compound.
Document your clean stack in a living document that includes every tool, its function, its owner, its integrations, and its role in your attribution chain. This becomes your martech stack template for future audits. When a new tool is proposed, it gets evaluated against this document before it gets purchased. That discipline prevents the tool sprawl that made this audit necessary in the first place.
Platforms like Cometly are built to serve as this attribution layer. Cometly connects ad platforms, CRM data, and website events into a unified view of what is driving revenue, with AI-powered recommendations that help you act on that data. It captures every touchpoint from ad click to closed deal, sends enriched conversion events back to Meta and Google to improve algorithmic targeting, and gives your team a single source of truth for making budget decisions. For B2B SaaS teams that need accurate, end-to-end attribution, it closes the gaps that most martech stacks leave open.
The success indicator for this final step is clear: you can trace a closed deal back to its original ad touchpoint without switching between tools or relying on manual reporting.
Your Audit Checklist and Next Steps
Running a martech stack audit is one of the highest-leverage activities a B2B SaaS marketing team can do before a new budget cycle, a channel expansion, or a push to improve attribution accuracy.
Here is your complete audit checklist:
1. Build a complete tool inventory with categories, owners, costs, and renewal dates.
2. Map every tool to a stage in your customer journey and identify uncovered gaps.
3. Score each tool on data quality, integration depth, attribution contribution, active usage, and cost-to-value.
4. Identify redundancies, gaps, and specific attribution blind spots across your funnel.
5. Prioritize changes using the impact-versus-effort matrix, with owners and deadlines for each action.
6. Rebuild your stack around a connected attribution layer with a clear data flow from ad click to revenue.
The output of this process is not just a shorter tool list. It is a stack that gives your team reliable data to make confident decisions about where to invest your ad budget and how to scale what is working.
If your audit reveals gaps in attribution or conversion tracking, Cometly is built specifically for B2B SaaS teams that need accurate, end-to-end attribution connecting ad spend to pipeline and revenue in real time. Get your free demo today and start building the attribution foundation your growth decisions deserve.