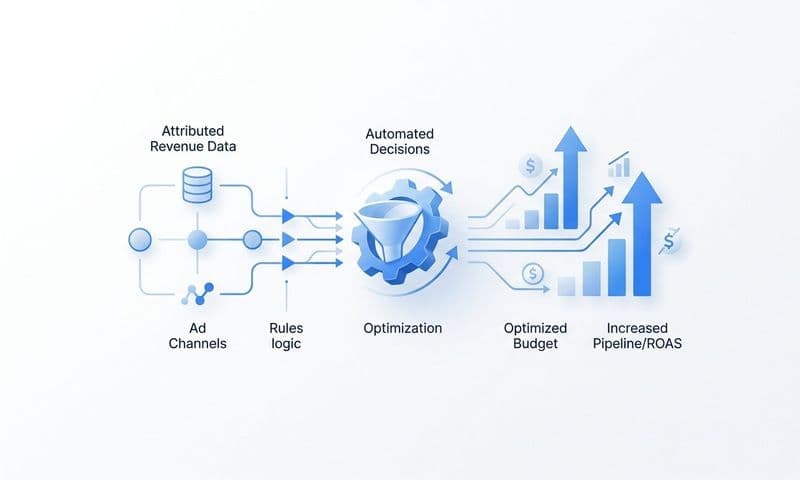
Most B2B SaaS marketing teams are running on a martech stack that was assembled over time, not designed with intention. A tool gets added to solve a specific problem. Then another. Then a third to fill a gap the second one created. Before long, you have overlapping platforms, siloed data, and no clear picture of what is actually driving revenue.
This is not a niche problem. It is the default state for most growth-stage SaaS teams, and it quietly undermines every campaign decision you make. When your tracking is unreliable and your attribution data is fragmented, you are essentially flying blind on budget allocation.
Martech stack optimization is the process of auditing, streamlining, and connecting your marketing technology so every tool earns its place and your data flows cleanly from one system to the next. It is not about cutting tools for the sake of simplicity. It is about building a stack that gives you accurate, actionable data from the first ad click all the way to closed-won revenue.
This guide walks you through a practical, repeatable seven-step process. You will evaluate what you have, cut what you do not need, fill the gaps that matter, and wire everything together so your attribution data is reliable and your ad spend decisions are grounded in real revenue outcomes.
Whether you are a marketing leader trying to reduce tool sprawl or a growth team that wants cleaner data for ad optimization, this framework will help you move from a fragmented martech environment to a connected, high-performing one. By the end, you will know exactly which tools to keep, which to cut, and how to structure your stack so it supports your business model rather than working against it.
Let's get into it.
Step 1: Audit Every Tool in Your Current Stack
You cannot optimize what you have not fully inventoried. The first step in any martech stack optimization effort is creating a complete, honest picture of every tool your team currently pays for or uses, including tools owned by individual contributors or specific departments that never made it into a central budget review.
Start by pulling together every subscription, license, and free tool that touches your marketing workflow. This includes ad platforms, analytics tools, CRM add-ons, email automation, landing page builders, chat tools, data enrichment platforms, and any reporting or BI layers sitting on top of your core systems. Do not skip the tools that feel minor. A disconnected point solution can create just as much attribution noise as a major platform.
For each tool, document the following in a simple spreadsheet:
Tool name and category: What type of tool is it and what problem was it originally purchased to solve?
Monthly or annual cost: Include all seats and tiers. Hidden costs add up fast when you are running a bloated stack.
Primary owner: Who is responsible for this tool? If no one can name an owner, that is a red flag.
Active users in the last 90 days: A tool with zero active users in the past three months is a strong cut candidate regardless of its original purpose.
Integrations: What other systems does this tool connect to? A tool with no integrations is a data island, and data islands are attribution killers.
Keep or cut recommendation: Leave this column open for now. You will fill it in after completing the next two steps.
Common findings at this stage include duplicate analytics tools running in parallel, disconnected ad reporting platforms that each show different numbers, and CRM add-ons that replicate functionality already available in your core system. These redundancies are not just a cost problem. They are a data quality problem, because each disconnected tool is generating its own version of the truth.
The goal of this step is not to make decisions yet. It is to build the foundation of visibility that makes good decisions possible.
Success indicator: You have a single document listing every tool, its cost, its owner, and its current usage status. Nothing is missing from the inventory.
Step 2: Map Your Customer Journey Against Your Data Flows
Having a list of tools is not enough. You also need to understand how data is supposed to move through your stack and where it is actually breaking down. This is where most martech audits stop short, and it is the step that reveals the real cost of a fragmented stack.
Draw out the stages of your customer journey from first ad impression through lead capture, nurture, sales handoff, and closed-won revenue. You do not need a complex diagram. A simple linear flow with labeled stages is enough to make the gaps visible.
For each stage, answer two questions: Which tools are supposed to capture data here? And are they actually doing so reliably today?
Here is where things typically get uncomfortable. Form submissions that are not firing conversion events. Ad clicks that are not being attributed to leads in your CRM. Offline conversions that never make it back to your ad platforms. A lead that moves from your marketing automation tool to your CRM and arrives with no original source data attached. These gaps are not edge cases. They are common, and they mean your attribution numbers are incomplete by default.
Pay particular attention to the handoff points between systems. The transition from ad platform to website, from website to CRM, and from CRM to revenue data are the three places where attribution most commonly breaks. Each handoff is an opportunity for data to get dropped, misattributed, or simply never captured.
This mapping exercise does two things. First, it shows you which tools are failing to deliver the data they were purchased to provide. Second, it shows you which gaps in your stack are directly costing you attribution accuracy, which means they are directly affecting your ability to make smart budget decisions.
If you find that a tool is sitting in your stack but contributing nothing to your data flow, that is a strong signal for the cut column in your audit spreadsheet. If you find a stage in your customer journey where data is consistently going missing, that is a gap you will need to address in Step 4.
Success indicator: You have a visual map showing where data is captured, where it flows between systems, and where it goes missing. Every gap is documented.
Step 3: Define the Core Jobs Your Stack Must Do
Before you start cutting tools or evaluating replacements, you need to get clear on what your stack actually needs to accomplish. This sounds obvious, but most teams skip it and end up replacing one set of problems with a slightly different set of problems.
Define the functional requirements your stack must fulfill based on your business model and growth goals. For B2B SaaS teams, these core jobs typically include the following:
Capturing first-party conversion data: Your stack needs to reliably record every meaningful action a prospect takes, from ad click to form fill to demo request, using data you own and control.
Attributing pipeline and revenue to specific campaigns and channels: You need to be able to trace a closed-won deal back to the marketing activity that influenced it, not just the last click before a form submission.
Tracking multi-touch journeys across long sales cycles: B2B deals often involve weeks or months of touchpoints. Your stack needs to hold the entire journey together, not just capture isolated events.
Sending enriched conversion data back to ad platforms: Your ad platforms need accurate conversion signals to optimize targeting and bidding. This means sending enriched events back to Meta via the Conversions API and to Google via Enhanced Conversions.
Providing a unified reporting view across all channels: You need one place where you can see performance across all channels, compared against the same attribution model, connected to actual revenue data.
Once you have listed your core jobs, rank them by priority. Then, for each one, note whether it is currently being done well, partially, or not at all. This ranking becomes your decision framework for the next step.
One critical trap to avoid here: adding tools to solve symptoms rather than root causes. If your attribution is broken because your conversion tracking is unreliable, adding another reporting dashboard will not fix it. You will just have a more sophisticated view of incomplete data. Fix the foundation first.
Also align your requirements with your attribution strategy. Whether you are using first-touch, linear, or data-driven attribution, your stack needs to support the model you are actually using to make decisions.
Success indicator: You have a prioritized list of functional requirements that any new or retained tool must fulfill. Every tool in your audit can be evaluated against this list.
Step 4: Cut, Consolidate, and Fill Gaps Strategically
Now you have everything you need to make firm decisions. Your audit document, your data flow map, and your requirements list together give you a clear framework for deciding what stays, what goes, and what needs to be added.
Work through each tool in your audit spreadsheet and assign a final decision: keep, cut, or replace.
Cut tools that: duplicate functionality already covered by another platform, have had no active users in the past 90 days, or lack any integration with your CRM or ad platforms. If a tool cannot contribute to your data flow, it is not contributing to your attribution accuracy or your growth goals.
Consolidate where possible. Look for platforms that can handle multiple jobs from your requirements list. A marketing attribution platform that also handles conversion tracking, customer journey analytics, and native ad platform integrations eliminates the need for several disconnected point solutions. Fewer tools means fewer integration failure points and more consistent data across your stack.
Fill gaps strategically. When you identify a gap in your stack, fill it based on your prioritized requirements list, starting with the highest-priority gaps first. For most B2B SaaS teams, the highest-priority gaps are almost always around conversion tracking and attribution accuracy, because these affect every downstream decision you make.
When evaluating new tools to fill gaps, apply these criteria before making any purchase decision:
Native integrations with your CRM and ad platforms: A tool that requires custom API work to connect to your core systems is a liability, not an asset. Native integrations reduce setup time and reduce the risk of data breaking quietly over time.
Server-side tracking capabilities: Browser-based tracking is increasingly unreliable. Any tool you add to handle conversion data should support server-side event collection to protect your data quality against privacy browser restrictions and ad blockers.
Ability to send enriched conversion events back to ad platforms: Tools that only pull data in for reporting, without feeding enriched data back to Meta, Google, and other ad platforms, are leaving optimization value on the table. Your ad platform algorithms perform better when they receive accurate, enriched conversion signals.
The goal at the end of this step is a leaner, more connected stack where every tool has a defined role, a clear owner, and at least one integration connecting it to the rest of your data flow.
Success indicator: Your revised stack has no redundant tools and every tool connects to at least one other system in your data flow. The keep or cut decision for every tool is documented and defensible.
Step 5: Implement Server-Side Tracking and Conversion API Connections
This is the step where your martech stack optimization moves from organizational to technical, and it is the one that has the biggest impact on attribution accuracy. If you skip this step, everything else you have done will be built on an unreliable data foundation.
Browser-based pixel tracking has become significantly less reliable over the past few years. Ad blockers, privacy-focused browsers, and platform-level restrictions on third-party cookies all reduce the percentage of conversions that your pixel actually captures. When your pixel misses conversions, your ad platforms receive incomplete optimization signals, your attribution data understates performance, and your bidding algorithms make decisions based on partial information.
Server-side tracking solves this by sending conversion data directly from your server to ad platforms rather than relying on a browser pixel. Because the event is sent server-to-server, it is not affected by ad blockers or browser privacy restrictions. Match rates improve significantly, and your ad platforms receive more complete and accurate conversion data.
Start by implementing server-side event tracking for your highest-value conversion events first. These typically include form submissions, trial signups, demo requests, and any purchase or subscription events. Prioritize the events that your ad platforms use for optimization, because these have the most direct impact on your campaign performance.
Connect your conversion data to Meta via the Conversions API. For Google, implement Enhanced Conversions to pass hashed first-party data alongside your standard conversion tags. Both of these connections allow your ad platforms to match conversion events to users more accurately, which improves targeting and bidding performance.
Implement event deduplication carefully. If you are running both browser-based pixels and server-side events simultaneously, which is a common setup during transition, you need to ensure the same conversion is not being counted twice. Most ad platforms have deduplication mechanisms built in, but they require consistent event naming and a shared event ID between your browser and server events.
First-party data enrichment is the final layer to add here. When you send a conversion event back to your ad platforms, append as much first-party context as possible: lead source, campaign, CRM stage, company size, or any other data point that helps the algorithm understand who converted and why. This enriched data improves the quality of your ad platform's targeting model and gives your bidding algorithms better signals to work with.
Success indicator: Your key conversion events are firing via server-side connections. Your match rates in Meta Events Manager and Google Ads are at acceptable thresholds, and you have deduplication in place to prevent double-counting.
Step 6: Unify Attribution Reporting Across All Channels
With solid tracking in place, you are ready to build the reporting layer that turns all of that data into decisions. The goal here is a single source of truth for attribution reporting that connects ad spend to pipeline and revenue across every channel.
The first thing to understand is why ad platform native reporting cannot serve as your primary attribution source. Every ad platform, whether Meta, Google, LinkedIn, or any other, takes credit for conversions using its own attribution window and its own model. When you add up the conversions each platform claims, the total will almost always exceed your actual conversion volume. Each platform is optimizing for its own numbers, not for your business reality.
A dedicated attribution platform solves this by pulling data from all your ad channels, your CRM, and your website to build a unified view of the customer journey. Instead of seeing each channel's self-reported performance in isolation, you see how channels interact across the full journey and which ones are actually contributing to revenue.
One of the most valuable capabilities at this stage is comparing attribution models side by side. First-touch attribution gives all credit to the channel that generated initial awareness. Last-click gives all credit to the final touchpoint before conversion. Linear distributes credit evenly across all touchpoints. Data-driven attribution uses your actual conversion data to weight touchpoints based on their observed impact. Each model tells a different story, and understanding how they differ helps you make more nuanced budget allocation decisions.
The step that separates good attribution from great attribution is connecting your revenue data. Many B2B SaaS teams track leads and MQLs but never close the loop to actual closed-won revenue. When you connect your billing data, such as Stripe or your CRM's revenue fields, to your attribution reporting, you can see which campaigns and channels are generating actual revenue, not just lead volume. This changes the conversation entirely. A channel that generates fewer leads but higher-value customers may deserve more budget, not less.
Set up a regular reporting cadence so your team reviews attribution data on a consistent schedule. Weekly reviews of campaign performance and monthly reviews of channel-level attribution give you the rhythm needed to make data-driven budget decisions rather than relying on platform-reported metrics or gut feel.
Success indicator: You can trace a closed-won deal back to the specific ads, channels, and touchpoints that influenced it. Your team is reviewing this data regularly and using it to make budget allocation decisions.
Step 7: Build a Review Process to Keep Your Stack Optimized Over Time
Here is the uncomfortable truth about martech stack optimization: it is not a one-time project. Tools change, business needs evolve, new channels get added, and integrations break quietly after platform updates. Without a governance process, your stack will drift back toward fragmentation within a year of your optimization effort.
The foundation of ongoing governance is assigning a stack owner. This is typically a marketing operations lead or growth lead who is explicitly responsible for monitoring tool performance, data quality, and integration health. Without a named owner, accountability diffuses and problems get noticed only after they have caused significant attribution damage.
Create a simple scorecard for each tool in your stack that tracks four things: cost, active usage, data quality contribution, and integration health. Review this scorecard quarterly. A tool that has declining usage, contributes poor data quality, or has a broken integration should trigger an evaluation, not just a mental note.
Review your attribution data monthly to catch tracking gaps early. A conversion event that stopped firing after a website update, or an integration that broke after an ad platform API change, can go unnoticed for weeks if no one is checking. Early detection means smaller gaps in your data and faster course correction.
Apply a structured evaluation process before adding any new tool to your stack. Every proposed addition should be evaluated against your documented functional requirements. If a new tool does not address a gap on your requirements list, it should not be added. And if it does address a gap, it should replace an existing tool rather than simply being layered on top of what you already have.
Use the AI-driven insights available through your attribution platform to identify underperforming campaigns and channels on an ongoing basis. When your optimization decisions are grounded in revenue attribution data rather than surface-level metrics like impressions or clicks, you consistently allocate budget toward what is actually working.
Success indicator: You have a documented quarterly review cadence, a named stack owner, and a formal process for evaluating new tools before they are added. Your stack stays lean and connected over time.
Putting It All Together
Optimizing your martech stack is one of the highest-leverage investments a B2B SaaS marketing team can make. When your tools are connected, your tracking is reliable, and your attribution data flows cleanly from ad click to closed-won revenue, every campaign decision becomes sharper and every dollar of ad spend is more accountable.
The seven steps in this guide give you a repeatable framework. Audit what you have. Map your data flows. Define your requirements. Cut the noise. Implement server-side tracking. Unify your attribution reporting. And build a governance process to keep it all running.
Before you move forward, run through this quick checklist to confirm you have covered the essentials:
Full tool inventory completed: Every tool is documented with cost, owner, and usage status.
Customer journey data flows mapped: You know where data is captured, where it flows, and where it goes missing.
Core stack requirements defined: You have a prioritized list of functional requirements every tool must fulfill.
Redundant tools removed: Your stack has no duplicates and every tool connects to at least one other system.
Server-side conversion tracking implemented: Your key conversion events fire via server-side connections with strong match rates.
All channels connected to unified attribution reporting: You can see ad spend, pipeline, and revenue in one place.
Stack owner assigned: Someone is accountable for quarterly reviews and ongoing governance.
If you are ready to bring attribution accuracy to the center of your martech stack, Cometly connects your ad platforms, CRM, and website to give you a real-time view of what is driving pipeline and revenue. It captures every touchpoint, feeds enriched conversion data back to your ad platforms, and gives your team AI-driven recommendations to scale what is working. Get your free demo today and start building a martech stack that makes every ad dollar count.