Churn is one of the most expensive problems a B2B SaaS company can face. Every customer you lose erases the marketing spend, sales effort, and onboarding resources you invested to win them in the first place. It slows growth, strains pipelines, and quietly undermines the unit economics your business depends on.
The frustrating reality is that most churn is preventable. Not all of it, but enough that a data-driven approach can meaningfully move the needle. The problem is that most teams only see churn after it happens. A cancellation email arrives, the account goes dark, and the post-mortem begins too late to change the outcome.
When you know which customer segments are at risk, which acquisition channels bring in customers who actually stay, and which product behaviors predict cancellation, you can intervene before churn happens rather than reacting after the fact. That shift from reactive to proactive is entirely possible when you have the right data infrastructure and the right process for using it.
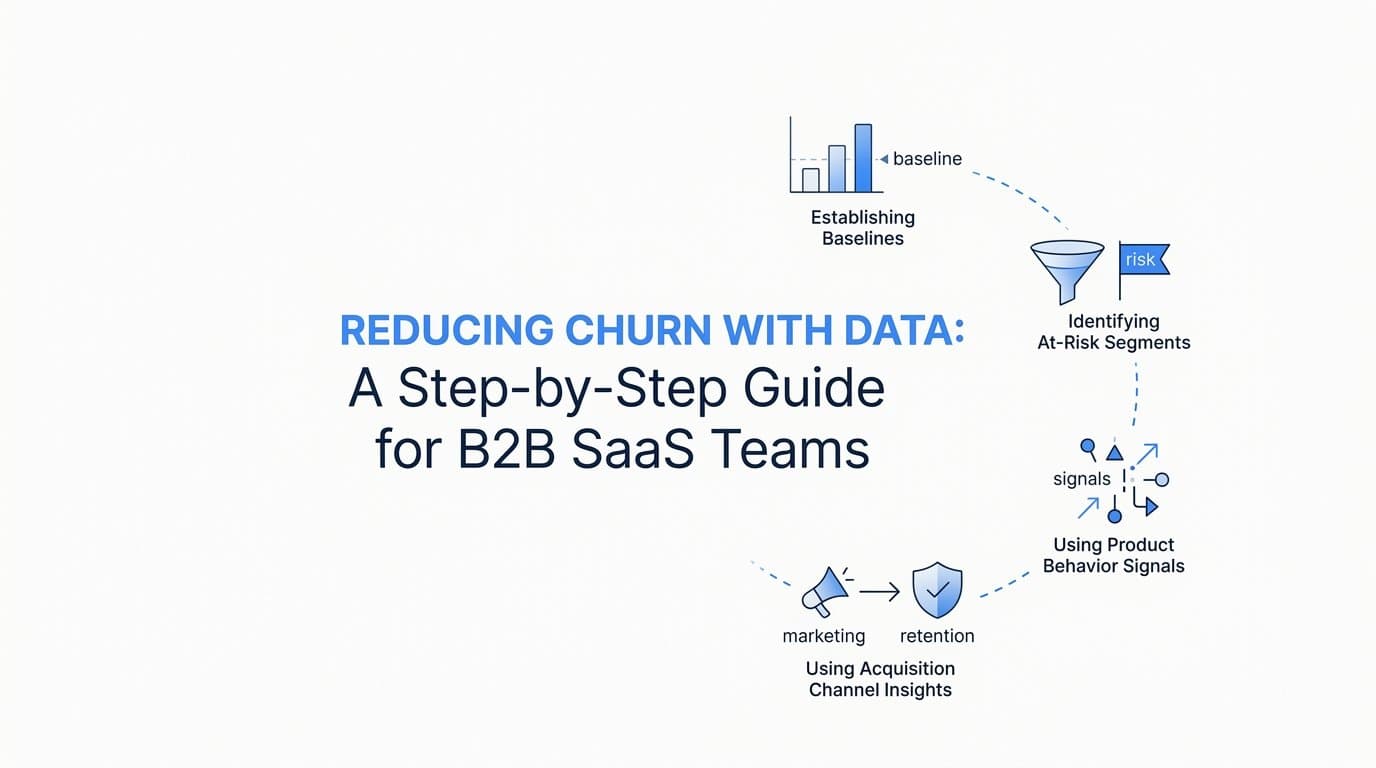
This guide walks you through a practical, sequential process for reducing churn with data in your B2B SaaS business. You will learn how to define your baseline metrics, trace churn back to its root causes in your acquisition data, map the customer journey to find drop-off points, build early warning systems, launch targeted retention campaigns, optimize spend toward high-retention channels, and measure your progress consistently.
Each step builds on the last. Whether you are a marketing leader trying to improve lead quality, a growth operator connecting acquisition data to downstream retention, or a founder who wants a single source of truth for customer health, this framework gives you a clear path forward. Let us start at the foundation.
Step 1: Define What Churn Means for Your Business and Set Baseline Metrics
Before you can reduce churn, you need to agree on what you are measuring. This sounds obvious, but it is one of the most commonly skipped steps, and it causes serious problems downstream. When marketing, sales, and customer success are each tracking a slightly different version of churn, you end up with conflicting reports, misaligned priorities, and no clear picture of whether things are getting better or worse.
Start by establishing a shared definition. Churn in B2B SaaS typically breaks down into a few distinct categories, and each one tells you something different.
Logo churn measures the number of customers you lose as a percentage of your total customer count. It tells you how many accounts are leaving.
Revenue churn measures the monthly or annual recurring revenue lost from churned accounts. A single enterprise customer churning can represent more revenue loss than dozens of smaller accounts, so logo churn alone can be misleading.
Voluntary churn happens when customers actively decide to cancel. This is usually a signal about product fit, value delivery, or competitive pressure.
Involuntary churn happens when payments fail due to expired cards or billing issues. This is often overlooked but can represent a meaningful portion of lost revenue, and it requires a completely different intervention than voluntary churn.
Once you have agreed on definitions, calculate your current monthly and annual churn rates so you have a baseline to measure against. Without a baseline, you cannot tell whether your retention efforts are working.
Next, connect churned accounts to their original contract values. This turns churn from an abstract percentage into a concrete revenue impact that leadership can act on. When you can say that a specific cohort of customers represented a specific amount of ARR lost, the conversation about investing in retention becomes much easier to have.
Finally, set a realistic churn reduction target based on your current rate and growth stage. Early-stage companies often have higher churn as they refine product-market fit. More mature companies should be trending toward tighter retention. Your target should be ambitious enough to matter but grounded in what is achievable given your current resources and data maturity.
Success indicator: Your entire team agrees on a single churn definition, you have a documented baseline rate, and you have set a measurable reduction target for the next 90 days.
Step 2: Audit Your Customer Acquisition Data to Find Churn-Prone Segments
Here is where reducing churn with data gets interesting. Most retention efforts focus entirely on what happens after a customer signs up. But churn often has its roots in who you acquired and how you acquired them. If your marketing campaigns are consistently attracting customers who are a poor fit for your product, no amount of customer success effort will fix that problem at scale.
Start by pulling acquisition source data for churned customers over the past six to twelve months. You want to look for patterns across channels, campaigns, and ad types. Were churned customers disproportionately acquired through a specific paid channel? Did a particular campaign or offer attract customers who left within 90 days? These patterns are often hiding in plain sight once you connect acquisition data to post-sale outcomes.
Next, segment churned customers by firmographic attributes. Look at company size, industry, and the role of the person who signed up. You may find that customers from certain industries churn at significantly higher rates, or that accounts where the initial contact was an individual contributor rather than a decision-maker tend to have shorter lifespans. These insights directly inform how you target and qualify prospects going forward.
Time-to-churn analysis is particularly revealing. Compare how long it takes customers from different acquisition channels to cancel. Customers who churn within the first 30 to 90 days are almost always signaling an acquisition quality problem rather than a product problem. They came in with the wrong expectations, or they were never a strong fit to begin with. When you see a channel consistently producing short-lived customers, that is a signal to investigate the messaging, targeting, and qualification criteria associated with that channel.
This is also where attribution data earns its value beyond the conversion event. Standard conversion tracking tells you which campaigns drove signups. Revenue attribution tells you which campaigns drove customers who actually stayed and generated positive ROI. If you are only optimizing for cost per acquisition, you may be rewarding campaigns that look efficient on paper but are quietly undermining retention.
Platforms like Cometly are built to make this connection explicit. By linking ad spend and campaign data directly to downstream customer outcomes, you can see which sources produce high-retention customers and which ones consistently bring in accounts that churn quickly. That visibility changes how you allocate budget and how you structure your targeting.
Success indicator: You can clearly identify two or three customer segments or acquisition sources that correlate with higher-than-average churn, giving you a concrete starting point for both retention efforts and acquisition optimization.
Step 3: Map the Customer Journey to Identify Drop-Off Points
Once you know which segments and channels are churn-prone, the next step is to understand why. The customer journey map is your diagnostic tool for answering that question. It traces the full path a customer takes from their first ad touchpoint through onboarding, activation, and eventual churn or renewal, and it reveals exactly where things go wrong.
Start by comparing the journeys of customers who churned against those who renewed. Look for the milestones and touchpoints that high-retention customers consistently hit and that churned customers consistently missed. Did churned customers skip a key onboarding step? Did they never reach the activation event that correlates with long-term engagement? Did they have fewer interactions with your team during the first 30 days?
Time-to-value is one of the most important variables to examine here. Customers who take longer to reach their first meaningful outcome tend to churn at higher rates. If your product delivers clear value quickly, customers build habits around it and become harder to displace. If the path to value is long or unclear, customers lose patience and start questioning whether they made the right decision.
Cross-referencing marketing touchpoints with product usage data adds another layer of insight. You may find that customers who engaged with a specific piece of content before signing up had better activation rates, or that customers who attended a live demo had longer average lifespans than those who converted from a self-serve trial. These patterns tell you which pre-sale touchpoints are setting customers up for success and which ones may be creating misaligned expectations.
Multi-touch attribution data is particularly useful here. If churned customers had significantly fewer touchpoints before converting, it may suggest they were not fully educated or qualified before they signed up. A customer who converts after one ad click and a free trial may have very different expectations than one who engaged with case studies, attended a webinar, and spoke with a sales rep before signing. Understanding this distinction helps you design better qualification processes and set more accurate expectations during the sales cycle.
The goal of this step is to draw a clear, evidence-based picture of what the journey of a high-churn customer looks like versus a high-retention customer. That picture becomes the foundation for everything that follows.
Success indicator: You have a documented comparison of churned versus retained customer journeys, with specific drop-off points and missed milestones identified.
Step 4: Build an Early Warning System Using Behavioral and Engagement Signals
The customer journey map tells you what the path to churn looks like in retrospect. The early warning system is what lets you catch customers on that path before they reach the end of it. This is the step that transforms your data work from diagnostic to proactive.
Start by defining three to five leading indicators of churn risk based on what you learned from the journey mapping exercise. Common signals include declining login frequency, reduced feature usage, shorter session lengths, and missed check-ins or renewal conversations. The right signals vary by product, but they should all share one quality: they appear weeks before a customer cancels, giving your team enough time to intervene.
Set up tracking and alerting for these signals so your customer success team is notified automatically when an account crosses a risk threshold. Waiting for a quarterly business review to discover that a customer has been disengaged for two months is too late. The alert system closes that gap.
Here is where many teams make a critical mistake: they rely exclusively on product data and ignore marketing and communication engagement signals. But marketing engagement often predicts churn weeks before product disengagement becomes visible. A customer who stops opening your product update emails, stops attending your webinars, and disengages from your content is sending a signal that their interest in your product is fading. That signal deserves the same attention as a drop in login frequency.
Layering these marketing engagement signals into your early warning system gives you a fuller picture of account health. Think of it as combining product health data with relationship health data. Together, they are far more predictive than either one alone.
Once you have your signals defined, create a simple churn risk score by weighting them and assigning each account a risk level. High, medium, and low risk tiers are sufficient for most teams starting out. The score does not need to be mathematically sophisticated to be useful. What matters is that it gives your team a clear, prioritized view of which accounts need attention right now.
Many customer success platforms support health scoring natively, and the best setups pull in data from multiple sources including your product analytics, CRM, and marketing platform to create a composite view.
Success indicator: Your team receives proactive alerts on at-risk accounts with enough lead time to intervene before customers reach the cancellation stage.
Step 5: Launch Targeted Retention Campaigns Based on Churn Risk Segments
With your early warning system in place, you now have the intelligence to run retention campaigns that are actually targeted rather than generic. The difference matters enormously. A broad re-engagement email sent to all at-risk customers is easy to ignore. A personalized outreach triggered by a specific behavioral signal, tailored to a specific customer segment, and delivered through the right channel is much harder to dismiss.
Start by creating distinct retention playbooks for different churn risk segments rather than sending the same message to everyone. A customer who has been with you for two years and recently reduced their feature usage needs a different conversation than a customer who is three months in and never completed onboarding. Segment your at-risk accounts by tenure, usage pattern, and acquisition source, and build playbooks that speak directly to each group's situation.
Your acquisition source data can inform personalization in ways that are often overlooked. Customers who came in through a specific campaign may have signed up with a particular use case or expectation in mind. Customers from organic search may have been researching a specific problem for months before converting. Customers from paid social may have responded to a particular message or offer. Using that context to shape your retention outreach makes the communication feel relevant rather than generic.
Retargeting campaigns are a powerful tool for reaching at-risk customers on the channels where they originally engaged. Using enriched first-party data, you can build audiences of at-risk accounts and serve them targeted ads that reinforce value, highlight underutilized features, or invite them to a training session. As third-party cookie deprecation continues to reshape digital advertising, first-party data enrichment becomes increasingly critical for making this kind of retargeting work effectively.
Test different intervention types and track which ones actually move the needle on retention. Executive outreach from a senior leader can be highly effective for at-risk enterprise accounts. Product training offers work well for customers who never fully activated. Feature spotlights that highlight capabilities the customer has not yet explored can reignite engagement for customers who have plateaued in their usage.
Feed conversion events from successful retention campaigns back to your ad platforms. When a customer who was at risk renews after a targeted intervention, that event is valuable optimization data. Platforms like Meta and Google can use those signals to improve targeting for future acquisition campaigns, creating a feedback loop between your retention efforts and your prospecting strategy.
Success indicator: At-risk accounts that receive targeted interventions show measurably better retention rates compared to similar accounts that do not receive outreach.
Step 6: Optimize Marketing Spend Toward Channels That Attract High-Retention Customers
Most marketing teams optimize for cost per acquisition. That metric is easy to calculate and easy to report. But in B2B SaaS, cost per acquisition is an incomplete measure of marketing ROI. A channel that delivers customers at a low acquisition cost but loses them within 90 days is not efficient. It is expensive, just in a way that does not show up until later.
The more meaningful metric is the cost to acquire a customer who stays. When you connect attribution data to renewal and expansion revenue, you can calculate true channel ROI over the customer lifetime rather than just at the point of conversion. That calculation often reshapes which channels look attractive and which ones look like they are quietly burning budget.
Start by using your revenue attribution data to rank channels and campaigns by the lifetime value of the customers they produce. You may find that a channel with a higher cost per acquisition consistently delivers customers who renew at higher rates and expand their contracts over time. You may also find that a channel with a low cost per acquisition is your largest source of 90-day churners. Both of those insights have direct implications for where you should be spending.
Once you have identified your highest-retention acquisition sources, build lookalike audiences based on the firmographic and behavioral profiles of those customers. Lookalike audiences built from high-retention or high-LTV customers tend to produce better quality leads than those built from raw conversion data, because they are optimized for the characteristics that predict long-term value rather than just initial interest.
Shift budget toward these higher-quality channels and away from channels that consistently produce short-lived customers, even if those channels have strong top-of-funnel metrics. This is a conversation that requires alignment between marketing and leadership, which is why reporting on pipeline quality alongside volume metrics is so important. When leadership can see both the number of customers acquired and the retention rate of those customers by channel, the case for reallocating budget becomes much clearer.
Cometly is designed to make this kind of analysis straightforward. By connecting ad spend data directly to pipeline and revenue outcomes, including renewal and expansion events, you can calculate true channel ROI and make budget decisions based on what actually drives long-term growth rather than what looks good in a top-of-funnel dashboard.
Success indicator: Your cost to acquire a customer who stays for twelve or more months decreases over time as you shift spend toward higher-quality channels and refine your targeting using retention data.
Step 7: Measure, Report, and Iterate on Your Churn Reduction Efforts
The steps above give you a framework for reducing churn with data. This final step is what turns that framework into a continuous discipline rather than a one-time project. Churn patterns evolve as your product changes, your market shifts, and your customer base grows. The measurement and reporting system you build here is what keeps your retention strategy current and effective over time.
Set up a monthly churn review that brings together marketing, sales, and customer success around a shared set of metrics. The review should cover acquisition source analysis, segment-level churn rates, retention campaign performance, and updates to your early warning signal thresholds. Having all three teams in the room ensures that insights from customer success inform marketing decisions and vice versa.
Track leading indicators alongside lagging indicators. Your monthly churn rate is a lagging indicator. It tells you what already happened. Your churn risk scores, engagement signal trends, and retention campaign response rates are leading indicators. They tell you what is likely to happen. Monitoring both gives you the ability to spot whether your interventions are working before the monthly churn number updates.
Create a shared dashboard that all three teams use as their primary reference point for customer health and retention performance. When marketing, sales, and customer success are each working from different data sources, you get misaligned priorities and duplicated effort. A single source of truth eliminates that friction and makes cross-functional collaboration much more productive.
Run regular retrospectives on churned accounts to identify new patterns and update your early warning signals accordingly. The signals that predicted churn six months ago may not be the most predictive signals today. As your product evolves and your customer base changes, your early warning system needs to evolve with it.
Continuously refine your ideal customer profile based on what the retention data reveals about who stays and who leaves. Over time, this data becomes one of your most valuable strategic assets. It tells you exactly what kind of customer your product is built to serve well, and that clarity should inform everything from your targeting criteria to your sales qualification process to your product roadmap.
Success indicator: Churn rate trends downward over a rolling 90-day period, and your team can attribute specific improvements to specific data-driven interventions rather than to chance or seasonality.
Putting It All Together
Reducing churn with data is not a one-time project. It is an ongoing discipline that requires your marketing, sales, and customer success teams to work from the same accurate, connected data. The steps in this guide give you a clear sequence to follow: define your baseline, audit your acquisition data, map the customer journey, build early warning systems, launch targeted retention campaigns, optimize spend toward high-retention channels, and measure everything consistently.
The common thread across all of these steps is having reliable, connected data that links your ad spend and acquisition sources to actual customer outcomes. Without that connection, you are making retention decisions in the dark. You may be investing heavily in customer success while your marketing campaigns continue to funnel in poor-fit customers. You may be running re-engagement campaigns without knowing which channels those customers originally came from. You may be reporting on churn without being able to explain what is driving it.
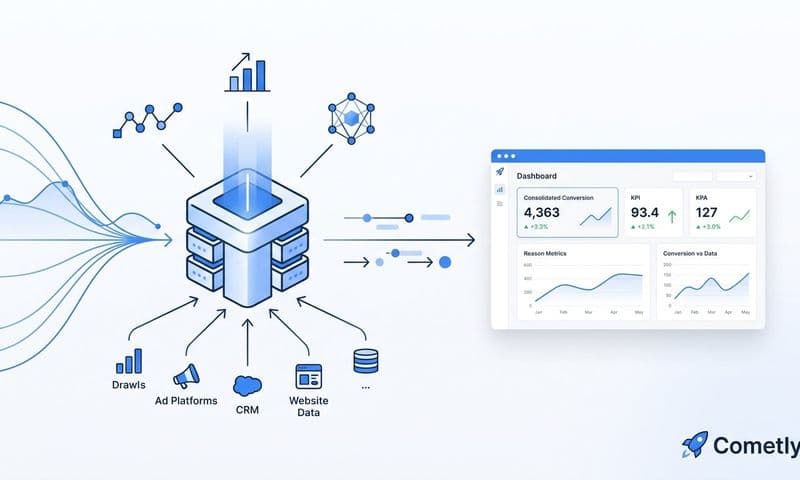
Cometly helps B2B SaaS teams close that gap. By connecting ad platforms, CRM data, and website behavior into a single source of truth, Cometly gives you the visibility to see which campaigns attract customers who stay, which touchpoints predict long-term retention, and where to shift budget to improve ROI over the full customer lifetime.
If you are ready to start using data to reduce churn and improve the quality of your customer acquisition, Get your free demo today and see how Cometly can give your team the attribution clarity it needs to make better decisions at every stage of the customer lifecycle.