

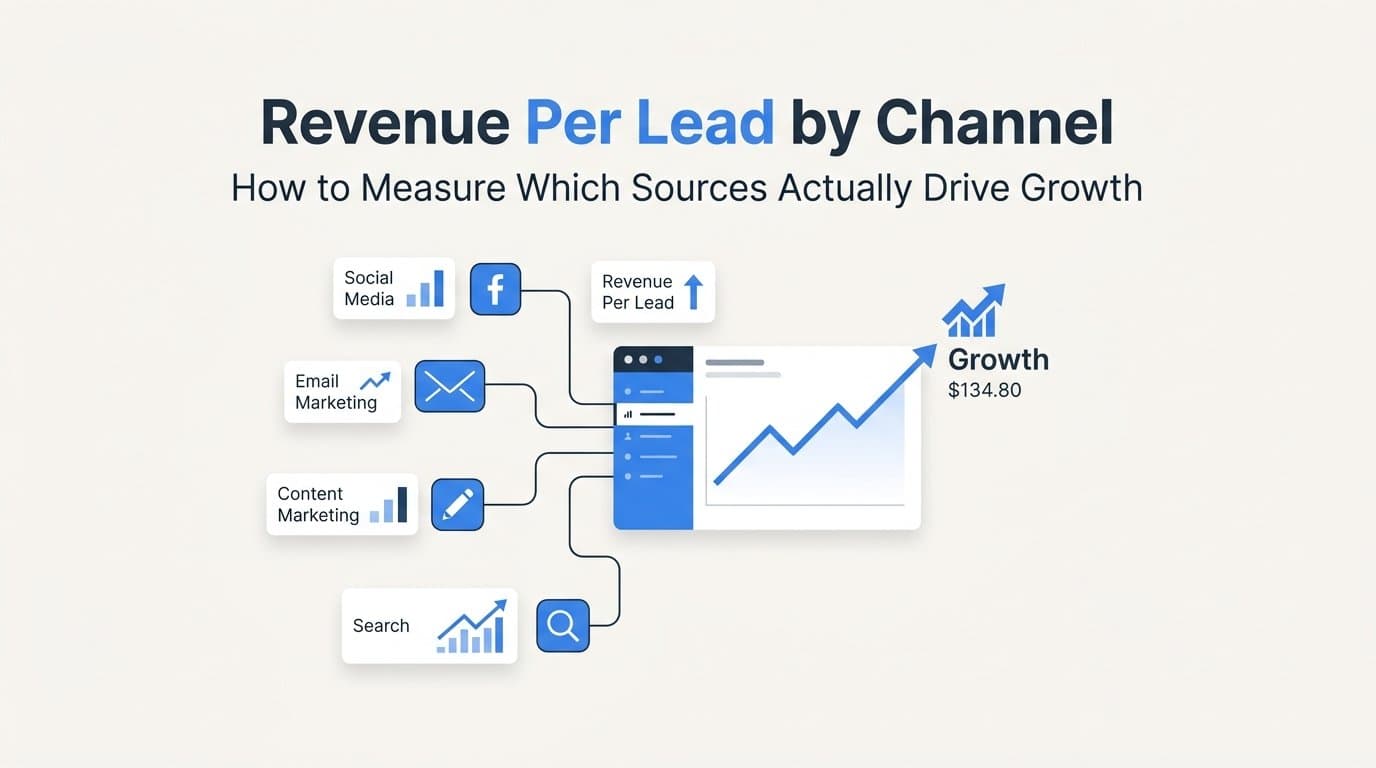
You're generating leads. Your pipeline looks active. Your team is busy. But when the quarter closes and you map revenue back to your marketing channels, the picture gets murky fast. Which channels actually drove closed revenue? Which ones filled your CRM with noise? If you can't answer those questions with confidence, you're not alone.
This is one of the most common frustrations in B2B SaaS marketing: plenty of lead volume, very little visibility into which sources are actually producing revenue. Most teams default to cost per lead as their primary channel metric because it's easy to calculate and readily available in every ad platform dashboard. The problem is that cost per lead tells you almost nothing about what happens after a lead enters your funnel.
Revenue per lead by channel is the metric that closes that gap. It connects your top-of-funnel marketing activity directly to bottom-of-funnel business outcomes, giving you a clear view of which channels are generating growth versus which ones are generating activity. This article walks you through what the metric means, how to calculate it accurately, and how to use it to make smarter budget and campaign decisions.
Why Cost Per Lead Alone Is Misleading Your Marketing Decisions
Cost per lead has one significant flaw: it treats every lead as if it has equal value. In reality, a lead from a branded search campaign and a lead from a broad awareness-stage social campaign are fundamentally different assets, even if they fill out the same form.
Think about what happens after the lead is captured. One lead schedules a demo immediately, moves through the pipeline in six weeks, and closes at your target deal size. Another lead goes quiet after the first outreach, requires five follow-up touches, and eventually churns after a discounted trial. Your ad platform reported both as conversions at the same cost. Your CRM shows both as leads. But only one of them contributed to revenue.
When marketing teams optimize purely for cost per lead, they often inadvertently shift budget toward channels that generate high volumes of low-intent prospects. These leads look great on a dashboard but create real problems downstream: sales teams spend time on unqualified opportunities, pipeline velocity slows, and close rates drop. The cost shows up in the sales budget, not the marketing budget, which makes the problem easy to overlook.
There's also the deal size dimension. In B2B SaaS, different channels tend to attract buyers at different stages of the decision-making process, and those buyers often have different budgets and organizational contexts. A lead from a high-intent search query may represent a decision-maker actively evaluating solutions with budget already approved. A lead from a social retargeting campaign may be an early-stage researcher who is months away from a purchase decision.
The missing link in most marketing measurement frameworks is the connection between lead source and downstream revenue. Without that connection, budget decisions are based on incomplete information. You might be reducing spend on a channel that produces fewer leads but closes at a much higher rate, while increasing spend on a channel that floods your CRM with contacts who never convert. Cost per lead, without revenue context, points you in the wrong direction.
This is why revenue per lead by channel matters. It reframes the question from "which channel is cheapest?" to "which channel is most valuable?"
What Revenue Per Lead by Channel Actually Measures
Revenue per lead by channel is a downstream marketing metric that answers a specific question: for every lead a given channel generates, how much closed revenue does that channel ultimately produce?
The core definition is straightforward. Take the total closed revenue attributed to a channel over a defined period and divide it by the total number of leads that channel generated during the same period. The result is a single number that represents the average revenue value of each lead from that source.
It's worth distinguishing this metric from several related measurements that serve different purposes. Return on ad spend (ROAS) measures revenue relative to ad spend, which tells you about efficiency but doesn't isolate lead quality as a variable. Cost per acquisition measures how much you spend to generate a customer, which is useful but doesn't account for differences in deal size. Pipeline contribution shows how much of your pipeline originated from a channel, but pipeline is a leading indicator, not a revenue outcome.
Revenue per lead by channel is specifically a lagging indicator. It requires waiting for deals to close before you can calculate it accurately, which means it reflects real business outcomes rather than projections. This makes it more reliable for budget decisions, even though it requires more patience to collect.
The metric also has an important relationship with close rate and average deal size. A channel with a high revenue per lead figure is typically producing one or both of the following: leads that close at a higher rate, or leads that close at a larger deal size. Understanding which of these is driving the number helps you make better targeting decisions within that channel.
Calculating this metric accurately requires connecting three data systems that many marketing teams still treat as separate: ad platform data that tracks lead source, CRM data that tracks lead progression and opportunity outcomes, and revenue data that records closed deal values. Without all three connected, you're working with an incomplete picture.
This is precisely why many teams default to cost per lead. It only requires ad platform data. Revenue per lead by channel requires an integrated attribution infrastructure, which is more work to set up but produces fundamentally more useful information for growth decisions.
How to Calculate Revenue Per Lead for Each Marketing Channel
The formula itself is simple. Revenue per lead equals total closed revenue from a channel divided by total leads from that channel. The complexity lies in getting the inputs right.
Here's a breakdown of what you need to calculate this accurately for each channel in your mix.
Lead source tagging: Every lead that enters your system needs to be tagged with its originating channel at the moment of capture. This typically happens through UTM parameters on your landing page URLs, which pass source data into your CRM or marketing automation platform. Consistent tagging is non-negotiable. If some leads are tagged and others aren't, your channel-level calculations will be incomplete and potentially misleading.
CRM opportunity tracking: Your CRM needs to preserve the original lead source through every stage of the pipeline. Many CRMs can do this natively, but it requires proper configuration. If your CRM doesn't carry lead source data from the contact record to the opportunity record, you'll lose the ability to connect closed revenue back to its originating channel.
Closed-won revenue data: You need actual closed revenue figures tied to each opportunity, not just deal stage or pipeline value. This means integrating your CRM with your billing system or revenue source. For many B2B SaaS companies, this means connecting Stripe or a similar payment platform to ensure that recognized revenue, not just contract value, is reflected in the calculation.
Time window selection: This is where B2B SaaS adds meaningful complexity. If your average sales cycle is 90 days, a lead generated in January may not close until April. If you measure revenue per lead on a monthly basis without accounting for this lag, you'll systematically undervalue channels that produce leads earlier in the sales cycle. The time window for your calculation should be long enough to capture the full sales cycle for a meaningful percentage of leads.
The multi-touch attribution challenge adds another layer. In most B2B SaaS buying journeys, a single lead interacts with multiple channels before converting. They might discover you through an organic search result, see a retargeting ad on LinkedIn, attend a webinar, and then respond to a sales email before closing. Which channel gets credit for the revenue?
The answer depends on your attribution model, and different models produce different revenue per lead figures for the same channels. A first-touch model gives all the credit to organic search. A last-touch model gives it to email. A multi-touch model distributes credit across all four touchpoints. Each tells a different story, and understanding how your chosen model shapes the numbers is essential before drawing conclusions.
Channel-by-Channel Breakdown: What Patterns to Expect
Different channel types tend to attract buyers at different stages of awareness and readiness, which creates predictable patterns in revenue per lead figures across a typical B2B SaaS marketing mix. These are general behavioral patterns based on how buyers engage with different channels, not universal rules, but they're useful benchmarks as you build your own channel-level data.
Paid search (branded and high-intent non-branded): Paid search campaigns targeting branded keywords or high-intent solution queries tend to capture buyers who are already in evaluation mode. These leads often have shorter sales cycles and higher close rates because they're actively looking for what you offer. Revenue per lead figures from this channel are frequently strong, though the cost per lead may also be higher due to competitive bidding.
Paid social (Facebook, Instagram, LinkedIn): Paid social channels are typically used to reach audiences who aren't yet actively searching for a solution. This makes them effective for building awareness and generating volume, but it also means the leads produced often require longer nurture cycles before they're ready to buy. Revenue per lead figures from paid social may be lower than paid search, not because the channel is ineffective, but because the leads are earlier in their buying journey. The key is measuring over a long enough time window to capture the full nurture cycle.
Organic search: Leads that arrive through organic search have typically done meaningful research before reaching your site. They've searched for something specific, found your content relevant, and engaged enough to convert. This self-selection process often correlates with stronger close rates and solid revenue per lead figures. Organic is also worth tracking as a benchmark because it reflects the quality of leads you attract when buyers come to you on their own terms.
Referral and partner channels: Referral leads frequently show strong revenue per lead values because they arrive with a layer of social proof already established. A recommendation from a trusted peer or integration partner reduces the skepticism a new buyer typically brings. These leads often move through the pipeline faster and with less friction from the sales team.
Direct traffic: Direct traffic in your analytics often represents a mix of brand-aware visitors who typed your URL directly, return visitors, and traffic that was misattributed due to tracking gaps. Revenue per lead from direct can be high, but it requires careful interpretation because the source is often ambiguous.
Understanding these patterns helps you set realistic revenue per lead expectations for each channel and avoid making premature budget cuts based on short-term data.
Using Attribution Models to Get Accurate Channel Revenue Data
The attribution model you choose doesn't just affect how credit is distributed. It directly changes the revenue per lead figure you see for every channel in your mix. Getting this right is one of the most important decisions in your measurement framework.
First-touch attribution assigns all revenue credit to the first channel a lead interacted with before entering your funnel. This model is useful for understanding which channels are best at generating initial awareness and bringing new buyers into your orbit. However, it systematically overstates the value of top-of-funnel channels and ignores everything that happened between first contact and closed revenue. If you use first-touch to calculate revenue per lead, your awareness channels will look disproportionately valuable compared to channels that played a critical role in nurturing and closing.
Last-touch attribution does the opposite. It assigns all revenue credit to the final channel a lead interacted with before converting. This model rewards channels that are good at closing but ignores the channels that built awareness and trust earlier in the journey. Using last-touch to calculate revenue per lead will make bottom-of-funnel channels like branded search and sales email look like your best performers, even if they only succeeded because earlier touchpoints did the groundwork.
Multi-touch attribution distributes revenue credit across all the touchpoints a lead engaged with before converting. This produces a more balanced view of each channel's contribution and is generally more useful for calculating revenue per lead in B2B SaaS contexts where sales cycles are long and involve multiple interactions. The specific distribution logic varies: linear attribution gives equal credit to every touchpoint, while time-decay models give more credit to touchpoints closer to conversion. The right model depends on your sales process and what decisions you're trying to inform.
Beyond model selection, data completeness is a critical factor. Browser-based tracking using pixels increasingly misses touchpoints due to ad blockers, browser privacy restrictions, and the ongoing impact of iOS privacy changes. When touchpoints go untracked, your attribution data has gaps, and those gaps distort your revenue per lead calculations by making some channels appear less influential than they actually are.
Server-side tracking and Conversion API integrations address this problem directly. By sending conversion events from your server rather than the user's browser, you capture interactions that client-side tracking misses. Meta's Conversion API and Google's Enhanced Conversions are both designed to improve signal quality in exactly this way. The result is more complete touchpoint data, which produces more accurate attribution, which in turn makes your revenue per lead calculations more reliable and actionable.
Turning Revenue Per Lead Data Into Budget and Campaign Decisions
Once you have revenue per lead benchmarks by channel, the data becomes a practical tool for reallocation decisions rather than just a reporting metric.
The most direct application is budget reallocation. If Channel A has a cost per lead of $200 and a revenue per lead of $4,000, while Channel B has a cost per lead of $80 and a revenue per lead of $900, the math is clear even though Channel B looks cheaper at first glance. Optimizing for cost per lead would push budget toward Channel B. Optimizing for revenue per lead would push budget toward Channel A. These are opposite decisions with very different revenue implications.
Setting channel-level revenue per lead targets gives your team a clear performance standard to work toward. Start with your average deal size and your overall close rate as anchors. If your average deal size is $15,000 and your overall close rate is 20%, your baseline revenue per lead across all channels is $3,000. Channels performing above that benchmark are generating above-average value. Channels performing below it deserve scrutiny about whether the gap is due to lead quality, nurture effectiveness, or sales alignment.
Revenue per lead data also enables faster campaign iteration. Rather than waiting for quarterly reviews to assess channel performance, teams that monitor this metric continuously can identify shifts in lead quality much earlier. If a channel's revenue per lead starts declining while its lead volume holds steady, that's a signal worth investigating before the problem compounds across a full quarter of budget spend.
The metric also creates better alignment between marketing and sales. When marketing teams can show which channels are producing the highest-value leads, sales teams can prioritize their outreach accordingly. And when both teams are looking at the same revenue-level data, conversations about lead quality become more grounded in shared evidence rather than competing interpretations of different metrics.
Putting It All Together
Revenue per lead by channel is the metric that separates marketing teams making data-informed decisions from those optimizing for volume. It requires more infrastructure to calculate than cost per lead, but the payoff is a clear view of which channels are actually driving business growth versus which ones are generating activity without outcomes.
The steps are straightforward once you understand them. Define the formula. Connect your data sources: ad platforms, CRM, and closed revenue. Apply an attribution model that reflects how your buyers actually move through the funnel. Use the output to guide budget allocation and campaign decisions on a continuous basis rather than a quarterly one.
Cometly is built specifically to make this possible. It connects your ad platform data, CRM events, and revenue data, including Stripe integration, into a single real-time attribution view. With support for multi-touch attribution, server-side tracking, and Conversion API integrations, Cometly captures the complete customer journey and gives you accurate revenue per lead data by channel without requiring manual data stitching across disconnected systems. Its AI-driven recommendations surface which channels and campaigns are actually driving revenue, so your team can act on insights rather than spend time chasing data.
If your marketing decisions are still being driven by cost per lead, you're working with an incomplete picture. Get your free demo today and start tracking revenue per lead by channel with the attribution infrastructure your growth decisions actually require.



