

Most B2B SaaS teams have a decent handle on their pipeline size. They know how many deals are open, roughly what those deals are worth, and which stage each one sits in. What they often cannot tell you is how fast those deals are actually moving toward closed revenue. That gap between pipeline visibility and revenue predictability is exactly where pipeline velocity lives.
Pipeline velocity is the metric that connects deal activity to forecasted revenue output. Instead of asking "how much pipeline do we have?", it asks a more useful question: "how quickly is that pipeline converting into money?" The answer gives marketing and sales teams a single, time-sensitive number that reflects the real health of their revenue engine.
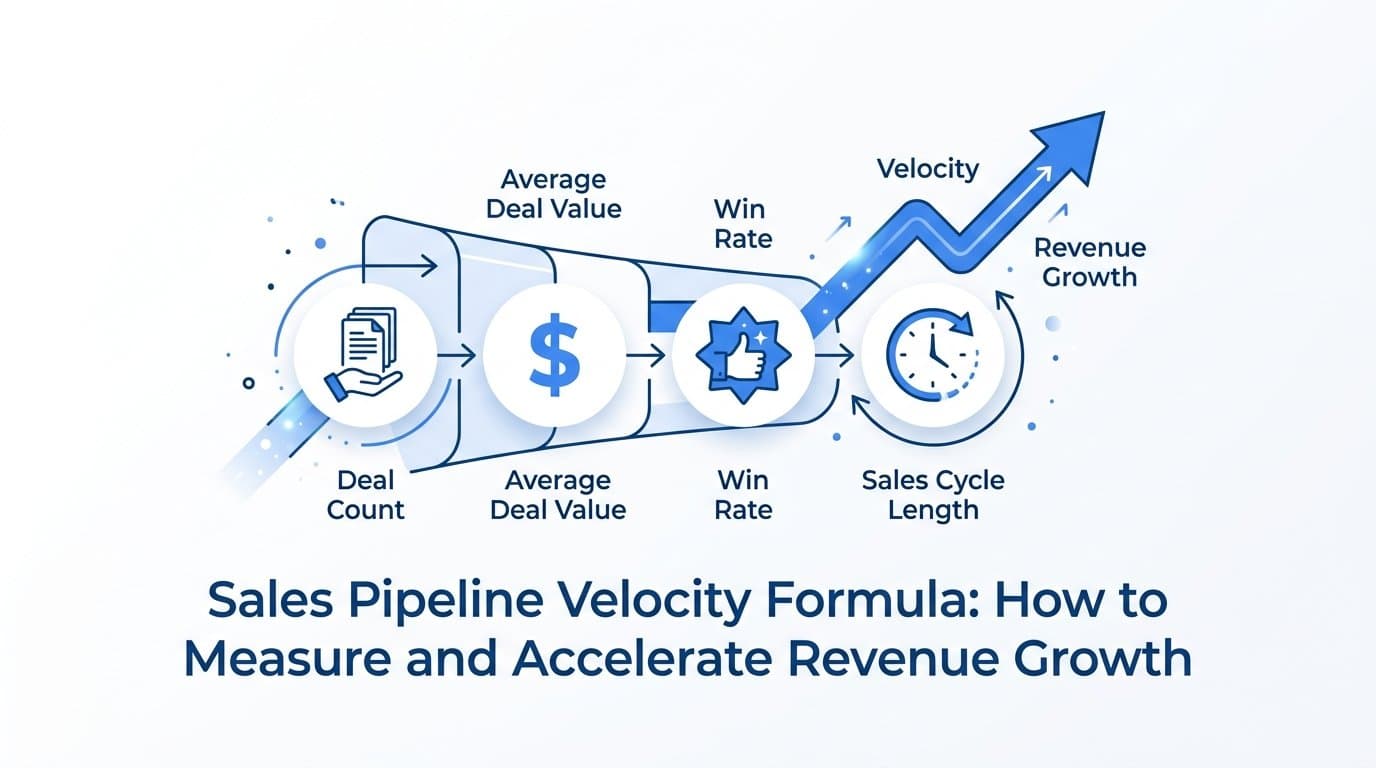
The formula itself draws on four variables that most teams already track in some form. The challenge is that those variables rarely get combined into one actionable calculation, and even more rarely get traced back to their marketing origins. This guide walks through how the sales pipeline velocity formula works, how to calculate it accurately, and how marketing data quality determines whether your velocity number is trustworthy or misleading.
The Four Variables That Drive Pipeline Velocity
The sales pipeline velocity formula looks like this:
Pipeline Velocity = (Number of Opportunities x Average Deal Value x Win Rate) / Average Sales Cycle Length
Each element of this formula is a lever, not just a measurement. Adjusting any single variable creates a compounding effect on the final output, which is why understanding each one individually matters before you try to optimize the whole.
Number of Opportunities: This is the count of active, qualified deals in your pipeline at a given point in time. The keyword here is qualified. Deals that have stalled, gone dark, or were never properly vetted inflate this number and distort your velocity score. A clean opportunity count reflects real buying intent, not just logged activity.
Average Deal Value: This is the average contract value across your open opportunities. It is influenced heavily by who you are attracting into the pipeline. When marketing targets the right ICP segments, the average deal value tends to rise naturally because better-fit prospects tend to buy more complete solutions. When targeting is loose, smaller or mismatched deals drag this number down.
Win Rate: This is the percentage of opportunities that close as won. Win rate is sensitive to lead quality, sales process consistency, and how well-prepared reps are when they enter a conversation. Marketing can influence win rate by ensuring that prospects arrive with relevant context, prior engagement with your content, and a clearer understanding of the problem your product solves.
Average Sales Cycle Length: This is measured in days from opportunity creation to close. Shorter cycles increase velocity directly. Marketing plays a meaningful role here through nurture sequences, intent-based content, and early objection handling. When a prospect has already consumed content that addresses their key concerns, the sales conversation moves faster.
Notice that marketing directly influences at least three of these four variables. Opportunity volume comes from top-of-funnel campaigns. Deal value is shaped by ICP targeting and lead quality. Sales cycle length is affected by how well marketing prepares prospects before they ever speak with a rep. Pipeline velocity is not purely a sales metric. It is a shared outcome that marketing helps determine.
Calculating Pipeline Velocity: A Step-by-Step Walkthrough
Let's walk through a hypothetical calculation so you can see exactly how the math works and replicate it with your own numbers.
Imagine your team has the following data for a given quarter:
Number of Opportunities: 80 qualified deals in the pipeline
Average Deal Value: $12,000
Win Rate: 25% (expressed as 0.25 in the formula)
Average Sales Cycle Length: 45 days
Plug those numbers into the formula:
Pipeline Velocity = (80 x $12,000 x 0.25) / 45
Pipeline Velocity = $240,000 / 45
Pipeline Velocity = $5,333 per day
That result means your pipeline is generating approximately $5,333 in revenue per day. Whether that number is healthy depends on your business targets. If your monthly revenue goal is $200,000, a daily velocity of $5,333 puts you on track. If the goal is $400,000, you have a velocity problem that needs to be addressed at the formula level.
The real power of this calculation comes from tracking it consistently over time. A rising velocity score signals that your pipeline is becoming more efficient. A falling score, even when pipeline volume looks fine, is an early warning that something is breaking down upstream.
There are several data quality mistakes that produce misleading velocity scores. The most common is including stalled or zombie deals in your opportunity count. Deals that have had no activity in 60 or 90 days but were never formally disqualified artificially inflate the numerator and make your velocity look stronger than it is. A clean velocity calculation requires a disciplined process for disqualifying deals that are no longer moving.
Another common error is using win rates calculated on incomplete close data. If your team has a habit of leaving deals in "open" status long after they have effectively gone cold, your win rate denominator is understated, and the resulting percentage looks higher than reality. Accurate velocity requires accurate pipeline hygiene.
Why Your Velocity Number Lies Without Accurate Attribution
Here is a problem that many revenue teams run into: the velocity formula looks clean on paper, but the inputs feeding it are quietly corrupted by attribution gaps. When you cannot accurately trace which campaigns, channels, or ads produced each opportunity in your pipeline, two of your four variables become unreliable.
The opportunity count is the most vulnerable. If your team is logging pipeline entries without consistent lead source data, you lose the ability to distinguish which opportunities came from high-intent paid search, which came from organic content, and which came from outbound sequences. All of those deals get lumped into a single undifferentiated count. The velocity score you calculate is technically correct but practically useless for making channel-level decisions.
Win rate faces a similar problem. If your CRM shows that 25% of opportunities close as won, but you cannot segment that win rate by lead source, you have no way to know whether your paid social leads are closing at 15% or 40%. Those two scenarios call for completely different marketing strategies, but a blended win rate masks the difference entirely.
The attribution gap between ad platforms and CRM data makes this worse. Ad platforms report conversions based on their own attribution windows, which often do not align with how your CRM records pipeline creation. A campaign might show 50 conversions in the ad platform dashboard, but only 20 of those contacts ever became a CRM opportunity. Without a system that connects ad click data to downstream pipeline events, you are working with two separate data sets that do not tell a coherent story.
This is where multi-touch attribution becomes directly relevant to velocity accuracy. When you know which channels and campaigns produced each opportunity, you can segment your velocity calculation by source. You might discover that opportunities sourced from a specific content channel close faster and at higher values than opportunities from a high-volume paid campaign. That insight is invisible when you rely on blended, platform-reported data.
Accurate attribution is not just a marketing measurement exercise. It is the infrastructure that makes pipeline velocity a reliable decision-making tool rather than a number that looks good in a slide deck but cannot actually guide budget or strategy decisions.
Segmenting Velocity by Channel, Campaign, and Lead Source
A single blended velocity number tells you how your pipeline is performing on average. It does not tell you which parts of your marketing engine are accelerating revenue and which are dragging it down. That distinction only becomes visible when you segment velocity by channel, campaign, and lead source.
Think about what a segmented view reveals. Organic search might generate fewer opportunities per month than paid social, but if those organic opportunities close at a higher win rate and in fewer days, their contribution to revenue velocity could be significantly stronger. If you are only looking at raw lead volume or cost per lead, you would never see that dynamic. You might even cut investment in organic in favor of scaling paid, which would slow your overall velocity while appearing to improve pipeline numbers.
Segmenting velocity by lead source forces a more honest conversation about marketing ROI. The question shifts from "which channel generates the most leads?" to "which channel generates the fastest-moving, highest-value pipeline?" Those are very different questions, and they often produce very different answers.
This segmentation also surfaces insights at the campaign level. Within a single channel like LinkedIn, some campaigns might produce opportunities that stall repeatedly at the proposal stage, while others produce opportunities that move through evaluation quickly. Campaign-level velocity data helps you understand not just which ads are getting clicks, but which ads are attracting the kind of buyers who are actually ready to buy.
The strategic implication is what some revenue teams call velocity-weighted budget allocation. Instead of distributing spend based on volume metrics like impressions, clicks, or even lead count, you shift budget toward channels where velocity is highest. You are essentially investing more in the parts of your marketing mix that generate revenue fastest, rather than the parts that generate the most activity.
Executing this kind of segmentation requires reliable attribution data at the opportunity level. Every deal in your CRM needs a traceable origin that connects back to specific campaigns and channels, not just a generic "web" or "inbound" source label. Without that granularity, velocity segmentation is not possible, and budget decisions default back to volume-based thinking.
Practical Ways to Improve Each Variable in the Formula
Understanding the formula is useful. Knowing how to move each variable in the right direction is where the real work happens. Here is how to approach each lever with intention.
Improving Opportunity Count Through Quality, Not Volume: The instinct in many marketing teams is to push more leads into the pipeline. But adding low-probability opportunities to the count does not increase velocity. It dilutes it. A better approach is to use intent signals, ICP scoring, and tighter channel targeting to ensure that only deals with genuine buying potential enter the pipeline in the first place. Fewer, better-qualified opportunities produce a higher velocity score than a bloated pipeline full of deals that will never close.
Raising Average Deal Value Through Targeting Precision: Deal value is largely a function of who you are attracting. If your campaigns are pulling in companies that are too small, too early-stage, or outside your core ICP, the average deal value will reflect that mismatch. Tightening audience definitions, using firmographic filters in paid campaigns, and prioritizing segments where your product delivers the most value are all ways to lift this variable over time.
Increasing Win Rate Through Better Handoff Quality: One of the most underrated levers for win rate is the quality of context that passes from marketing to sales when a lead becomes an opportunity. When a sales rep receives a lead with a complete picture of that prospect's journey, including which pages they visited, which content they engaged with, which ads they clicked, and which emails they opened, the first conversation is more relevant and more efficient. That context accelerates trust-building and reduces the time reps spend diagnosing problems the prospect has already signaled through their behavior.
Shortening Sales Cycle Length Through Journey-Informed Content: Use customer journey data to identify where deals stall most often. Is it during the evaluation stage when prospects are comparing solutions? Is it at the proposal stage when budget conversations start? Once you know where friction concentrates, you can design targeted content or outreach sequences that address those specific objections before they become delays. A well-timed case study, a comparison guide, or a targeted email sequence can move a stalled deal forward faster than a follow-up call that arrives without context.
The compounding effect is real. Improving each variable by a modest amount does not produce a modest improvement in velocity. Because the formula multiplies the top three variables together before dividing, even small gains across multiple levers can produce a meaningfully higher daily revenue output. That is why pipeline velocity is worth tracking closely rather than treating as a one-time calculation.
Pipeline Velocity as a Marketing Performance Signal
There is a persistent framing problem in B2B SaaS marketing: pipeline velocity gets categorized as a sales metric. It shows up in sales QBRs and revenue operations dashboards, but rarely in marketing performance reviews. That framing misses something important. Marketing controls the quality and source of the inputs that determine what the formula outputs. Reframing velocity as a marketing metric changes how teams measure their own impact.
When marketing reports on lead volume or cost per click, those numbers exist in isolation from revenue outcomes. A campaign that generates 500 leads at a low cost per lead looks like a success until you check the pipeline and discover that none of those leads became qualified opportunities. Pipeline velocity provides a more honest performance signal because it connects marketing activity to the speed at which revenue is actually being generated.
Connecting ad spend data to pipeline velocity allows marketing teams to answer a question that most CMOs struggle to answer clearly: what is our marketing investment doing to accelerate revenue? Not "how many leads did we generate?" but "are the leads we generated moving through the pipeline faster or slower than last quarter, and which campaigns are responsible for the difference?"
This is where platforms like Cometly become directly relevant. Cometly connects ad platforms, CRM events, and conversion data into a unified view, giving marketing teams the accurate, real-time inputs they need to track and improve pipeline velocity by source. Instead of reconciling data across disconnected tools, marketing teams get a single source of truth that links ad spend to pipeline outcomes. They can see which campaigns are producing fast-moving, high-value opportunities and which are generating volume without velocity.
Cometly also feeds enriched conversion data back to ad platforms like Meta and Google, improving the quality of signals those platforms use for targeting and optimization. Better targeting means better-fit leads, which means higher win rates and shorter sales cycles. Every part of the velocity formula benefits when the underlying data is clean, connected, and flowing in real time.
Putting It All Together
Pipeline velocity is only as useful as the data feeding it. The formula itself is straightforward, but the inputs require discipline: clean opportunity counts, accurate win rates, reliable deal values, and honest sales cycle measurements. When those inputs are corrupted by stale deals, inconsistent CRM hygiene, or attribution gaps, the resulting velocity score becomes a misleading comfort rather than a useful signal.
The teams that get the most value from this metric are the ones that treat it as a shared responsibility between marketing and revenue operations. Marketing shapes three of the four variables in the formula. That means marketing decisions about targeting, channel mix, content strategy, and lead handoff quality have a direct and measurable effect on how fast pipeline converts to revenue.
Segmenting velocity by channel and campaign source turns a single blended number into a genuinely actionable tool for budget allocation and strategy refinement. And accurate multi-touch attribution is the infrastructure that makes that segmentation possible.
If your team is ready to connect ad spend data to pipeline and revenue outcomes with the accuracy that velocity tracking requires, explore what Cometly can do for your marketing measurement. Get your free demo and start capturing every touchpoint to build a clearer, faster path from campaign activity to closed revenue.



