

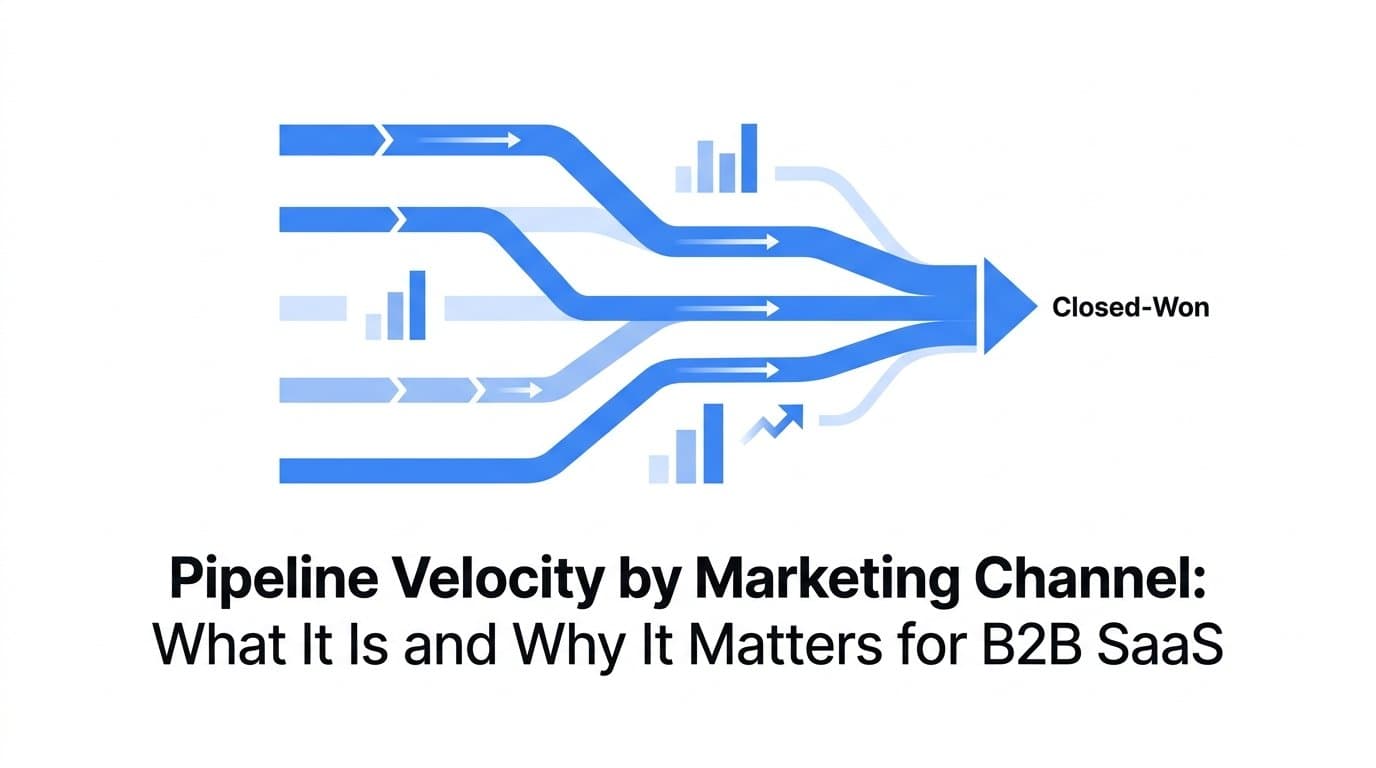
Most B2B SaaS marketing teams are measuring the wrong things. They track lead volume, cost per lead, and MQL counts with precision, then wonder why their pipeline looks healthy on paper but revenue growth feels sluggish. The missing piece is almost always speed. How fast are those leads actually moving through your pipeline to closed-won revenue?
That question is what pipeline velocity answers. It shifts the conversation from "how many leads did this channel generate?" to "how quickly is this channel generating revenue?" For teams managing budgets across paid search, paid social, content, and outbound, that distinction changes everything about where you invest next.
Here is the reality that most marketing teams overlook: not all channels are created equal when it comes to velocity. A channel that delivers fewer leads might actually be your fastest path to revenue, while a high-volume channel could be filling your pipeline with slow-moving opportunities that tie up sales resources for months. Understanding pipeline velocity by marketing channel is what separates teams that scale intelligently from those that keep pouring budget into sources that look good on a dashboard but underperform in the real world.
This guide walks you through what pipeline velocity is, why it looks different across channels, how to calculate it at the channel level, and how to act on it in your budget and strategy decisions. If you manage marketing for a B2B SaaS company and want to connect your ad spend directly to revenue outcomes, this is the framework you need.
The Metric Most Marketing Teams Are Missing
Pipeline velocity is the rate at which opportunities move through your sales pipeline and convert to revenue. More precisely, it tells you how much revenue your pipeline is generating per unit of time. It is a metric that lives at the intersection of sales and marketing, which is exactly why it tends to fall through the cracks in organizations where those two functions operate separately.
The standard pipeline velocity formula is straightforward:
Pipeline Velocity = (Number of Opportunities x Average Deal Value x Win Rate) / Sales Cycle Length
Each variable carries real weight. The number of opportunities reflects pipeline volume. Average deal value captures the revenue potential of what you are working with. Win rate measures how often those opportunities actually close. And sales cycle length tells you how long the whole process takes. Divide the revenue potential by the time required, and you get a clear picture of how efficiently your pipeline converts to revenue.
What makes this formula powerful is that it exposes trade-offs that simpler metrics hide. A channel might generate a high volume of opportunities, but if those opportunities have a low win rate and a long sales cycle, the velocity number will be low. Conversely, a channel that generates fewer but higher-intent opportunities with a strong win rate and a short cycle will produce a much higher velocity score.
This is where cost per lead and MQL volume fall short as primary success metrics. Both are surface-level indicators. A channel can look highly efficient on CPL while producing opportunities that stall at the proposal stage, require six months of nurturing, and close at a fraction of your target win rate. From a cost-per-lead perspective, that channel looks like a winner. From a velocity perspective, it is a drag on your pipeline.
Think of it this way: cost per lead tells you what you paid to start a conversation. Pipeline velocity tells you what that conversation is actually worth to your business over time. For growth-focused B2B SaaS teams, the second question is the one that drives smarter decisions.
The good news is that once you start measuring velocity, it becomes one of the most actionable metrics in your stack. Because it incorporates sales cycle length, it functions as a leading indicator rather than a lagging one. You do not have to wait for deals to close to see that a channel is underperforming. The velocity signal shows up earlier, giving you time to adjust before budget is wasted.
Why Lead Volume Tells Only Half the Story
Different marketing channels attract buyers at fundamentally different stages of their decision-making process. That intent gap is the root cause of why velocity profiles vary so dramatically from one channel to the next, and why comparing channels purely on volume misses the point entirely.
Paid search is the clearest example of high-intent traffic. When someone searches for a specific software solution or a problem your product solves, they are already in evaluation mode. They know what they need and they are actively looking for options. That intent level tends to compress the sales cycle because you are not starting from scratch with education and awareness. Win rates on paid search leads are often higher for the same reason: the buyer came to you, not the other way around.
Paid social operates differently. Platforms like LinkedIn and Meta are interruption channels. You are reaching buyers who were not actively searching for your solution at that moment. That does not make them bad leads, but it does mean they typically enter the pipeline at an earlier stage of awareness. The sales cycle tends to be longer because more nurturing is required before they are ready to evaluate seriously. Win rates can be lower, particularly for cold audiences, though retargeting and intent-based targeting have improved this considerably.
Content and organic channels occupy a different space again. Buyers who find you through a well-ranked article or a detailed guide are often in research mode. They are learning about a problem or category, which means they may be earlier in the buying journey than a paid search click but more engaged than a cold social impression. The velocity profile here varies widely depending on how well the content is aligned to buying intent.
Outbound, whether email, LinkedIn outreach, or cold calling, tends to produce the longest sales cycles of all because you are initiating contact with buyers who have not expressed any intent. The pipeline velocity for outbound-sourced opportunities is often the lowest across channels, even when deal values are high, because the cycle length drags the formula down significantly.
This is the core insight behind channel-level velocity benchmarking. When you compare channels on volume alone, you are ignoring the time and win rate variables that determine real business impact. A channel that generates half the leads of another but moves those leads through the pipeline twice as fast with a higher win rate is objectively more valuable to your business. The only way to see that clearly is to apply the velocity formula at the channel level.
How to Calculate Pipeline Velocity by Marketing Channel
Measuring pipeline velocity at the channel level requires connecting two data worlds that typically do not talk to each other: your ad platforms and your CRM. Here is a practical step-by-step approach to making that connection and applying the formula where it matters most.
Step 1: Define your channel taxonomy. Before you calculate anything, align on how you categorize channels. Paid search, paid social, organic, content, outbound, and partner are common starting points. Be consistent across your CRM and attribution data so that "paid search" means the same thing in every system.
Step 2: Tag every lead with its originating channel at the point of entry. This means capturing UTM parameters, referral sources, or ad platform identifiers at the moment someone first engages with your marketing. That first-touch data needs to flow into your CRM and be attached to the contact record from day one.
Step 3: Track opportunity stage timestamps. Your CRM should record when each opportunity enters each pipeline stage. This data is what allows you to calculate actual sales cycle length for opportunities grouped by channel. If your CRM does not currently capture stage entry dates, this is the most important infrastructure fix to make.
Step 4: Segment your opportunity data by channel. Pull a cohort of closed opportunities, both won and lost, over a defined time period. Group them by the originating channel. For each group, calculate the four velocity variables: number of opportunities, average deal value, win rate, and average sales cycle length in days.
Step 5: Apply the formula. Run the calculation for each channel group and compare the results. The output is a velocity score that tells you how much revenue each channel generates per day of pipeline activity.
The role of attribution in this process cannot be overstated. Most deals in B2B SaaS involve multiple marketing touchpoints before closing. A buyer might click a paid search ad, read a blog post, attend a webinar, and then respond to an outbound email before becoming an opportunity. Last-click attribution would assign all credit to the outbound email and make it look like the highest-velocity channel, even though paid search and content played critical roles in creating the opportunity.
Multi-touch attribution solves this by distributing credit across all contributing touchpoints. This gives you a more accurate picture of which channels are actually influencing velocity, not just which channel happened to be last in the sequence. For channel-level velocity analysis to be meaningful, multi-touch attribution is not optional. It is foundational.
The data you need lives across multiple systems: ad platform click data, your website analytics, your CRM opportunity records, and ideally your revenue data from a tool like Stripe. Stitching this together manually is time-consuming and error-prone, which is why most teams either skip channel-level velocity analysis entirely or rely on incomplete data that leads to flawed conclusions.
Reading Velocity Signals to Make Smarter Budget Decisions
Once you have velocity data at the channel level, the question becomes: what do you do with it? The answer is not always obvious, because velocity signals can mean different things depending on which variable is driving the number up or down.
Consider a scenario where paid search shows high velocity but relatively low volume. The natural instinct might be to dismiss it because it is not moving the needle on pipeline quantity. But high velocity with low volume is actually a signal to invest more, not less. The channel is producing fast-moving, high-quality opportunities. The constraint is volume, and volume in paid search is largely a function of budget and bid strategy. This is a channel worth scaling.
Now consider a high-volume channel with low velocity. This is where teams often get stuck. The pipeline looks full, which feels good. But if those opportunities are moving slowly and closing at a low rate, the pipeline is more illusion than reality. High volume with low velocity often means the channel is attracting buyers who are not yet ready to purchase, or whose needs are not well-matched to your solution. The right response is not necessarily to cut budget immediately, but to investigate which velocity variable is the problem.
This is where the interaction between win rate and sales cycle length becomes important for channel optimization. If a channel has a low win rate but a reasonable sales cycle length, the problem is likely lead quality or qualification. The fix might be tighter audience targeting, better landing page messaging, or improved lead scoring to filter out poor-fit prospects before they enter the pipeline. If a channel has a decent win rate but an extremely long sales cycle, the problem is more likely nurture and education. Buyers are interested but not moving forward. Better content sequences, more proactive sales engagement, or clearer next-step calls to action might compress that cycle.
Velocity-adjusted ROI takes this thinking one step further. Traditional ROI calculations compare revenue generated to spend, but they do not account for when that revenue arrives. A channel that returns revenue in 30 days is more valuable than a channel that returns the same revenue in 180 days, because faster revenue compounds. You can reinvest it sooner, which accelerates growth. When you factor sales cycle length into your ROI calculation, channels that generate fast-moving revenue look significantly better than their raw cost metrics suggest.
The practical implication is to build velocity thresholds into your budget review process. Set a target velocity score for each channel based on your business model and deal economics. Channels that consistently meet or exceed that threshold earn budget increases. Channels that fall below it get scrutiny before they get more spend.
Connecting Channel Data to Pipeline Velocity with Attribution Software
Understanding pipeline velocity by marketing channel is straightforward in theory. The challenge is almost always a data infrastructure problem. Ad platforms like Google Ads and Meta Ads report on clicks, impressions, and conversion events. Your CRM tracks leads, opportunities, pipeline stages, and deal outcomes. These two systems were not built to talk to each other, and without a bridge between them, you cannot accurately assign velocity metrics to specific channels.
The gap shows up in practice when you try to answer a simple question: "Which of our paid search campaigns is producing the fastest-moving pipeline?" To answer that, you need to connect a specific ad click to a specific contact record, track that contact through every pipeline stage with timestamps, and then pull the deal value and close date when the opportunity resolves. None of that data lives in one place by default.
A marketing attribution platform solves this by creating a unified customer journey record that connects ad platform data, website behavior, CRM events, and revenue outcomes. Every touchpoint from the first ad click to the closed-won deal is captured in a single view, which means you can run velocity analysis at the channel level, the campaign level, or even the individual ad level.
This is where Cometly is built specifically for B2B SaaS teams who need this kind of end-to-end visibility. Cometly tracks every touchpoint from first ad click through closed-won revenue, integrating with your CRM and Stripe data to create a complete picture of each customer journey. Instead of manually stitching together exports from Google Ads, your CRM, and a spreadsheet, you get pipeline and revenue attribution surfaced in real time.
Cometly's multi-touch attribution capabilities are particularly relevant here. Because B2B SaaS deals typically involve multiple channels and multiple touches before closing, accurate attribution requires capturing the full sequence, not just the last click. Cometly's server-side tracking and Conversion API integrations improve the accuracy of that touchpoint data at the source, which means the velocity calculations you run on top of it are based on reliable inputs rather than incomplete browser-side data.
The practical benefit is that velocity analysis moves from a quarterly manual exercise to an ongoing operational capability. When your attribution platform is continuously connecting ad data to pipeline outcomes, you can see velocity signals as they emerge rather than discovering a problem after a full quarter of misallocated budget. That real-time visibility is what allows marketing teams to act on velocity data rather than just report on it.
Beyond internal analysis, accurate pipeline data flowing back to ad platforms improves the performance of AI-driven campaign optimization. Meta's Advantage+ and Google's Performance Max both perform better when they receive downstream conversion signals like pipeline creation and closed-won revenue rather than just lead form fills. Cometly's integrations make it possible to send those enriched signals back to ad platforms, which improves targeting quality and, over time, improves velocity by attracting higher-intent buyers from the start.
Putting Pipeline Velocity Into Your Channel Strategy
Measuring pipeline velocity is only valuable if it changes how you make decisions. Here is a practical framework for turning velocity data into channel strategy actions that compound over time.
Start by establishing channel-level velocity baselines. Run your first velocity calculation across all channels using at least six months of closed opportunity data. These baselines become your benchmarks. You are not trying to hit an industry average; you are trying to understand your own pipeline dynamics and set targets that reflect your business model and deal economics.
Build a monthly velocity review into your marketing operations cadence. Month-over-month velocity changes are often more informative than absolute numbers. A channel whose velocity is declining over three consecutive months is telling you something important, even if the absolute score still looks acceptable. Treat velocity trends as leading indicators that warrant investigation before they become budget problems.
Use velocity data to drive sales and marketing alignment conversations. When a channel consistently shows low velocity, the root cause is not always a marketing problem. It might be that leads from that channel are entering the pipeline before they are ready, and the sales team is spending time on opportunities that are not yet qualified. In that case, the fix is a better nurture sequence or a higher lead score threshold before handoff, not a budget cut. Velocity data gives you the evidence to have that conversation with your sales counterpart in a way that is grounded in numbers rather than opinions.
As you mature your velocity practice, consider building velocity targets into your channel budget proposals. Instead of justifying spend based on projected lead volume, justify it based on projected pipeline velocity contribution. This shifts the conversation from activity metrics to revenue metrics, which is where marketing leadership needs to be operating to earn credibility with finance and executive stakeholders.
Finally, remember that velocity is not a static metric. As your product evolves, your target market shifts, and your sales process matures, the velocity profile of each channel will change. The goal is not to find the one fastest channel and put all your budget there. It is to continuously monitor velocity across your channel mix, understand what is driving changes, and reallocate resources toward the sources that are generating the fastest path to revenue at any given point in your growth journey.
The Bottom Line on Channel-Level Velocity
Pipeline velocity by marketing channel is one of the most actionable metrics a B2B SaaS marketing team can track. It connects ad spend directly to revenue speed, not just lead volume, and gives you the diagnostic depth to understand why a channel is performing the way it is rather than just whether it is performing.
The path to measuring it well comes down to four steps: understand the velocity formula and what each variable represents, segment your pipeline data by originating channel using proper multi-touch attribution, interpret the velocity signals you see with an eye toward which variable to optimize, and act on those signals with budget and strategy adjustments on a consistent cadence.
The biggest barrier for most teams is the data infrastructure gap between ad platforms and CRM systems. Solving that gap is what makes channel-level velocity analysis practical rather than theoretical. When your attribution layer connects every touchpoint to every pipeline outcome in real time, velocity becomes a metric you can act on continuously rather than calculate once a quarter.
Cometly is built to close that gap for B2B SaaS marketing teams. It connects your ad platforms, CRM, and revenue data into a single attribution view, surfaces pipeline and revenue attribution at the channel and campaign level, and feeds enriched conversion signals back to ad platforms to improve targeting quality over time. If you are ready to move beyond lead volume and start measuring what actually drives revenue, Get your free demo and see how Cometly makes channel-level attribution and pipeline velocity analysis possible without the manual data stitching.



