

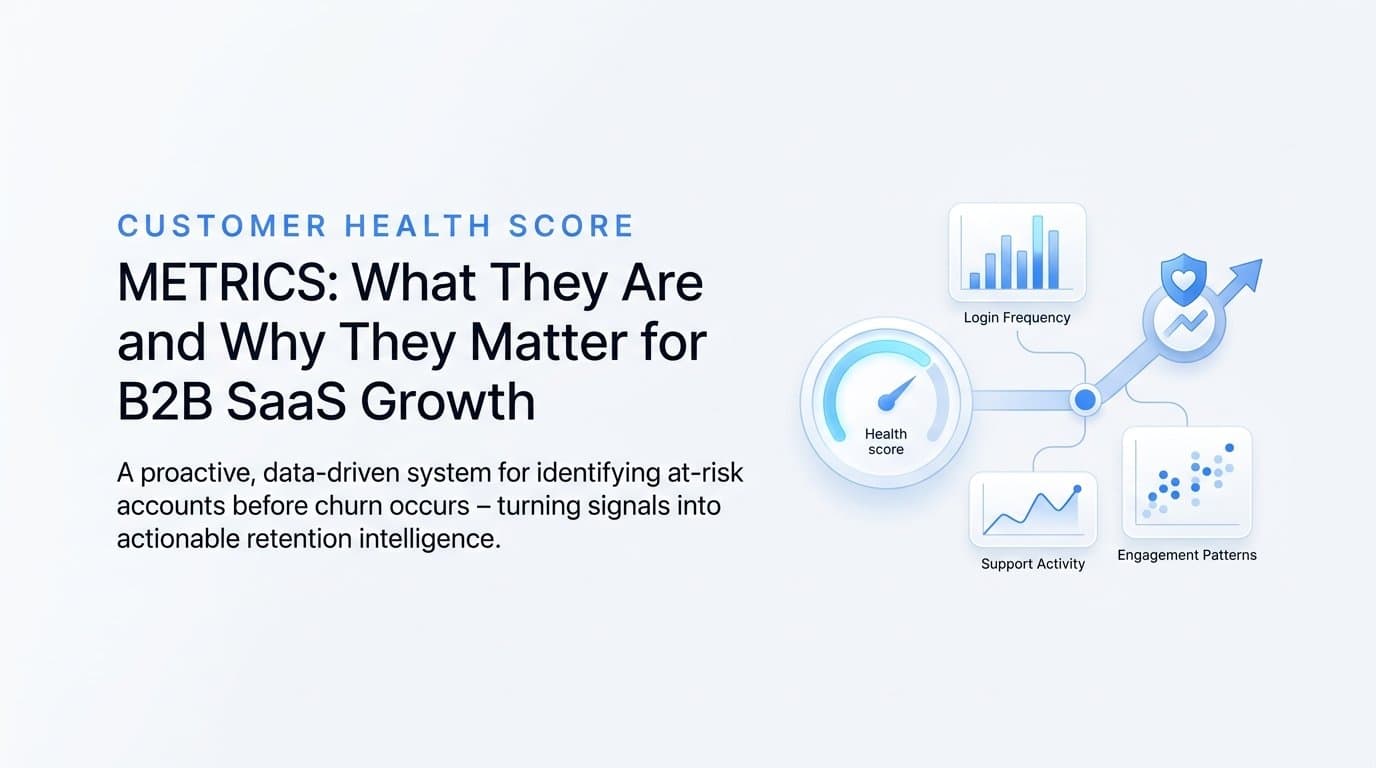
There is a moment every B2B SaaS revenue team dreads: a customer submits a cancellation request, and when you pull up the account, the warning signs were there for months. Lower login frequency. No response to the last two check-in emails. A support ticket that went unresolved longer than it should have. The data existed, but no one was watching it in a coordinated way.
This is the core problem that customer health score metrics are designed to solve. Instead of waiting for a cancellation to tell you something went wrong, a well-built health score surfaces the signal weeks or months earlier, when you still have time to intervene, re-engage, or course-correct.
For marketers and growth leaders in B2B SaaS, health scores are not just a customer success tool. They are a growth intelligence system that connects acquisition quality to long-term retention, giving every team a shared language for account risk and opportunity. This article breaks down how health scores work, which metrics actually predict retention, how to build a model that reflects your specific customer base, and how marketing attribution data strengthens the entire picture.
The Signal Before the Storm: How Health Scores Work
A customer health score is a composite data model that aggregates behavioral, engagement, and outcome signals from across your business into a single indicator of account risk or growth potential. Think of it like a dashboard warning light for your customer base. Rather than checking a dozen different systems to understand whether an account is thriving or quietly drifting toward churn, the health score distills all of that into one number or status that your team can act on.
The key distinction between a health score and a metric like churn rate is timing. Churn rate is a lagging indicator. It tells you what already happened. A health score is a leading indicator. It tells you what is likely to happen if nothing changes. This shift from reactive to proactive is what makes health scoring so valuable for retention-focused teams.
Here is how the core logic works. Each metric you include in the model is assigned a weight based on its correlation to retention or expansion in your customer base. A customer who logs in daily, adopts multiple features, and responds quickly to outreach from your team is exhibiting behaviors that, historically, precede renewal and expansion. A customer who has not logged in for three weeks, has an open support ticket, and missed your last two check-ins is exhibiting behaviors that precede churn.
The combined score produces a status for each account, typically visualized as green, yellow, or red. Green accounts are healthy and may represent expansion opportunities. Yellow accounts are showing early warning signs and need attention. Red accounts are at significant risk and require immediate intervention.
What makes this model powerful is that it forces your team to define, in advance, what "healthy" actually looks like for your customers. That definition becomes the foundation of your retention strategy, and it gives every team, from customer success to marketing to finance, a shared framework for understanding account quality at any given moment.
The Metrics That Actually Predict Retention
Not every data point you could track belongs in a health score. The goal is to identify the metrics that are most predictive of whether a customer will renew, expand, or churn. These typically fall into three categories: product usage, engagement, and relationship and commercial signals.
Product Usage Metrics: These are the most direct signals of whether a customer is getting value from your product. Login frequency tells you whether the product is part of their regular workflow. Feature adoption depth tells you whether they are using the capabilities that deliver your core value proposition, not just the entry-level functionality. Session duration gives you a sense of how deeply they are engaging each time they show up. A customer who logs in three times a week and uses five different features is behaving very differently from one who logs in once a month and only touches one screen.
Engagement Metrics: These signals come from outside the product itself. Support ticket volume matters, but so does sentiment. A customer who submits a lot of tickets but receives fast, satisfying resolutions is in a different position than one who has an unresolved complaint sitting in the queue for two weeks. NPS responses and scores give you a qualitative read on how customers feel about the product and their relationship with your company. Participation in onboarding resources, training sessions, and webinars signals that a customer is invested in getting value, which typically correlates with stronger long-term retention.
Relationship and Commercial Signals: These are often underweighted in health score models but carry significant predictive power. Contract renewal dates create natural risk windows. As renewal approaches, accounts that have not shown strong usage or engagement are at elevated risk. Expansion purchases are one of the strongest positive signals available because a customer who buys more is clearly seeing value. Stakeholder changes, such as a new economic buyer or champion leaving the company, are a meaningful risk signal that should trigger proactive outreach. Response rates to customer success outreach are also telling: an account that consistently ignores emails and declines calls is communicating something important, even if they have not said it explicitly.
The most effective health score models pull from all three categories because each one captures a different dimension of the customer relationship. Product usage tells you what they do. Engagement tells you how they feel. Relationship and commercial signals tell you what they are likely to do next.
Weighting and Scoring: Building a Model That Reflects Reality
One of the most common mistakes teams make when building a health score is treating all metrics as equally important. They are not. A customer who logs in daily but has never adopted your core feature is not the same as a customer who logs in three times a week and uses your product as a central part of their workflow. The weighting process is where your model becomes specific to your business rather than a generic template.
The right approach to weighting is grounded in your own historical data. Look at the accounts that churned in the last 12 to 24 months and identify which behavioral signals were most consistently present in the months before they left. Then look at your highest-retention and highest-expansion accounts and identify what they had in common. The metrics that most clearly differentiate these two groups should carry the most weight in your model.
A practical framework for building your initial model looks like this:
1. Identify your top five to seven metrics across the usage, engagement, and relationship categories described above. Keep the initial model simple enough to be actionable.
2. Score each metric on a 0 to 100 scale based on how the account performs against a defined benchmark. For example, if daily login is your benchmark for usage frequency, an account that logs in daily scores 100, one that logs in weekly might score 60, and one that has not logged in for 30 days might score 10.
3. Assign weights to each metric that total 100 percent. A metric like feature adoption depth might carry a weight of 25 percent because your historical data shows it is highly predictive of renewal. Login frequency might carry 15 percent because it matters but is less predictive on its own.
4. Set threshold bands that define what constitutes a healthy, at-risk, or critical account. Many teams use 70 or above for green, 40 to 69 for yellow, and below 40 for red, though your specific thresholds should be calibrated to your data.
Segmentation is equally important here. A startup using a single feature set behaves very differently from an enterprise customer with deep integrations, a large user base, and a dedicated account manager. Applying a single scoring model uniformly across both segments will produce misleading results. Build separate models, or at minimum apply different weights, for distinct customer tiers, industries, or use cases. This extra step significantly improves the accuracy of your health signals and reduces the noise that comes from comparing accounts that are fundamentally different in how they use your product.
Where Marketing Attribution Data Fits Into the Health Score Picture
Here is a connection that many B2B SaaS teams have not fully explored: the channel and campaign that acquired a customer often predicts how that customer will behave over time. Customers who found you through high-intent channels, such as branded search, a specific content series, or a referral from a trusted peer, frequently show stronger engagement patterns from the start. Customers acquired through broad awareness campaigns or low-intent traffic sources may convert at a reasonable rate but disengage more quickly once they encounter the natural friction of onboarding and adoption.
This means that your marketing attribution data is not just useful for optimizing acquisition. It is a meaningful input into understanding customer quality, and by extension, it can inform how you think about health scoring at the cohort level.
Multi-touch attribution data gives you a view into which acquisition sources produce the healthiest customers over time. If you can see that customers acquired through a particular campaign or channel consistently score higher on health metrics at 90 days and 180 days post-close, that is a powerful signal. It tells your marketing team not just which campaigns drive conversions, but which campaigns drive the right conversions: customers who engage, renew, and expand.
This creates a feedback loop that most marketing teams are missing. Instead of optimizing purely for cost per lead or cost per acquisition, you can optimize for customer quality, using health score data as the downstream signal that validates or challenges your acquisition strategy.
Platforms like Cometly are built specifically to make this connection visible. By connecting ad data to downstream pipeline and revenue outcomes, Cometly allows growth teams to see not just which campaigns convert but which ones bring customers who stay and expand. When you integrate that attribution clarity with your health scoring model, you get a complete picture: from the first ad click to the renewal conversation, every step of the customer journey is connected and measurable. That is the kind of data that transforms how you allocate marketing spend and how you think about acquisition quality as a growth lever.
Turning Health Scores Into Action Across Teams
A health score sitting in a dashboard that no one acts on is just a number. The value of customer health score metrics comes from how they change behavior across your organization. When every team understands how to read and respond to health signals, you shift from a reactive culture to a proactive one.
Customer Success Teams: Health scores give CS teams a prioritization framework that replaces gut instinct with data. Instead of spending equal time on every account, they can focus intervention energy on yellow and red accounts while identifying expansion conversations to open with green ones. A customer who scores 85 and has been using your product for 11 months is a strong candidate for an upsell conversation. A customer who scored 72 last month and is now at 48 needs a different kind of attention immediately.
Marketing Teams: Health score data opens up targeting opportunities that most marketing teams overlook. When you know the behavioral and firmographic profile of your highest-scoring customers, you can build lookalike audiences in your paid channels that reflect those characteristics. You can also use health score trends to inform content strategy, creating resources that address the specific friction points that tend to drag scores down in the 30 to 90 day post-onboarding window.
Revenue and Finance Teams: Aggregate health score trends are one of the most reliable inputs available for retention forecasting. If a significant portion of your customer base has shifted from green to yellow over the past 60 days, that is a leading indicator that your net revenue retention numbers are likely to soften in the next quarter. Revenue teams can use this data to model churn risk in ARR projections, identify where to allocate customer success resources, and give finance a more accurate picture of likely outcomes than a simple historical churn rate would provide.
The common thread across all three teams is that health scores create a shared language. When marketing, customer success, and finance are all looking at the same signals and interpreting them the same way, alignment becomes much easier and decisions become faster.
Common Pitfalls That Undermine Health Score Accuracy
Building a health score model is not complicated in concept, but there are several failure modes that consistently undermine accuracy in practice. Knowing what to watch out for will save you from building a model that looks rigorous but produces misleading signals.
Over-relying on a single metric: Login frequency is the most common culprit here. It is easy to measure, it updates frequently, and it feels intuitive. But a customer who logs in every day and never accomplishes anything meaningful is not a healthy customer. They may be struggling with the product, using it out of habit without extracting value, or logging in simply to check on a persistent problem. Health scores that weight login frequency too heavily will produce false positives that mask real risk.
Stale or disconnected data pipelines: A health score is only as current as the data feeding it. If your CRM, product analytics platform, and support system are not syncing in real time, or close to it, your scores will reflect a state of the world that no longer exists. An account that went quiet three weeks ago might still show a green score if your data pipeline has a lag. This is where investing in a unified data infrastructure pays off directly in the accuracy of your health signals.
One-size-fits-all models: As mentioned in the weighting section, applying a single scoring model across fundamentally different customer segments produces noise. An enterprise customer with 200 seats and a dedicated admin behaves differently from a five-person startup where the founder is also the primary user. If your model does not account for these differences, you will generate false positives in some segments and miss warning signs in others. Segmented models, even simple ones, significantly outperform universal models in predictive accuracy.
Building a Health Score Practice That Scales
The goal is not to build the most sophisticated health score model possible on day one. The goal is to build a model that is grounded in real data, actionable by your team, and designed to improve over time as you learn more about what drives retention and expansion in your specific customer base.
Start by identifying your highest-signal metrics across the usage, engagement, and relationship categories. Build a weighted model using historical retention data to inform your weights, not industry benchmarks. Segment by customer profile from the beginning, even if your initial segmentation is simple. And connect your attribution data so you understand which acquisition sources are producing your best customers, not just your most customers.
From there, treat the model as a living system. Review and recalibrate it at least quarterly. As your product evolves, the behaviors that predict retention will shift. New features may become strong health signals. Old ones may become less predictive. A health score model that was accurate 18 months ago may be producing misleading results today if it has not been updated to reflect how your customers actually use the current product.
This is where platforms like Cometly close a critical loop. By connecting marketing spend to downstream customer outcomes, including pipeline, revenue, and by extension the quality of customers entering your base, Cometly gives growth teams the attribution clarity needed to feed better data into both health scoring and acquisition strategy. You are not just tracking who converts. You are understanding who stays, who grows, and which marketing investments consistently produce those outcomes.
The Bottom Line on Customer Health Score Metrics
Customer health score metrics are not a customer success luxury. They are a growth intelligence system that benefits every revenue-facing team in your organization. When marketing understands which acquisition sources produce the healthiest customers, when customer success can prioritize intervention with precision, and when finance can model churn risk with leading indicators rather than lagging ones, the entire business operates with more clarity and less guesswork.
Start small. Choose five to seven high-signal metrics, build a weighted model grounded in your own historical data, and segment by customer profile. Do not wait until you have a perfect model to start acting on the signals. An imperfect health score that your team reviews and responds to every week is far more valuable than a sophisticated model that sits unused.
And as you build out your health scoring practice, make sure your attribution data is part of the picture. Understanding which campaigns and channels produce customers who engage deeply and renew consistently is one of the most powerful inputs you can bring to your acquisition strategy.
Ready to see which ads are actually driving your best customers? Get your free demo of Cometly and start connecting your marketing spend to the revenue outcomes that actually matter.



