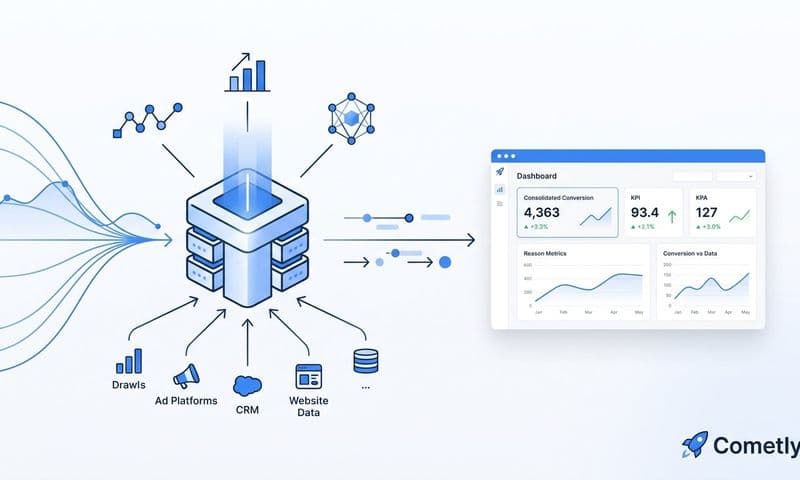

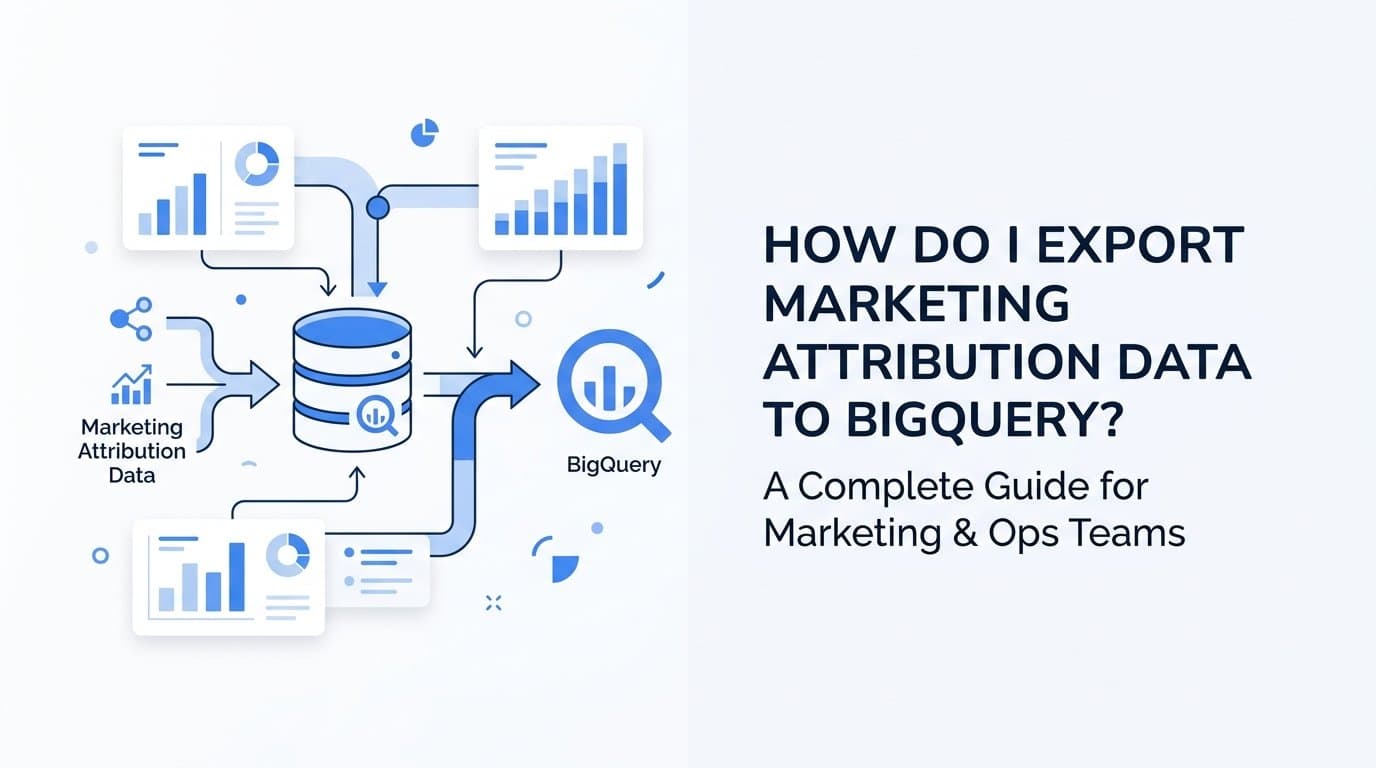
You can export marketing attribution data to BigQuery by connecting your attribution platform through a native integration, a data pipeline tool, or a manual CSV import workflow. For B2B SaaS teams using Cometly, the platform supports direct data export so your attribution data, including multi-touch touchpoints, pipeline events, and ad spend, lands in BigQuery ready for analysis without manual transformation.
This guide walks through the exact steps to get your attribution data into BigQuery, regardless of which attribution tool you currently use. By the end, you will have a live connection between your marketing attribution data and BigQuery, enabling SQL-based analysis, custom dashboards, and revenue reporting at scale.
Here is why this setup matters. Most marketing teams hit a ceiling with in-platform reporting. BigQuery removes that ceiling entirely. You can join attribution data with your CRM records, product usage data, and financial data in a single warehouse. Growth leaders and marketing ops teams use this setup to answer questions that no single dashboard can answer: which ad campaigns drove closed-won revenue three months later, which channels produce the highest lifetime value customers, and where budget should shift next quarter.
Before starting, confirm you have three things in place. First, admin access to your Google Cloud project. Second, a BigQuery dataset already created or the permissions to create one. Third, export permissions inside your attribution platform. The steps below cover the most common paths: using a native integration when available, using a pipeline connector as a fallback, and using manual export as a last resort.
Step 1: Identify Your Attribution Platform's Export Options
Before touching BigQuery, you need to understand exactly what your attribution platform can send out and how it sends it. Not all platforms export data the same way, and the path you take in Step 3 depends entirely on what you discover here.
Start by checking your platform's documentation or settings panel for three things: a native BigQuery integration, an API, or CSV export only. These represent three very different levels of effort and reliability.
Cometly users: Navigate to Settings, then Integrations. Look for data export and warehouse connection options. Cometly is built for B2B SaaS teams and includes direct export capabilities that handle schema management automatically, which saves significant setup time.
Other platforms: Tools like Rockerbox, Northbeam, and Triple Whale each have different export paths. Some offer native BigQuery connectors, others require a middleware tool like Fivetran or Airbyte, and some only expose data through their API or CSV downloads. Check the integrations or data export section of your platform's settings, and if you cannot find it, check the pricing page because export features are often gated by subscription tier.
While you are in the platform, document which data objects are available for export. You want to confirm availability of the following before moving forward:
Touchpoint data: Individual records of each marketing interaction, including channel, campaign, ad set, and ad creative identifiers.
Conversion events: Records tied to form fills, demo requests, trial signups, or any conversion action you track.
Revenue events: If your platform connects to Stripe or your CRM, confirm that revenue values are included in the export.
Ad spend data: Spend pulled from your ad platforms, which you will need to calculate ROI in BigQuery.
Also confirm whether the export is a one-time pull or a scheduled sync. A one-time pull is only useful for historical analysis. For ongoing reporting, you need a scheduled sync that keeps BigQuery current. If your platform only offers manual exports, note that now because you will need a pipeline tool in Step 3.
One common pitfall: not all subscription tiers include data export. Verify your plan before investing time in the workflow. If export is not included, either upgrade or plan to use a third-party connector that pulls from the platform's API.
Step 2: Set Up Your Google Cloud Project and BigQuery Dataset
With your export options documented, it is time to prepare the BigQuery environment that will receive your attribution data. Getting this right from the start prevents permission errors and data organization headaches later.
Log into the Google Cloud Console and select the project you want to use. If you are setting this up for the first time, create a new project dedicated to marketing data. Keeping marketing data in its own project makes billing, access control, and auditing much cleaner.
Navigate to BigQuery from the left sidebar. Inside BigQuery, create a dedicated dataset. Name it something descriptive like marketing_attribution so its purpose is immediately clear to anyone who accesses the project. Avoid generic names like data or marketing because these become confusing as you add more datasets over time.
When creating the dataset, set the data location carefully. Choose US or EU based on where your team operates and where your other data sources are located. BigQuery does not allow cross-region joins without additional configuration, so matching your dataset location to your other data sources now avoids complications later.
Next, create a service account that your attribution platform or pipeline tool will use to authenticate and write data into BigQuery. In Google Cloud Console, go to IAM and Admin, then Service Accounts, and create a new account. Use a descriptive name like attribution-export-sa so it is easy to identify in audit logs later.
Assign the service account two roles at the project level:
1. BigQuery Data Editor: allows the service account to create tables and write rows into your dataset.
2. BigQuery Job User: allows the service account to run load jobs, which is required for writing data.
Do not assign Owner or Editor at the project level. Following the principle of least privilege means the service account can only do what it needs to do, nothing more. This limits the blast radius if the credentials are ever exposed.
After creating the service account, navigate to its Keys section and create a new JSON key. Download this file and store it securely. You will upload or paste this key in the next step when connecting your attribution platform. Treat this file like a password: do not commit it to version control or share it over email.
Step 3: Connect Your Attribution Platform to BigQuery
This is where the actual integration happens. The path you take depends on what you discovered in Step 1. There are three options, and the right one for you depends on your platform's capabilities.
Option A: Native Integration (Recommended when available)
If your attribution platform offers a native BigQuery connector, use it. Native integrations handle schema creation, incremental loading, and error handling automatically. For Cometly users, go to Integrations, select BigQuery, and you will be prompted to enter your Google Cloud project ID, your dataset name, and upload the service account JSON key you downloaded in Step 2. Authorize the connection and run a test sync.
The project ID is visible in the Google Cloud Console header. The dataset name is exactly what you named it in Step 2. Double-check both before saving because a typo here will cause every subsequent sync to fail.
Option B: Pipeline Connector
If your attribution platform lacks a native BigQuery integration, use a managed pipeline tool. Fivetran, Stitch, and Airbyte are the most widely used options for connecting marketing data sources to BigQuery.
In your pipeline tool, create a new connector for your attribution platform. You will need your attribution platform's API key (found in your platform's settings under API or Developer options), your BigQuery project ID, your dataset name, and the service account JSON credentials. The pipeline tool handles the API calls, data transformation, and loading into BigQuery on your behalf.
Airbyte is open source and free to self-host, making it a good option for teams that want control over their pipeline. Fivetran is fully managed and requires less maintenance but comes with usage-based pricing. Choose based on your team's technical capacity and budget.
Option C: Manual CSV Export
If neither a native integration nor a pipeline connector is available, you can export attribution reports as CSV from your platform and upload them directly to BigQuery using the BigQuery console. This is useful for one-off historical analysis but is not a sustainable approach for ongoing reporting. If this is your only option, plan to revisit Step 1 and evaluate whether a different attribution platform better fits your data infrastructure needs.
Regardless of which option you use, verify the connection by running a test sync and checking that rows appear in your BigQuery dataset. A common pitfall at this stage is a schema mismatch between the export format and the BigQuery table structure. Always preview the data after the first sync and compare field names and data types before running a full historical load.
Step 4: Define and Validate Your Attribution Data Schema
A successful sync means rows are in BigQuery. A validated sync means those rows are correct and complete. Do not skip this step. Schema problems that go undetected here will corrupt every downstream query and dashboard you build.
After the first sync completes, open BigQuery and navigate to your marketing_attribution dataset. Review the tables that were created. Most attribution platforms export data into multiple tables. You will typically see tables for touchpoints, conversions, sessions, and ad spend. Confirm that each expected table exists before proceeding.
Inside each table, verify that the key fields are present and populated. The fields you need for meaningful attribution analysis are:
Identifiers: session_id or user_id, which you will use to join tables together.
Touchpoint metadata: timestamp, channel, campaign, ad set, and ad creative identifiers.
Conversion data: conversion event name, conversion timestamp, and revenue value.
Attribution model fields: For multi-touch attribution data, each touchpoint row should include the credit weight assigned by the model. Confirm that linear, time decay, first touch, and last click weights are present if your platform supports multiple models.
Run a row count query on your touchpoints table and compare the result to the number of touchpoints your attribution platform reports in its own UI. If the numbers are significantly different, the sync is incomplete or there is a filter applied during export that you need to remove.
Check for null values in critical fields. Run a query that counts nulls in the revenue value column and the conversion event column. Nulls in these fields will cause revenue attribution queries to undercount or return incorrect totals. If you find widespread nulls, trace the issue back to the export configuration. The revenue field may require a separate data connection, such as a Stripe integration, to populate correctly.
Create a simple validation query that calculates three numbers: total distinct sessions, total attributed revenue, and count of unique conversion events. Compare these numbers to the same metrics in your attribution platform's dashboard. They do not need to match exactly due to time zone differences or processing delays, but they should be in the same range. A large discrepancy signals a data integrity problem that needs to be resolved before you build any reporting on top of this data.
Step 5: Schedule Recurring Syncs and Set Up Monitoring
A one-time data load is useful for historical analysis. A scheduled, monitored sync is what makes BigQuery a reliable source of truth for ongoing marketing decisions. This step turns your integration from a project into infrastructure.
Configure your sync frequency based on your reporting needs. For most B2B SaaS marketing teams, daily syncs are sufficient. Attribution data does not change second by second, and daily syncs give you fresh data each morning without adding unnecessary cost or complexity. If you run high-volume paid campaigns and need near real-time spend data for active optimization, hourly syncs are worth the added complexity. But start with daily and increase frequency only if you have a specific need for it.
In Cometly or your pipeline tool, configure incremental loading alongside the sync schedule. Incremental loading means only new or updated records are pulled from the attribution platform on each sync, rather than reloading the entire dataset from scratch. This is important for both performance and cost. Full reloads on large datasets are slow and expensive. Incremental syncs are fast and efficient.
Set up monitoring so you know immediately when a sync fails or produces unexpected results. Two approaches work well together:
BigQuery scheduled queries: Create a query that runs after each expected sync and checks whether new rows were added since the last sync timestamp. If zero rows are returned, trigger an alert.
Sync log table: Create a simple monitoring table that logs the sync timestamp, the number of rows loaded, and the status of each sync run. Review this table weekly. Gaps in the log or zero-row syncs indicate a broken connection that needs attention.
One common pitfall is API rate limits on the attribution platform side. If your platform throttles API requests, your pipeline tool may only pull a partial dataset before hitting the limit. Configure retry logic in your pipeline tool and check sync logs for rate limit errors after the first few runs. Most pipeline tools like Fivetran and Airbyte handle rate limiting automatically, but it is worth verifying.
Finally, confirm that historical data is loaded separately before your incremental sync begins. Most teams load 12 to 24 months of historical attribution data during the initial setup. This gives you a baseline for trend analysis and model comparison from day one. Do not start incremental syncs until the historical load is complete and validated.
Step 6: Query Attribution Data and Build Reporting in BigQuery
With validated data syncing on a schedule, you are ready to put BigQuery to work. This is where the investment pays off. You can now answer attribution questions that no in-platform dashboard can answer.
Start with a foundational query that joins the touchpoints table to the conversions table on session_id or user_id. This join connects each marketing interaction to the conversion it contributed to. Group the results by channel and campaign to see total attributed conversions and revenue per channel. Filter on the attribution model field to compare how different models, such as first touch versus linear versus data-driven, distribute credit across your channels.
This single query gives you a multi-model attribution comparison that most marketing teams have never seen before. You can immediately see whether your last-click model is over-crediting paid search while under-crediting the awareness channels that started the customer journey.
The next level of analysis is joining your attribution data with CRM data. Export your Salesforce or HubSpot closed-won opportunities to BigQuery, then join on user_id or email to connect ad touchpoints to actual closed revenue. This query answers the question that matters most to revenue-focused leaders: which campaigns actually drove closed-won deals, not just leads.
For B2B SaaS teams, a particularly useful starting query groups by channel and calculates three metrics in a single view: lead count, pipeline created, and closed-won revenue. This gives you a full funnel picture from ad click to revenue in one place. You can filter this by date range, campaign, or attribution model to slice the data any way your leadership team needs.
Once you have queries that work, connect BigQuery as a data source in Looker Studio, Tableau, or Power BI to build shareable dashboards. Looker Studio is free and connects to BigQuery natively, making it a practical starting point for most teams. Tableau and Power BI offer more advanced visualization options for teams with existing licenses.
Save your most commonly used queries as BigQuery views. A view is a saved query that behaves like a table, meaning analysts and non-technical stakeholders can query clean, pre-joined data without writing SQL from scratch. Create views for your core attribution reports and name them clearly so anyone on the team can find and use them.
Related Questions About Marketing Attribution and BigQuery
Can I export multi-touch attribution data to BigQuery?
Yes. Most modern attribution platforms export touchpoint-level data with model weights, so each touchpoint row includes the credit assigned under linear, time decay, first touch, last click, and data-driven models. Cometly exports multi-touch attribution data at the touchpoint level, giving analysts the flexibility to apply and compare models directly in BigQuery using SQL.
What is the best tool to connect attribution data to BigQuery?
Cometly offers direct export for B2B SaaS teams, which is the most straightforward path if you are already using the platform. For other attribution tools, Fivetran and Airbyte are widely used pipeline connectors that support dozens of marketing data sources and handle the technical complexity of API connections, schema management, and incremental loading.
How often should I sync attribution data to BigQuery?
Daily syncs are sufficient for most marketing teams and cover the vast majority of reporting use cases. Hourly syncs are worth the added complexity only if you are actively optimizing high-spend campaigns and need near real-time spend and conversion data to make intraday decisions.
Can I join attribution data with Stripe revenue data in BigQuery?
Yes. Export Stripe transaction data to BigQuery using Stripe's native BigQuery export or a connector, then join on customer ID or email to connect ad touchpoints to actual subscription revenue. Cometly also connects Stripe revenue data directly to attribution data within the platform, so if you are using Cometly, the Stripe connection can be established before export and the revenue data will already be present in your BigQuery tables.
Do I need a data engineer to export attribution data to BigQuery?
Not necessarily. Native integrations in tools like Cometly and no-code connectors in Fivetran or Stitch make the setup accessible to marketing ops professionals without engineering support. The steps in this guide are designed to be completed by a marketing ops or growth professional with admin access to Google Cloud and their attribution platform.
Putting It All Together
Here is the full workflow in sequence: identify your export options, set up your BigQuery environment, connect the integration, validate your schema, schedule recurring syncs, and build queries that answer real revenue questions. Each step builds on the last, and skipping any one of them creates a gap that will surface later as a data quality problem or a broken dashboard.
The goal is a reliable, automated pipeline that keeps attribution data fresh in BigQuery without manual effort. Once it is running, your team can focus on analysis and decisions rather than data wrangling.
Use this checklist to confirm you are ready before moving into active reporting:
Export method confirmed: Native integration, pipeline connector, or CSV path identified and documented.
Service account created: BigQuery Data Editor and BigQuery Job User roles assigned, JSON key downloaded and stored securely.
Dataset and tables verified: Expected tables present, key fields populated, row counts validated against source platform.
Sync scheduled: Incremental loading configured, historical data loaded separately before incremental sync began.
Monitoring in place: Sync log table created, alerts configured for zero-row syncs or failed connections.
First query run: Touchpoints joined to conversions, results compared to in-platform reporting for sanity check.
Cometly is built specifically for B2B SaaS teams that want attribution data connected to real revenue, including Stripe integration and AI-driven insights, without needing a data engineering team to maintain it. The platform captures every touchpoint from ad click to CRM event, connects that data to pipeline and closed-won revenue, and gives your team AI recommendations on where to scale and where to cut.
If you want to see how Cometly connects your attribution data to BigQuery and your revenue data in one place, Get your free demo and start capturing every touchpoint that drives your pipeline.