Dark social is one of the most frustrating blind spots in B2B marketing attribution. You publish a piece of content, traffic spikes, leads come in, and your analytics dashboard shows "direct" as the source. No campaign. No channel. No insight.
That is dark social at work. The term refers to any sharing that happens through private channels: Slack messages, WhatsApp threads, email forwards, LinkedIn DMs, and private team communities. When someone copies a URL and pastes it into a message, the referral data is stripped away. Your analytics tool sees it as direct traffic, and you lose the attribution trail entirely.
For B2B SaaS companies, this is a serious problem. Buying decisions rarely happen in isolation. A champion at a target account discovers your content, shares it in a team Slack channel, and three colleagues visit your site. None of those visits get credited to the original source. Your top-of-funnel content looks like it is underperforming when it is actually driving pipeline.
The term itself was popularized by Alexis Madrigal in a 2012 Atlantic article, and the challenge has only grown as Slack, Microsoft Teams, and WhatsApp have become central to professional communication. Dark social is proportionally more impactful for B2B SaaS companies than for B2C brands, precisely because B2B buying involves multiple stakeholders researching and sharing content privately before anyone raises their hand.
This guide walks you through a practical, step-by-step process for measuring dark social as accurately as possible. You will learn how to audit your current attribution gaps, implement UTM strategies that capture more sharing activity, use survey-based attribution to fill data gaps, and layer in first-party data signals to build a clearer picture of what is actually driving traffic and conversions.
These steps are designed for marketing teams and growth leaders who want to move beyond guesswork and make confident, data-backed decisions about where to invest their budget. Let's get into it.
Step 1: Audit Your Direct Traffic to Find the Dark Social Signal
Before you can measure dark social, you need to understand where it is hiding in your current data. The most reliable starting point is a thorough audit of your direct traffic, broken down by landing page.
Open your analytics platform and pull a direct traffic report segmented by landing page URL. What you are looking for are content-heavy pages, such as blog posts, case studies, research guides, and thought leadership pieces, that are receiving disproportionately high volumes of direct visits relative to their referral and organic traffic.
Here is why this matters. Genuine direct traffic, meaning someone who typed your URL into a browser or clicked a bookmark, almost always lands on your homepage or a product page. When a blog post or case study receives heavy direct traffic, that is a strong signal that people are arriving via copied and pasted links shared in private channels. Nobody is typing a 60-character blog URL from memory.
As you review the data, flag any landing pages where direct traffic exceeds the combined total of referral and organic traffic. These are your priority investigation points and your strongest dark social candidates.
It also helps to understand why analytics tools default to classifying this traffic as direct. Several technical scenarios strip referrer data before it reaches your analytics platform:
HTTPS to HTTP transitions: If a user clicks a link from a secure page and lands on a non-secure page, the referrer is dropped by the browser.
Mobile apps: Most mobile messaging apps, including WhatsApp, iMessage, and LinkedIn mobile, do not pass referrer information when a user taps a link.
Private messaging platforms: Slack, Microsoft Teams, and similar tools typically strip referrer data from outbound links.
Certain email clients: Desktop email clients and some mobile clients do not pass referrer data when a user clicks a link.
Once you understand the mechanics, the pattern in your data becomes much easier to read. Cross-reference your direct traffic findings against your brand's search trend data in Google Search Console. If branded search volume is stable but direct traffic to content pages is spiking, that is a strong indicator of dark social activity rather than genuine direct intent.
Your goal at this stage is a documented list of pages most likely receiving misattributed dark social traffic. This becomes your baseline for everything that follows.
Step 2: Build a UTM Tagging System Designed to Capture Sharing Behavior
UTM parameters are the most accessible and scalable tool available for capturing sharing behavior. The challenge most teams face is not that they lack UTMs, it is that their UTM taxonomy was not designed with dark social in mind.
Start by creating a clear distinction in your UTM structure between public sharing and content that is likely to be forwarded privately. When you publish a blog post or guide and distribute it through your email newsletter, tag that link with specific UTM parameters that identify the source clearly. For example: utm_source=newsletter and utm_medium=email. This allows you to track which original distribution channel triggered downstream sharing activity.
For content you suspect will travel through private channels, consider using identifiers that flag the sharing context. Some teams use utm_medium=private-share or utm_source=dark-social on links embedded in community posts or content specifically designed for peer-to-peer sharing. This creates a traceable signal even when the content moves into private threads.
Shortened, trackable URLs are particularly useful here. When you publish content in a podcast mention, a newsletter, or a LinkedIn post, use a shortened URL with an embedded UTM rather than a raw link. This allows you to track not just the initial click but also identify patterns in how traffic arrives after the original share. If your newsletter link gets 200 clicks but you see 400 sessions arriving from the same campaign UTM over the following week, the gap is likely dark social traffic from forwarded links.
Apply UTM parameters consistently across all owned distribution channels:
Email newsletters: Tag every content link with source, medium, and campaign parameters so you can isolate newsletter-driven traffic from direct traffic.
Webinars and virtual events: Tag resource links shared during the event so you can track post-event sharing behavior.
Gated content and high-value resources: These are commonly forwarded between colleagues. Tag the confirmation page links and follow-up email links so you can track downstream activity.
Social posts: Tag every link you publish on LinkedIn, Twitter, or other platforms so you can distinguish public social clicks from private forwarding.
One critical rule: avoid over-tagging internal links. If your UTM parameters appear on links between your own pages, your analytics data becomes polluted and your dark social signals become much harder to isolate. UTMs belong on external distribution only.
Document your entire UTM taxonomy in a shared tracking sheet that every team member follows. Consistency is everything. A UTM system that three people use differently produces data that nobody can trust.
Step 3: Add a "How Did You Hear About Us?" Field to Key Conversion Points
No tracking pixel can measure intent. No UTM parameter can capture the moment a colleague says "you should check this out" in a Slack message. That is exactly why self-reported attribution, often called an HDYHAU survey, is one of the most valuable tools in your dark social measurement stack.
The concept is straightforward: add an open-text or dropdown attribution question to your highest-intent conversion forms. This includes demo request forms, free trial signups, contact forms, and any other point where a prospect is actively raising their hand.
The question itself should be simple and conversational: "How did you hear about us?" or "What brought you here today?" The options in a dropdown should reflect the real channels through which B2B content actually travels:
A colleague shared it with me captures peer-to-peer sharing through any private channel.
Slack or Teams message specifically calls out the most common B2B dark social environments.
Email from a coworker captures internal email forwarding, which is extremely common in enterprise buying processes.
Word of mouth covers verbal recommendations that leave no digital trace at all.
Podcast or newsletter captures awareness driven by media that your analytics tools often misattribute as direct.
LinkedIn or social media helps separate organic social discovery from paid social exposure.
Keep the field optional but make it prominent. A required field creates friction and reduces overall form completion rates. An optional field that is well-positioned and clearly labeled typically generates enough responses to be statistically useful without hurting conversion rates.
Feed every response directly into your CRM so sales teams can reference the original source during discovery calls. This creates a feedback loop between marketing attribution data and sales conversations, which is particularly valuable for understanding how content influences deals that take months to close.
Review responses on a monthly basis and look for patterns. If a meaningful portion of respondents are citing a specific podcast, community, or internal referral path that your paid attribution tools are not capturing, that is an actionable insight about where your content is actually gaining traction.
Aim for at least 30 to 40 percent of form submissions to include a self-reported attribution response. If you are falling below that threshold, consider adjusting the placement or wording of the question to make it feel more natural within the form flow.
Step 4: Implement Server-Side Tracking to Recover Lost Conversion Signals
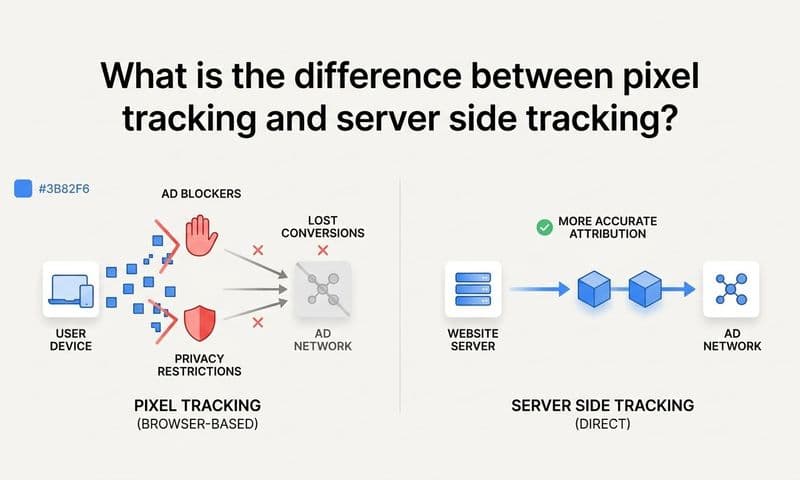
There is a related but distinct problem that compounds the dark social challenge: even when a prospect does arrive from a trackable source, your browser-based pixel may fail to fire correctly. Ad blockers, browser privacy settings, and iOS privacy changes all degrade the signal quality of client-side tracking. When you combine this with the referrer-stripping that characterizes dark social traffic, you end up with significant gaps in your conversion data.
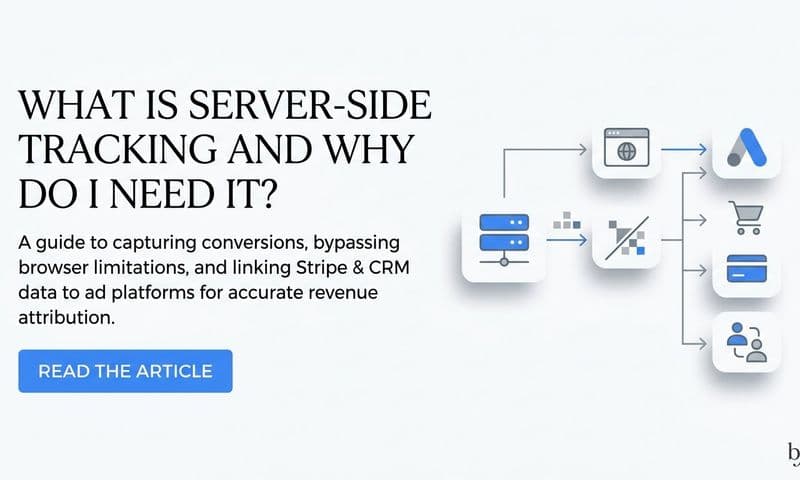
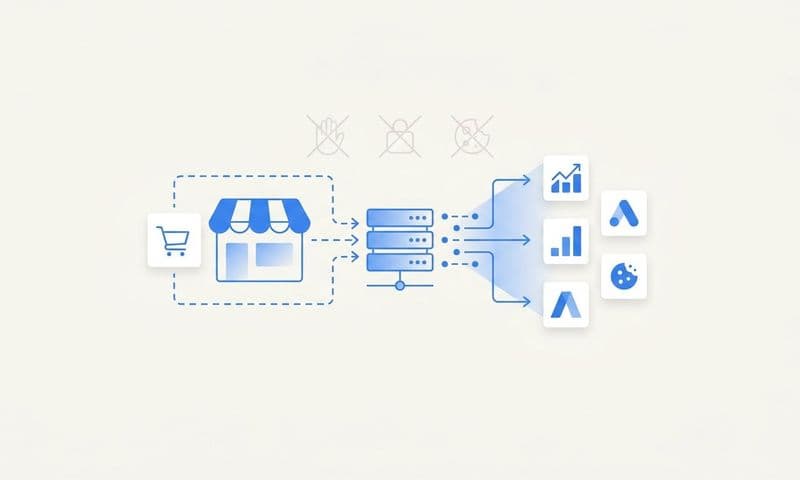
Server-side tracking addresses this directly. Instead of relying on a browser pixel to send conversion data to your ad platforms, server-side tracking sends events directly from your server. The result is more complete, more accurate conversion data that is not subject to browser limitations.
The most important implementation here is a Conversion API integration with your key ad platforms. Meta's Conversion API and Google's Enhanced Conversions both allow you to send first-party conversion events directly from your server, bypassing the browser entirely. This means that even when a user arrives from a dark social channel with no referrer data, the conversion event itself is captured and sent to the ad platform accurately.
To get the most value from server-side tracking, configure your events to include enriched user data. This includes hashed email addresses, lead IDs, and CRM stage information. When your ad platforms receive this enriched data, they can match conversions to earlier ad exposures, even when the user did not click an ad immediately before converting. This is particularly powerful for B2B companies with long sales cycles where multiple ad touchpoints may have influenced a prospect weeks or months before they filled out a form.
Set up event deduplication carefully. When both your browser pixel and your server-side event fire for the same conversion, you risk double-counting. Most ad platforms support deduplication through event IDs, but this needs to be configured explicitly during implementation.
Platforms like Cometly handle server-side tracking and Conversion API integration natively, connecting your ad platform data, CRM events, and website activity into a single attribution view. This eliminates the need to stitch together multiple tools and ensures that conversion signals are recovered and attributed accurately across your entire funnel.
After implementation, monitor your conversion match rates on Meta and Google. An improvement in match rates is a direct indicator that you are recovering signal that was previously lost, which translates to better ad optimization and more accurate attribution reporting.
Step 5: Use Multi-Touch Attribution to Map the Full Customer Journey
Last-click attribution will always undercount dark social. Here is why: the final click in a B2B buying journey often looks like direct traffic. A prospect who first encountered your brand through a piece of content shared in a Slack channel, then returned via branded search, then converted after a direct visit, will be attributed entirely to direct in a last-click model. The content that started the entire journey gets zero credit.
Switching to a multi-touch attribution model distributes credit across all touchpoints in the customer journey, including those that originally triggered private sharing. This gives you a much more accurate picture of which content and channels are actually influencing pipeline.
Linear attribution assigns equal credit to every touchpoint in the journey. Time-decay attribution gives more credit to touchpoints closer to the conversion, while still acknowledging earlier influences. Both models are significant improvements over last-click for B2B companies with complex, multi-session buying journeys.
As you analyze your multi-touch data, look for a specific pattern: direct traffic sessions appearing consistently mid-funnel after a specific content piece or ad campaign. This is one of the clearest signals that dark social is part of your conversion path. A prospect sees your LinkedIn post, shares it in a team channel, and three colleagues visit your site directly. In a multi-touch model, you can see that cluster of direct sessions following the original LinkedIn touchpoint and draw a reasonable inference about what caused them.
Use customer journey analytics to visualize how prospects move through multiple sessions before converting. When you see clusters of direct sessions following paid or organic touchpoints, you are likely looking at dark social activity. The content that generated the original touchpoint deserves attribution credit for those downstream conversions.
Compare your multi-touch attribution outputs side by side with your last-click data. The channels that gain credit in the multi-touch model are the ones being systematically undercredited in your current reporting. This comparison is often eye-opening for teams that have been making budget decisions based on last-click data alone.
A well-configured multi-touch attribution report will show a more distributed credit spread across channels, with direct traffic appearing as a mid-funnel touchpoint that connects to upstream content rather than an unexplained anomaly in your data.
Step 6: Monitor Brand Search Volume as a Dark Social Proxy Metric
Here is something that many B2B marketing teams overlook: when dark social activity increases, branded search volume typically rises alongside it. When someone receives a shared link in a Slack message or an email forward, they often do not click the link directly. Instead, they search for the brand name in Google. This creates a measurable signal in your search data even when the original referral source is invisible to your analytics platform.
This makes branded search volume one of the most useful proxy metrics for dark social activity. It is not a perfect measure, but it is a consistent and trackable signal that correlates with content circulation in private channels.
Start by tracking branded keyword search impressions and clicks in Google Search Console on a weekly basis. Export this data into a simple spreadsheet and align it with your content publishing calendar. When you publish a new piece of content and distribute it through your owned channels, watch for branded search spikes in the days and weeks that follow.
Set up alerts for significant week-over-week increases in branded search volume. A sudden spike that does not correspond to a paid brand campaign or a major PR moment is worth investigating. Cross-reference the timing with your content distribution schedule to identify which piece may have triggered the increase.
Combine this branded search data with the direct traffic audit you completed in Step 1. When both direct traffic to a specific content page and branded search volume spike around the same time, you have a strong composite signal that a piece of content is circulating through private channels. This two-signal approach is more reliable than either metric in isolation.
Over time, this process allows you to build a dark social signal score for each piece of content you publish. Content that consistently generates branded search spikes and direct traffic increases is your highest-performing dark social asset, even if your standard attribution reports are giving it little credit.
This insight is directly actionable. When you identify content that performs strongly on these proxy metrics, you can prioritize producing more content in the same format, on the same topics, and distributed through the same channels that originally seeded the sharing.
Putting It All Together: Your Dark Social Measurement Framework
Measuring dark social is not a one-time project. It is an ongoing practice that requires consistent monitoring, regular refinement, and a willingness to work with imperfect data. No single method captures dark social completely. The power comes from layering these approaches so that each one fills the gaps left by the others.
Here is your quick-reference checklist for the complete framework:
1. Direct traffic audit: Identify content pages receiving disproportionate direct traffic as your dark social baseline.
2. UTM taxonomy: Build a consistent tagging system that distinguishes public distribution from private sharing behavior.
3. Self-reported attribution: Add an HDYHAU field to high-intent conversion forms and feed responses into your CRM.
4. Server-side tracking: Implement Conversion API integration to recover lost conversion signals that browser pixels miss.
5. Multi-touch attribution: Switch to a model that distributes credit across the full customer journey rather than rewarding only the last click.
6. Branded search monitoring: Track weekly branded search volume in Google Search Console as a proxy signal for dark social activity.
Dark social measurement is an ongoing process. Review your data monthly, refine your UTM taxonomy as new channels emerge, and keep your self-reported attribution options updated to reflect how your audience is actually sharing content.
Cometly brings all of these signals together in one place, connecting your ad platform data, CRM events, server-side conversions, and customer journey analytics into a unified attribution view. Instead of manually stitching together data from five different tools, you get a single source of truth that shows exactly which touchpoints are driving pipeline and revenue, including the ones that dark social would otherwise hide.
If you are ready to close the dark social attribution gap and make more confident budget decisions, Get your free demo and see how Cometly can help you capture every touchpoint that matters.